
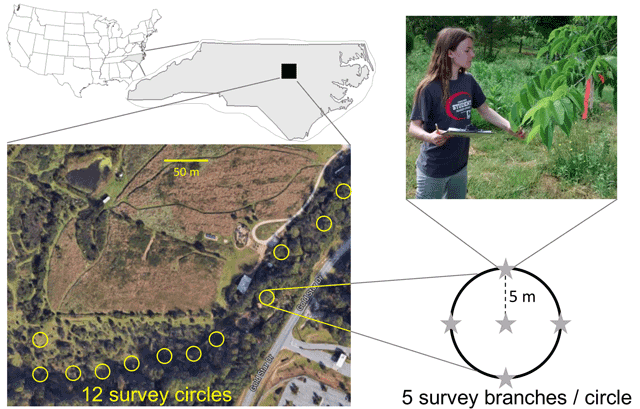
Figure 1
Location of Prairie Ridge Ecostation within North Carolina, and the layout of survey circles at that site. Each survey circle consists of five foliage arthropod surveys. Photo credits: Google Earth; Allen Hurlbert.
Table 1
Common arthropod groups found on foliage that citizen scientist participants are expected to be able to identify.
| Common name | Scientific name | Taxonomic level | Distinguishing features |
|---|---|---|---|
| Ants | Formicidae | Family | Narrow waist, no wings; elbowed antennae. |
| Aphids, Psyllids | Sternorrhyncha | Suborder, Order Hemiptera | Small (just a few mm); aphids are pear-shaped. |
| Bees, Wasps | Hymenoptera (excluding Formicidae) | Order | 2 pairs of wings with the hindwings smaller than the frontwings; wasps have narrow waists but bees do not. |
| Beetles | Coleoptera | Order | A straight line down the back where the two hard wing casings (elytra) meet. |
| Caterpillars | Lepidoptera (larvae) | Order | Soft, cylindrical body with 6 legs and up to 5 pairs of prolegs. |
| Daddy longlegs | Opiliones | Order | 8 very long legs; they appear to have a single oval-shaped body. |
| Flies | Diptera | Order | A single pair of wings. |
| Grasshoppers, Crickets | Orthoptera | Order | Usually with enlarged hind legs for jumping. |
| Leafhoppers, Cicadas | Auchenorrhyncha | Suborder, Order Hemiptera | Usually a wide head relative to the body; hoppers have wings folded tentlike over their back, while cicadas have large membranous wings. |
| Moths, Butterflies | Lepidoptera (adults) | Order | 4 large wings covered by fine scales. |
| Spiders | Araneae | Order | 8 legs, with two distinct body segments: the cephalothorax and abdomen. |
| True Bugs | Heteroptera | Suborder, Order Hemiptera | Semi-transparent wings which partially overlap creating a triangle or X shape on the back; often has pointy “shoulders”. |
Table 2
Number of participants and number of surveys conducted from May through July for each data collection group and year. Survey method abbreviations: V, visual survey; B, beat sheet survey; F, frass monitoring.
| Group | Year | Survey method | # of participants | # surveys conducted per person | Total # surveys | Time of day |
|---|---|---|---|---|---|---|
| Trained scientists | 2015 | V, B, F | 5 | 1662 | 8310 | am, pm |
| Citizen scientists | 2015 | V | 7 | 166 | 1165 | am, pm |
| Trained scientists | 2016 | V, B | 5 | 1111 | 5553 | am |
| Citizen scientists | 2016 | B | 4 | 185 | 739 | am |

Figure 2
Comparison of caterpillar phenology (fraction of surveys on which at least one caterpillar was detected) at Prairie Ridge Ecostation in 2015 based on morning beatsheet surveys (black solid line), morning visual surveys (black dashed line), and afternoon beatsheet surveys (gray solid line).
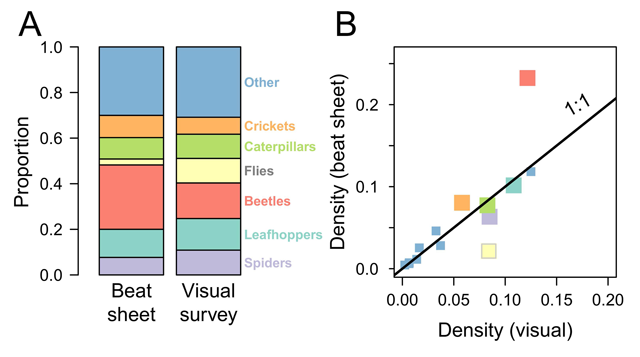
Figure 3
(a) Variation in the proportion of arthropod groups by survey methodology. (b) Comparison of absolute density estimates of different arthropod groups based on survey methodology. Data were collected by trained scientists in both 2015 and 2016. (A comparison of caterpillar phenology observed by these two methods is presented in Figure 2.)

Figure 4
Comparison of the proportion of arthropods observed by citizen scientists versus trained scientists using (a) visual surveys in 2015 and (b) beat sheet surveys in 2016. (c) Comparison of absolute density estimates of different arthropod groups based on whether the data were collected by citizen or trained scientists.

Figure 5
Seasonal phenology in occurrence at Prairie Ridge Ecostation of (a, b) caterpillars, (c, d) orthopterans, and (e, f) a multi-group category including caterpillars, orthopterans, beetles, spiders, leafhoppers, and true bugs based on visual surveys (a, c, e) and beat sheet surveys (b, d, f). Pearson’s correlation coefficient between weekly estimates collected by citizen scientists (light gray) and trained scientists (black) given in the top right. Caterpillar frass phenology in 2015 is shown for comparison in (a).
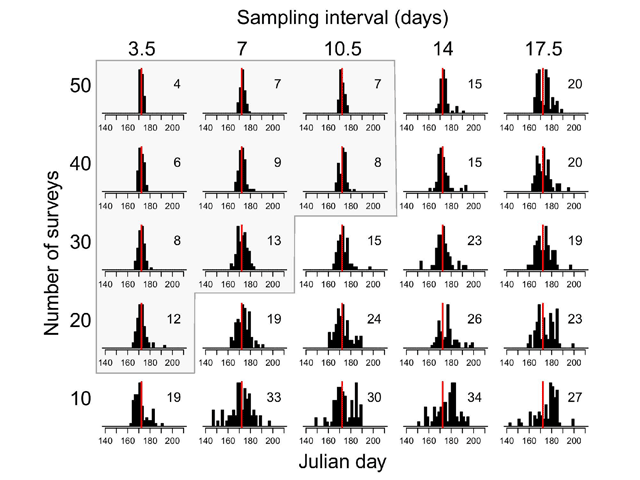
Figure 6
Estimates of peak caterpillar date based on subsampling the trained scientist beat sheet dataset of 2015 to different levels of sampling intensity (rows) and sampling frequency (columns). The “true” estimated peak date based on conducting 60 surveys twice a week was Julian day 172 (June 21; red line). Each histogram indicates the range of peak date estimates based on 60 replicate subsamples for the specified level of sampling frequency and intensity, with the 95% confidence interval width in days in the upper right corner. Sampling combinations in the gray box have confidence intervals of 13 days or less.