

Figure 1
The Yukon River Basin in Alaska and Canada showing all ION sample locations from 2006–2014. Triangles identify major cities in the basin as well as the village and sampling location of Pilot Station, from which the water-quality data used in this study were obtained.
Table 1
Summary of protocols, laboratories, and equipment for each program discussed in this paper. All three programs used high-density polyethylene storage bottles.
| Program | Analytical laboratory | Analytical instrumentation | Sample collection | Sample processing and storage |
|---|---|---|---|---|
| Indigenous Observation Network (ION) | USGS Project Laboratories | Ion Chromatography; Inductively Coupled Plasma – Atomic Emission Spectroscopy | 1 grab sample | 45-µm glass microfiber syringe filters |
| National Water Quality Network (NWQN) | USGS National Water Quality Laboratory | Ion Chromatography; Inductively Coupled Plasma – Atomic Emission Spectroscopy | equal discharge increment | 45-µm polyester-reinforced polysulfone capsule filters |
| Arctic Great Rivers Observatory (Arctic GRO) | Woods Hole Research Center | Ion Chromatography; Inductively Coupled Plasma-Mass Spectrometry | 3 grab samples | 45-µm polyester-reinforced polysulfone capsule filters |
Table 2
Statistics on community participation by technicians (total number = 160) in ION over the years 2006–2014.
| Average | Range | Standard Deviation | |
|---|---|---|---|
| No. of samples per technician | 6 | 1–60 | 9.6 |
| Years participating per community | 5 | 1–9 | 2.8 |
| No. of years sampling per technician | 1.5 | 1–8 | 1.3 |
| No. of samples collected per year per technician | 4 | 1–34 | 3.9 |
| No. of sites per community | 1 | 1–4 | 1.2 |
| No. of samplers per community | 9 | 1–24 | 30.8 |
Table 3
Community participation in ION at Pilot Station over the years 2006–2014. [NA = not applicable].
| Average | Range | Standard Deviation | |
|---|---|---|---|
| No. of samples per technician | 11 | 3–23 | 7.5 |
| Years participating per community | NA | 9 | NA |
| No. of years sampling per technician | 2.4 | 1–6 | 1.8 |
| No. of samples collected per year per technician | 3.0 | 1–7 | 2.0 |
| No. of sites per community | NA | 1.0 | NA |
| No. of samplers per community | NA | 6 | NA |
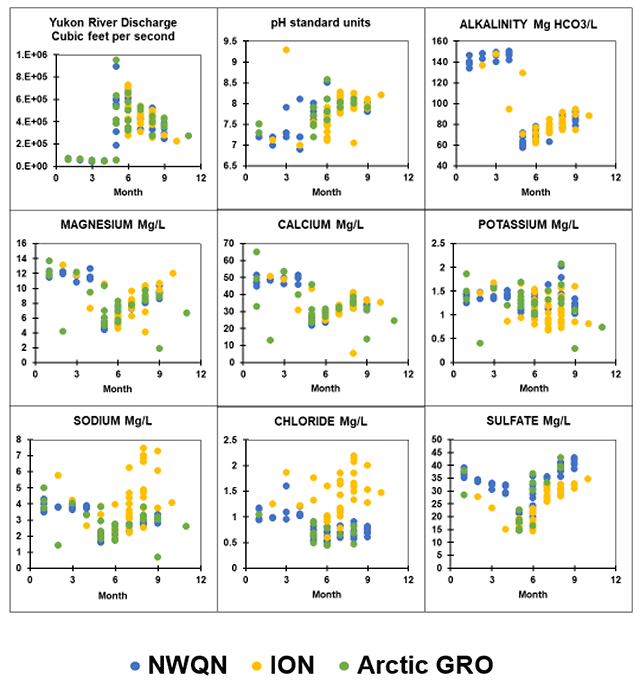
Figure 2
Instantaneous daily discharge of the Yukon River at Pilot Station corresponding to the date of sampling events and associated water quality parameter values from 2007–2014 from the National Water Quality Network (NWQN), Indigenous Observation Network (ION), and Arctic Great Rivers Observatory (Arctic GRO) projects.

Figure 3
Box-plots of data reported by each project. [NWQN, National Water Quality Network; ION, Indigenous Observation Network; Arctic GRO, Arctic Great Rivers Observatory; Mg/L, milligrams per liter; HCO3, bicarbonate].
Table 4
Results of the paired t-test analysis comparing NWQN and Arctic GRO results. Values represent the probability that concentrations or loads were the same. Probabilities have been adjusted for the number of comparisons made. * significant (p < 0.05) ** highly significant (p < 0.01). [n, number of samples; Cl, Chloride; SO4, Sulfate; Ca, Calcium; K, Potassium; Mg, Magnesium; Na, Sodium; Alk, Alkalinty; mg/L miligrams per liter; HCO3/L milligrams of bicarbonate per liter; NWQN, National Water Quality Network; Arctic GRO, Arctic Great Rivers Observatory; na = not available].
| Constituent | n | NWQN vs Arctic GRO |
|---|---|---|
| Cl concentration mg/L | 11 | 0.09 |
| SO4 concentration mg/L | 13 | 0.62 |
| Ca concentration mg/L | 17 | 0.37 |
| K concentration mg/L | 17 | 0.05 |
| Mg concentration mg/L | 17 | 0.08 |
| Na concentration mg/L | 17 | 0.13 |
| Alk mg HCO3/L | 0 | Na |
Table 5
Results of the paired t-test analysis comparing ION vs. “Professional” results (those from either NWQN or Arctic GRO). Values in the table represent the probability that concentrations or loads were the same. Probabilities have been adjusted for the number of comparisons made. * significant (p < 0.05) ** highly significant (p < 0.01). [n, number of samples; Cl, Chloride; SO4, Sulfate; Ca, Calcium; K, Potassium; Mg, Magnesium; Na, Sodium; Alk, Alkalinty; mg/L miligrams per liter; HCO3/L milligrams of bicarbonate per liter; ION, Indigenous Observation Network; <, less than].
| Constituent | n | “Professional” vs ION | |
|---|---|---|---|
| Cl concentration mg/L | 9 | 0.026 | * |
| SO4 concentration mg/L | 9 | <0.001 | ** |
| Ca concentration mg/L | 15 | 0.49 | |
| K concentration mg/L | 15 | 0.46 | |
| Mg concentration mg/L | 15 | 0.33 | |
| Na concentration mg/L | 15 | 0.15 | |
| Alk mg HCO3/L | 8 | 0.96 | |
Table 6
Summary of One-way analysis of variance (ANOVA) and Kruskal-Wallis comparing the groups of collectors. If significant differences were found, the differences column indicates which specific differences were significant. [F-value, F-statistic associated with analysis of variance; p, Probability; KW p, Kruskal-Wallis probability; ION, Indigenous Observation Network; NWQN, National Water Quality Network, Arctic-GRO, Arctic Great Rivers Observatory; <, less than; >, greater than].
| Variable | F-Value | p | KW p | Differences |
|---|---|---|---|---|
| pH | 0.71 | 0.49 | 0.54 | |
| Cl | 48.3 | <0.001 | <0.001 | ION > NWQN, Arctic GRO |
| SO4 | 6.61 | 0.002 | 0.001 | ION < Arctic GRO < NWQN |
| Ca | 1.14 | 0.32 | 0.73 | |
| K | 4.81 | 0.010 | 0.006 | ION < Arctic GRO < NWQN |
| Mg | 0.65 | 0.53 | 0.65 | |
| Na | 13.6 | <0.001 | 0.001 | ION > NWQN, Arctic GRO |
| Alk | 4.15 | 0.045 | 0.43 |
Table 7
Summary of Two-way analysis of variance (ANOVA) comparing the collector groups with the interaction of sampling years. If significant differences were found, the “Differences” column indicates which specific differences were significant. [F-value, F-statistic associated with ANOVA; p, probability; NWQN, National Water Quality Network; Arctic GRO, Arctic Great Rivers Observatory; ION, Indigenous Observation Network; Early, 2007–08 combined with 2009–10; Mid, 2013–14; <, less than; >, greater than].
| Parameter | Source | F-Value | p | Differences |
|---|---|---|---|---|
| pH | Collector only | 1.23 | 0.27 | |
| Year and Collector | 0.34 | 0.80 | ||
| Cl | Collector only | 67.3 | <0.001 | ION > NWQN, Arctic GRO |
| Year and Collector | 0.49 | 0.61 | ||
| SO4 | Collector only | 12.6 | 0.001 | ION < NWQN |
| Year and Collector | 1.62 | 0.19 | ||
| Ca | Collector only | 0.86 | 0.36 | |
| Year and Collector | 0.36 | 0.70 | ||
| K | Collector only | 17.7 | <0.001 | ION < NWQN |
| Year and Collector | 3.46 | 0.02 | ION Early, ION Mid < NWQN Early, NWQN Mid | |
| Mg | Collector only | 0.00 | 0.96 | |
| Year and Collector | 0.03 | 0.97 | ||
| Na | Collector only | 10.13 | 0.002 | ION > NWQN, Arctic GRO |
| Year and Collector | 2.47 | 0.093 | ||
| Alk | Collector only | 2.18 | 0.15 | |
| Year and Collector | 0.48 | 0.62 |