
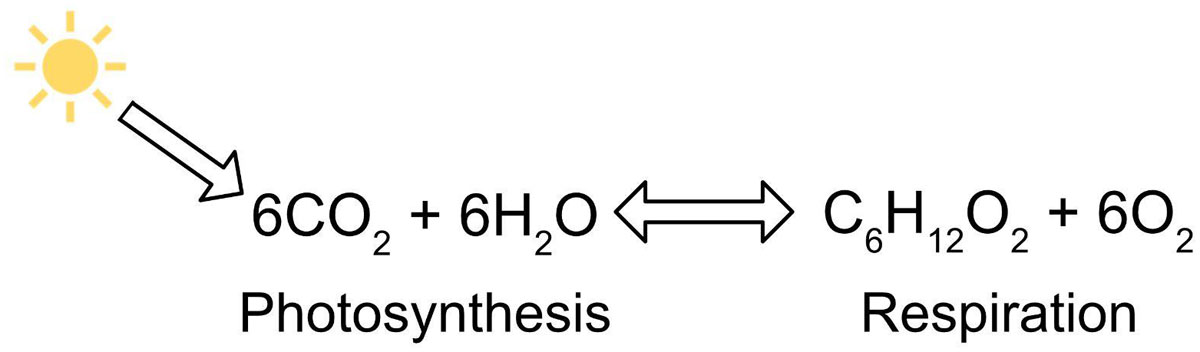
Figure 1
Photosynthesis and respiration equation.
Table 1
Agenda for the workshop, time spent on each activity, and educational standards for Next Generation Science Standards (NGSS), Ocean Literacy Principles (OLP), California Common Core Standards: Reading Standards for Literacy in Science and Technical Subjects 6–12 (CCCS-R), California Common Core Standards: Writing Standards for Literacy in History/Social Studies, Science, and Technical Subjects 6–12 (CCCS-W), and A Framework for K-12 Science Education (Framework).
| LOCATION | AGENDA | EDUCATIONAL STANDARDS | |
|---|---|---|---|
| Day one | USC’s University Park Campus | Introduction to marine microbial ecology lecture (2 h), Thrash Lab tour (2 h), Lesson 1: Exploring the Diversity of Marine Microbes (2 h) | NGSS HS-LS2-6 & HS-LS2-2; OLP 2, 3, 5; CCCS-R 3 & 4; CCCS-W 2 & 7; Framework PS3.D, LS4.C, LS2.B, ESS2.D, ESS3.D |
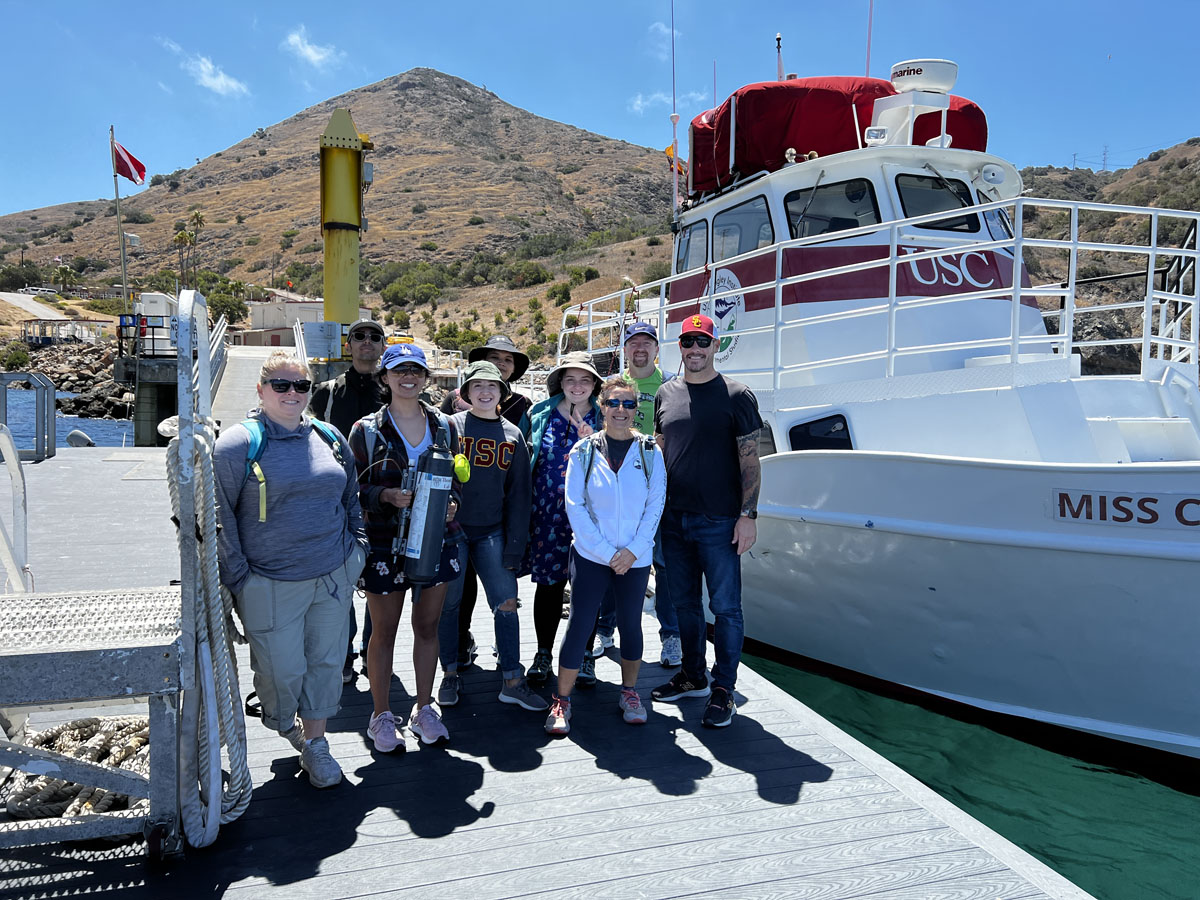
| Day two | Wrigley Institute for Environmental Studies (WIES) on Catalina Island, California | Lesson 1: Exploring the Diversity of Marine Microbes (3 h), research lab tours (3 h) | NGSS HS-LS2-6 & HS-LS2-2; OLP 2, 3, 5; CCCS-R 3 & 4; CCCS-W 2 & 7; Framework PS3.D, LS4.C, LS2.B, ESS2.D, ESS3.D |
| Day three | USC’s University Park Campus | Lesson 2: Bacterial Ecology and Physiology (2 h) | NGSS HS-LS2-2 & HS-LS2-6; OLP 2, 3, 5; CCCS-R 3 & 4; CCCS-W 2 & 7; Framework LS2.B, ESS2.D, ESS3.D |
| Lesson 3: Circulation of Nutrients (2 h) | NGSS HS-ESS3-5 & HS-ESS2-2; OLP 1, 2, 3; CCCS-R 3 & 4; CCCS-W 2 & 7; Framework LS2.B, ESS2.D, ESS3.D | ||
| Lesson 4: Deoxygenation and Measuring Dissolved Oxygen (2 h) | NGSS HS-ESS3-5 & HS-ESS2-2; OLP 1, 3, 4, 5; CCCS-R 3 & 4; CCCS-W 2 & 7; Framework LS2.B, ESS2.D, ESS3.D |
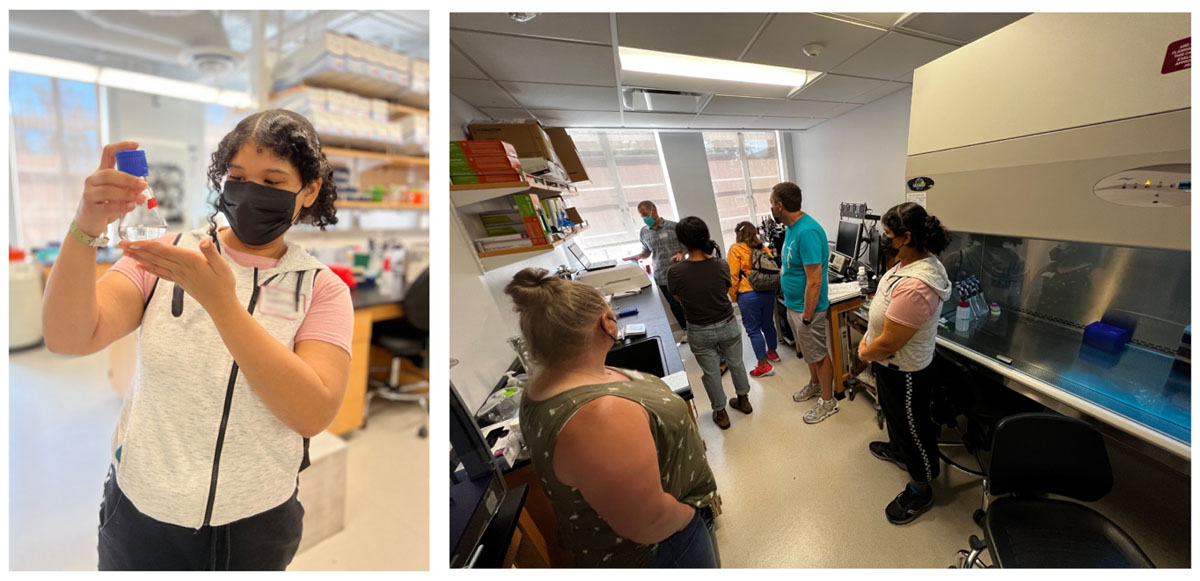
Figure 2
Educators look at a culture flask full of microbes (left) and learn about flow cytometry and cell sorting (right). Photos by Dr. Dieuwertje Kast.
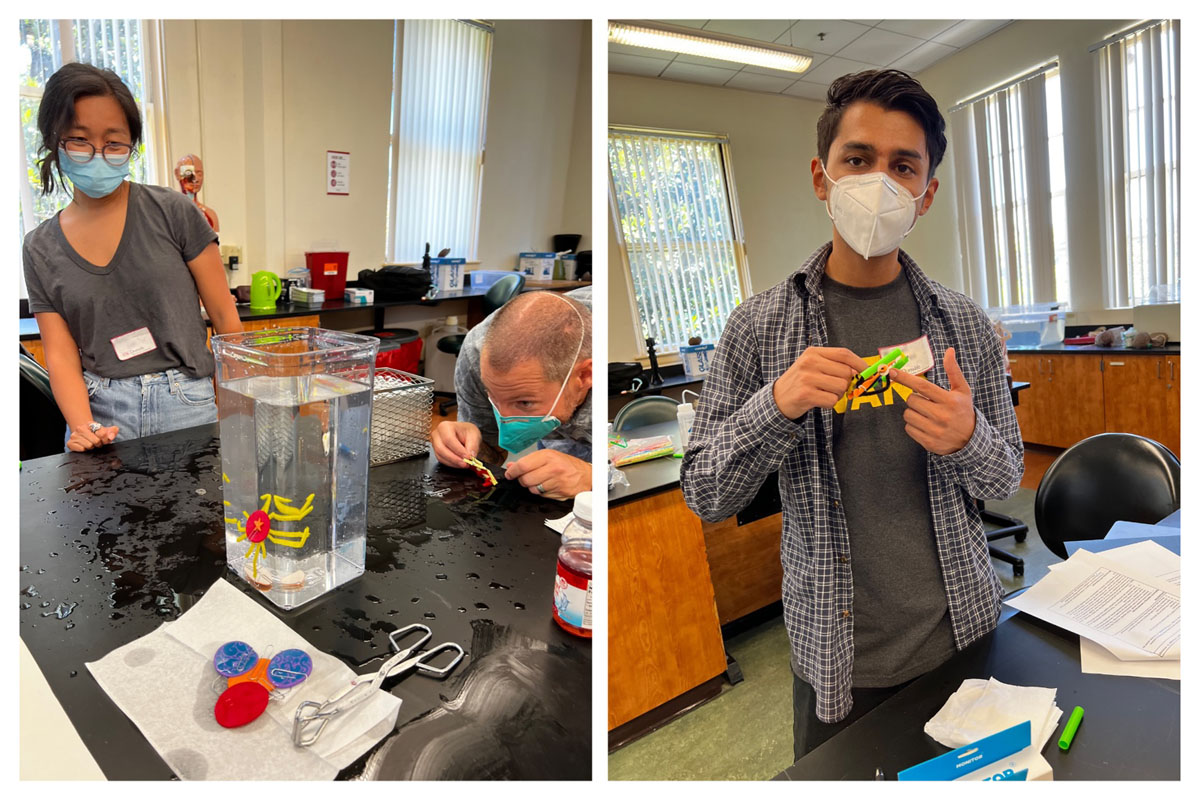
Figure 3
Teachers participate in the great plankton race activity from Lesson 1. A few examples of the phytoplankton teachers created are displayed. Photos by Dr. Dieuwertje Kast.
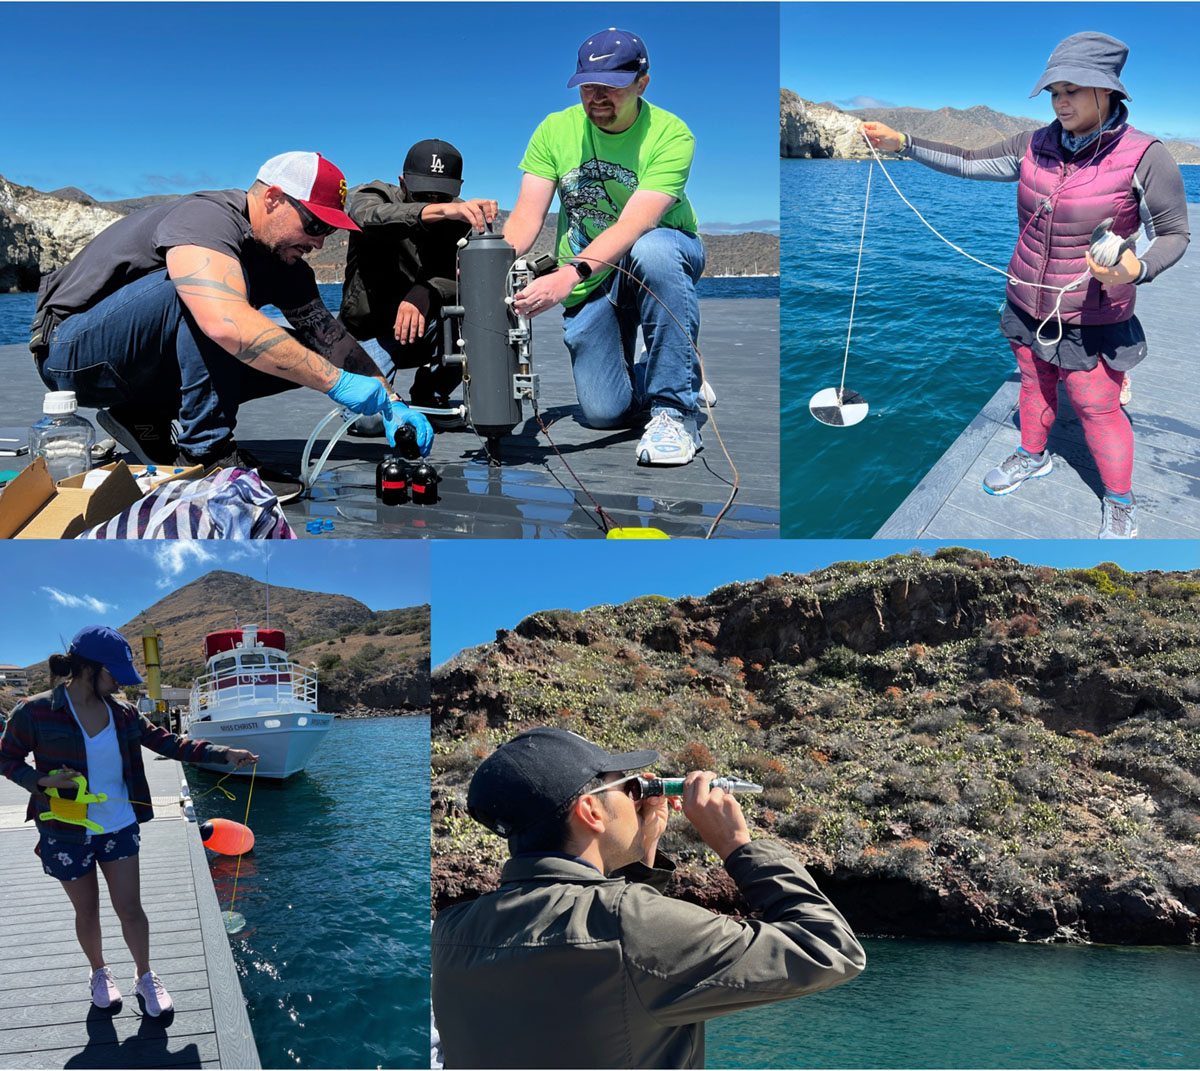
Figure 4
Educators take turns collecting water in a Niskin bottle to measure dissolved oxygen with an optode sensor (top left), measuring turbidity with a Secchi disk (top right), collecting phyto- and zooplankton in net tows (bottom left), and measuring salinity with a refractometer (bottom right). Photos by Dr. Dieuwertje Kast.

Figure 5
Educators use microscopes at WIES to look at the phyto- and zooplankton samples they collected (left). One microscope was connected to a screen to project the view under the scope (right). Photos by Dr. Dieuwertje Kast and Kyla Kelly.
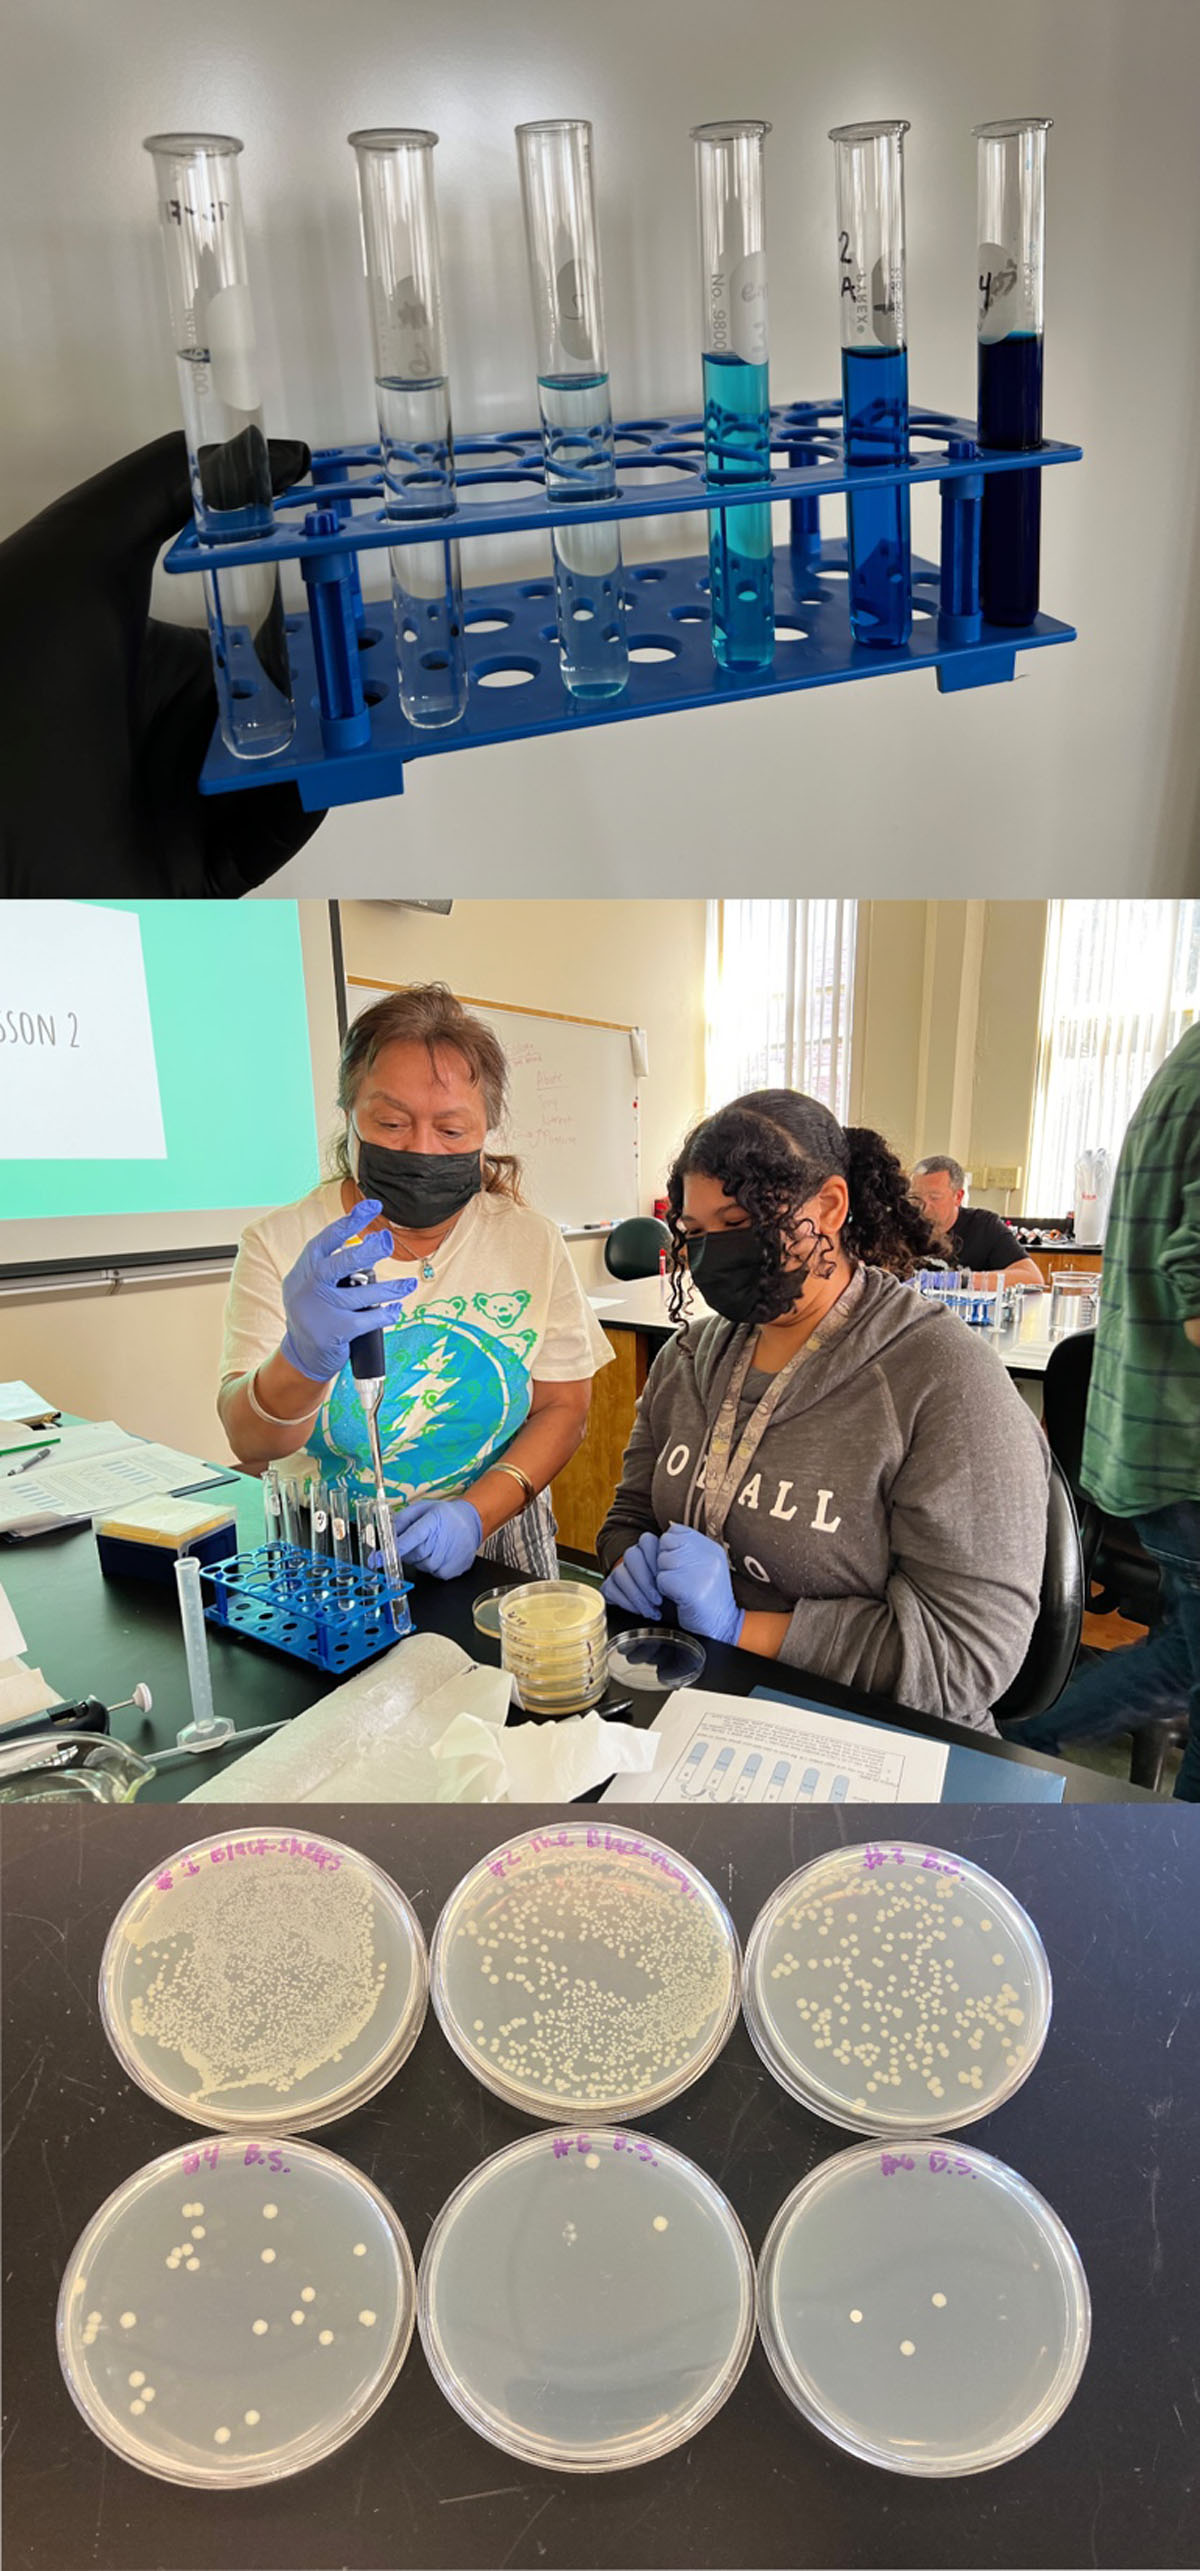
Figure 6
A visual example of serial dilutions was made using food coloring and distilled water (top). In Lesson 2, teachers performed serial dilutions with bacterial cultures and plated them on agar (middle). Twenty-four hours later, the number of bacterial colonies on each plate were counted and quantified (bottom). Photos by Dr. Dieuwertje Kast and Kyla Kelly.
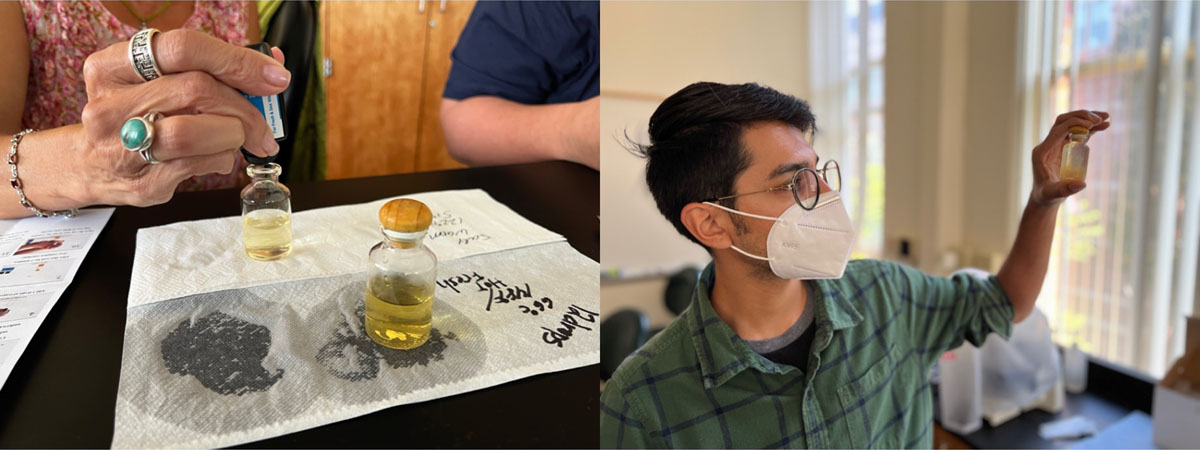
Figure 7
Teachers measure dissolved oxygen content of water samples with different salinities and temperatures in Lesson 4. Photos by Dr. Dieuwertje Kast.
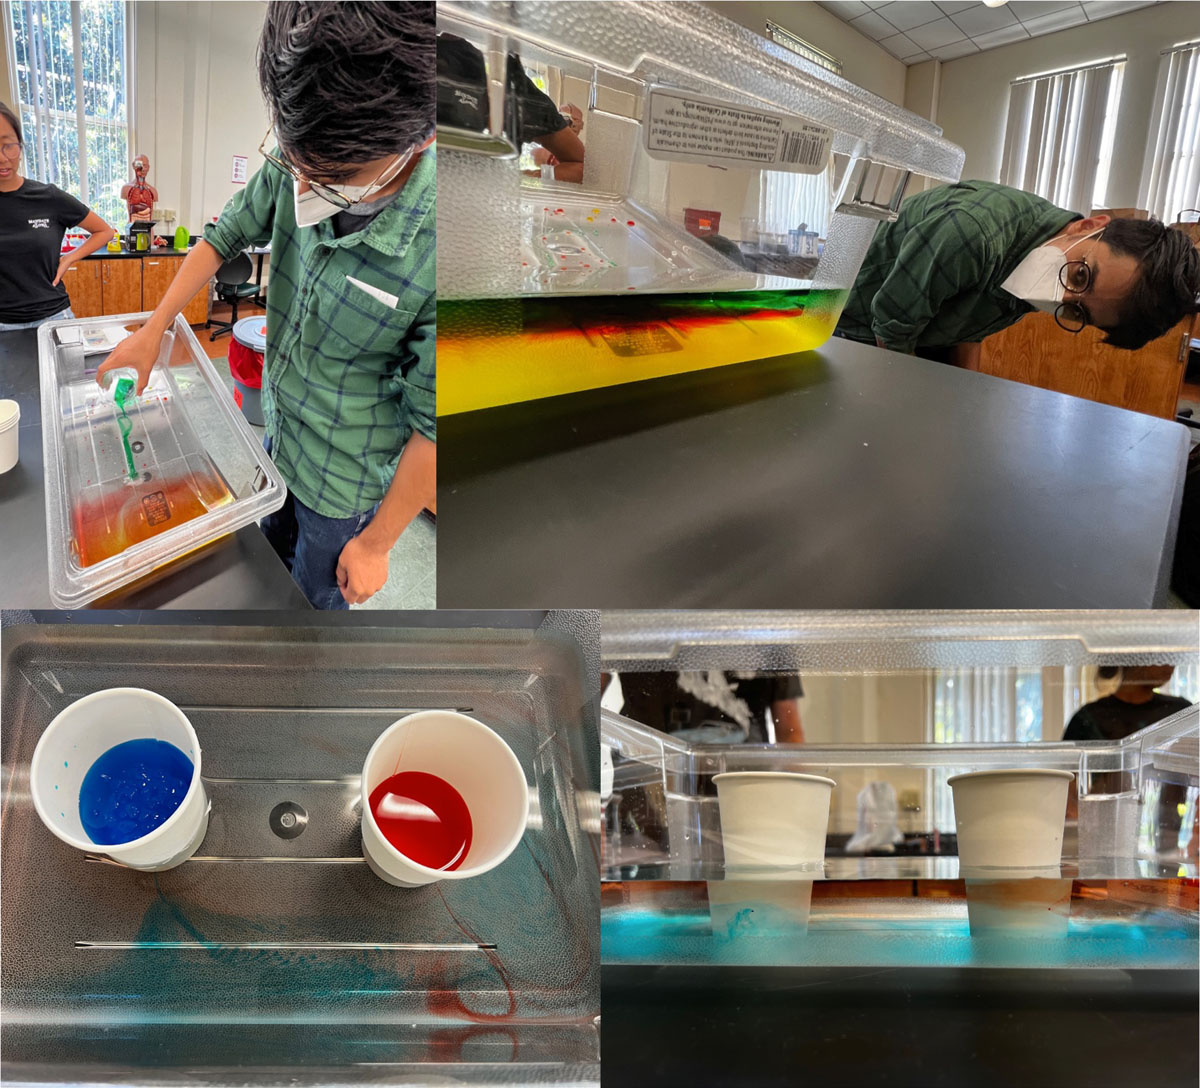
Figure 8
In Lesson 3, educators poured water of different densities down a gently sloping surface (top left). The different water bodies (indicated by different colors) separated into layers based on density (top right). To demonstrate the separation of bodies of water with different densities, cups with cold, saline water (blue) and hot, fresh water (red) were placed in a shallow container of water (bottom left). Holes were poked in the cups to allow water to slowly trickle out. The water masses separated in the container, based on density (bottom right). Photos by Dr. Dieuwertje Kast.
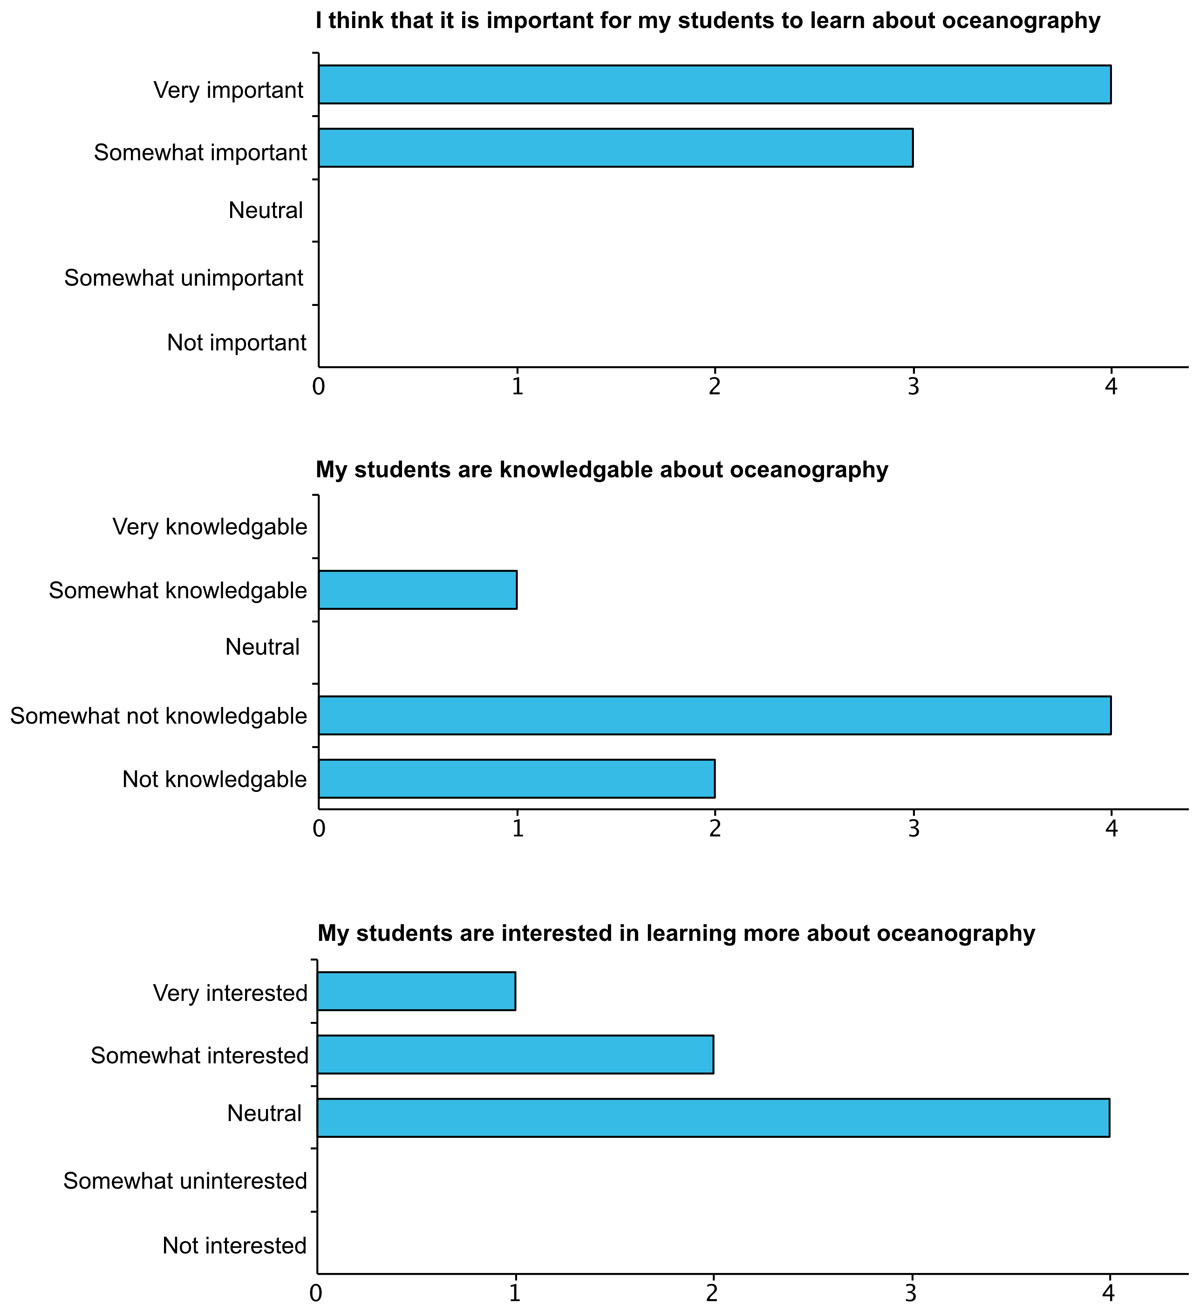
Figure 9
Educator survey responses from the pre-knowledge assessment. Educators were asked to rank the following statements on the provided scale. Of the 8 teachers that attended the workshop, 7 responded to the surveys.