
Table 1
The NGSS standards, Science and Engineering Practices, and Crosscutting Concepts addressed by the Plankton Sinking Rate Challenge activity. Generally, this activity takes two to three 60-minute class periods.
| NGSS STANDARD | WHAT IT LOOKS LIKE IN THE CLASSROOM | |
|---|---|---|
| NGSS D.C.I. | MS/HS-ETS1.A; Define the criteria and constraints of a design problem with sufficient precision to ensure a successful solution, taking into account relevant scientific principles and potential impacts on people and the natural environment that may limit possible solutions. MS/HS-ETS1.B Evaluate competing design solutions using a systematic process to determine how well they meet the criteria and constraints of the problem. MS/HS-ETS1.C Analyze data from tests to determine similarities and differences among several design solutions to identify the best characteristics of each that can be combined into a new solution to better meet the criteria for success. MS/HS-LS1 Analyze and interpret data to provide evidence for the effects of resource availability on organisms and populations of organisms in an ecosystem. MS/HS-LS4 Use argument based on empirical evidence and scientific reasoning to support an explanation for how characteristic animal behaviors and specialized plant structures affect the probability of successful reproduction of animals and plants respectively. |
|
| Science and Engineering Practices | S.1A.1 asking questions and defining problems S.1A.3 planning and carrying out investigation; S.1A.6 constructing explanations and designing solutions S.1A.7 engaging in argument from evidence |
|
| Crosscutting Concepts |
|
|
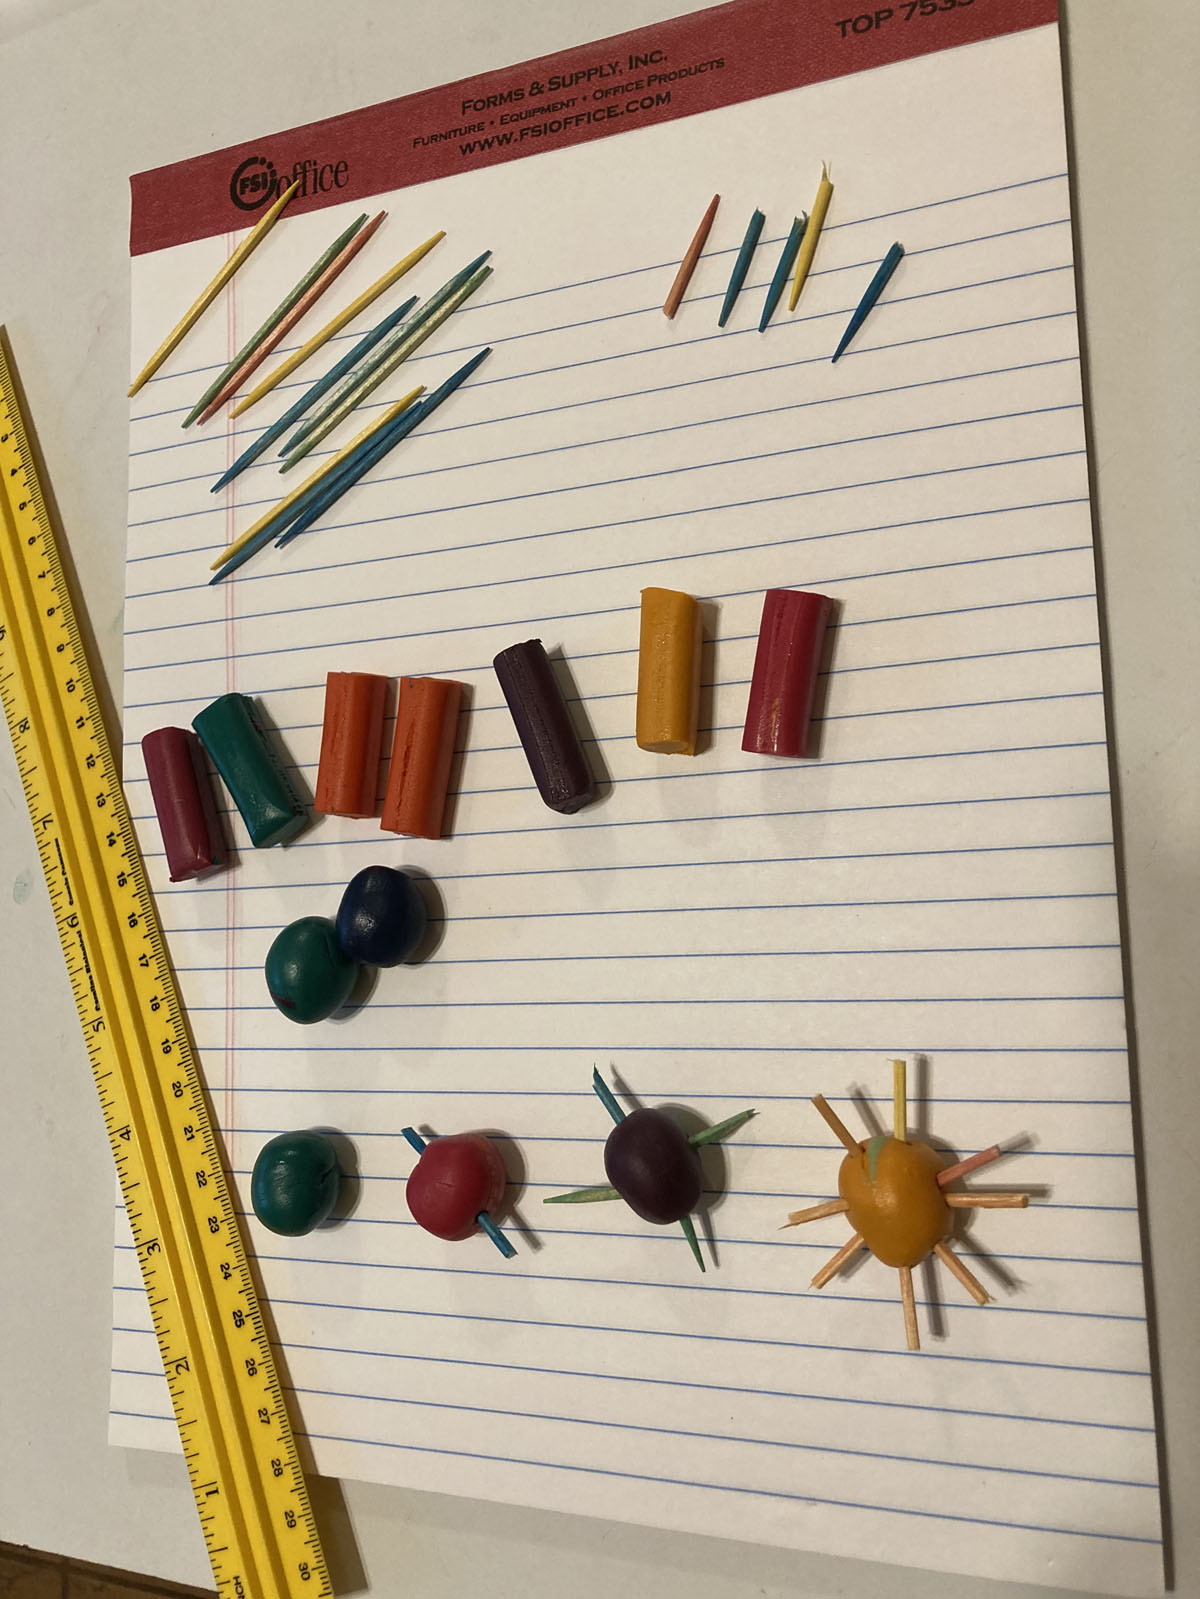
Figure 1
Part one has students test how the number of spines on the clay plankton affects sinking rate. Spines are arranged symmetrically, and are of equal length (3 cm). Clay plankton are the size of a medium marble. Photo: Lisa Pike Reproduced with permission of the photographer.
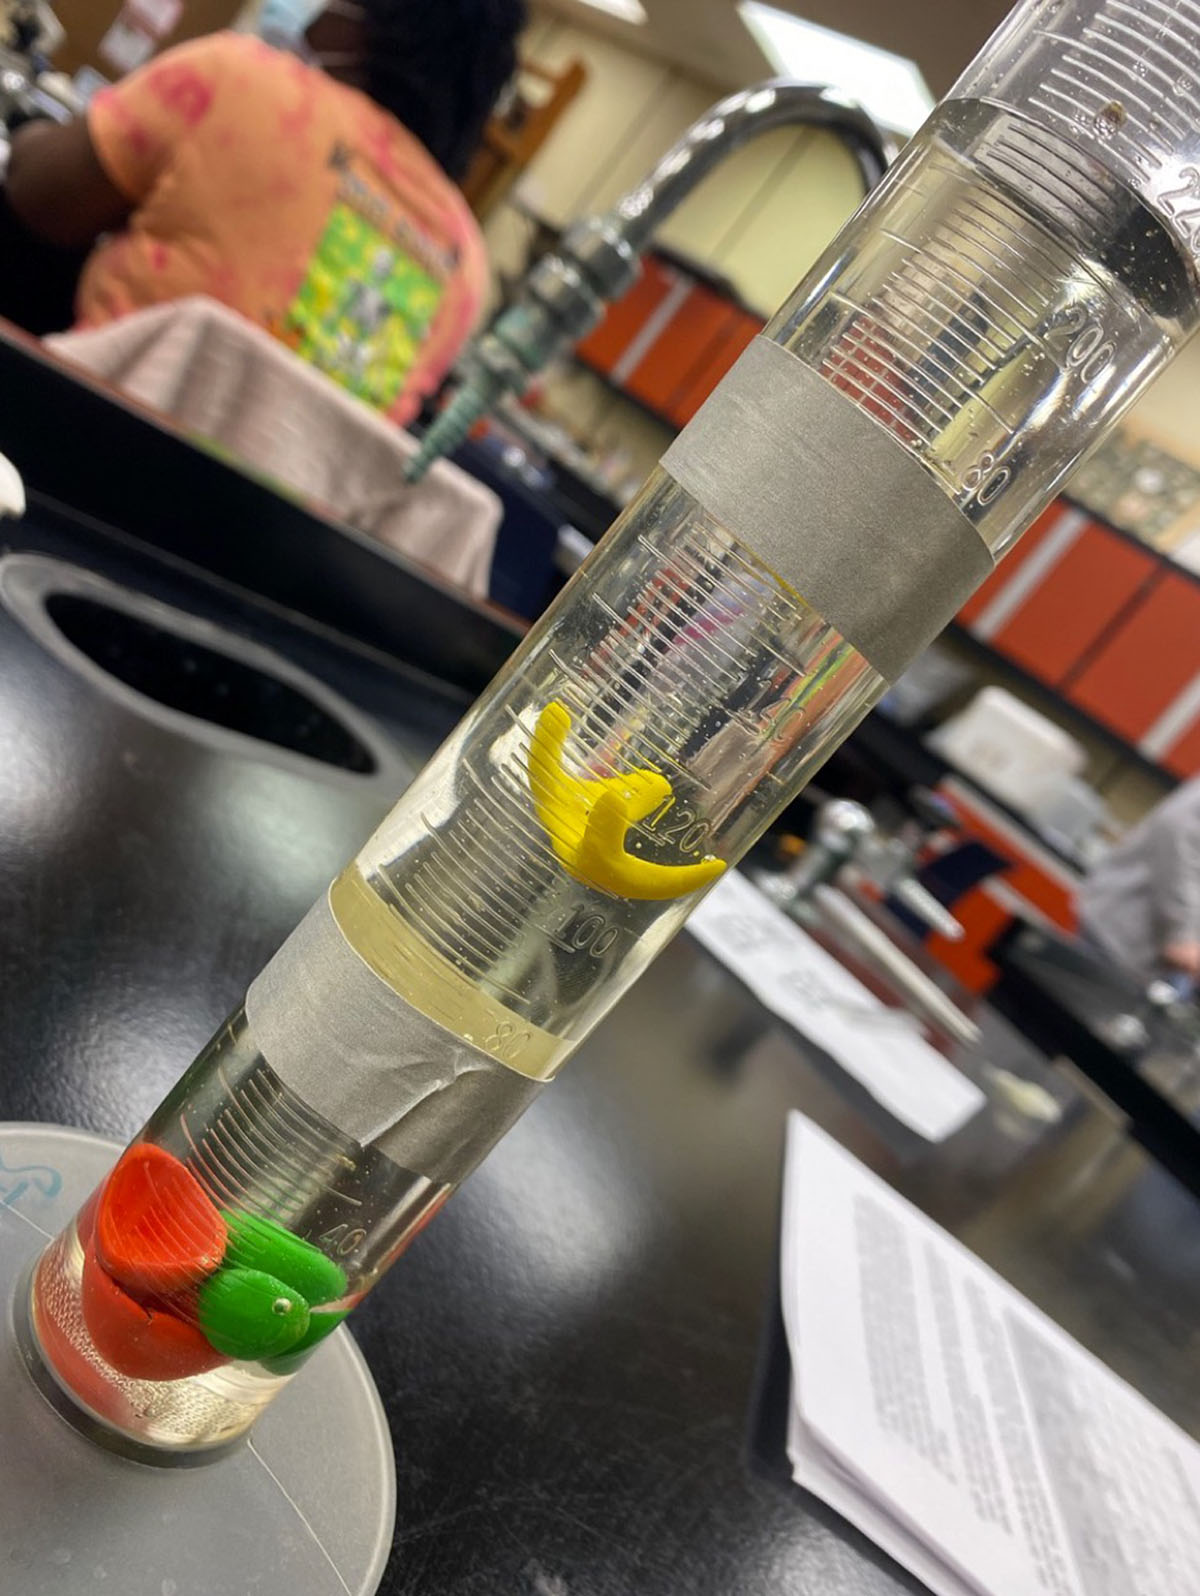
Figure 2
Tape is used to mark off the 100 ml “Photic Zone”, from 80 ml to 180 ml in a 250 graduated cylinder. Corn syrup is added to the 200 ml line, and clay plankton are placed into the syrup, one at a time, and the time it takes to sink through the photic zone is measured. Photo: Lisa Pike. Reproduced with permission of the photographer.
Table 2
Mathematical calculations for surface area of common geometrical shapes.
| SHAPE | SURFACE AREA FORMULA (IN CM2) |
|---|---|
| Sphere | 4 π r2 (where r = radius) |
| Cube | 6 a2 (where a = length of a side) |
| Rectangular cuboid | 2(lb + bh + lh) (where l = length, b = breadth, h = height) |
| Right Pyramid(4 sides + base) | LSA + Area of base (where LSA = lateral surface area = ((side 1 + side 2 + height) × Length) + (base x height) |
| Triangular Prism | LSA + 2B (where LSA = lateral surface area = (side 1 + side 2 + side 3) × Length, and B = base) |
| Cylinder | 2 π r (r + h) (where r = radius, and h = height) |
| Hemisphere | 3 π r2 (where r = radius) |
| Right Circular Cone | π r (l + r) (where r = radius, and l = length) |
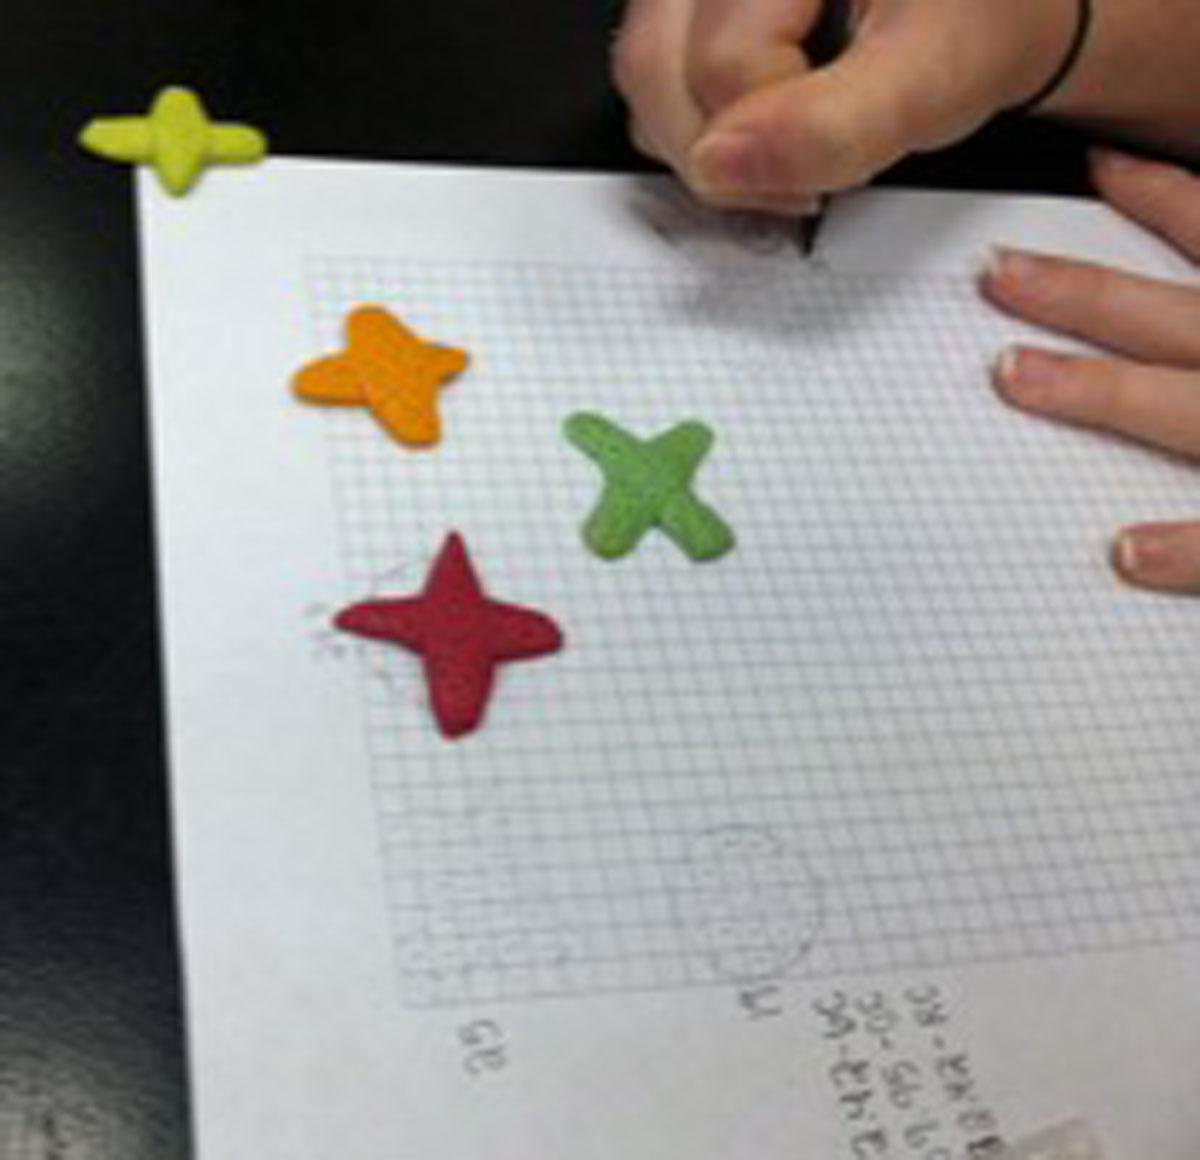
Figure 3
Of the four replicates you make of each shape, one replicate can be squished on graph paper to calculate the number of squares covered, which can represent surface area. Photo: Lisa Pike. Reproduced with permission of the photographer.
Table 3
Time (sec) it takes for plankton to sink 100 ml. The winning plankton is the one that sinks at the slowest rate (with example data).
| SHAPE | ||||
|---|---|---|---|---|
| 1: SPHERE | 2: TRIANGLE | 3: LONG OVAL PILL | 4: BOAT | |
| Surface Area (cm2) | 2.25 | 3 | 3.25 | 4.75 |
| 1 | 72 | 73 | 93 | 149 |
| 2 | 78 | 84 | 84 | 92 |
| 3 | 69 | 79 | 87 | 126 |
| AVG (sec) | 76 sec | 79 sec | 88 sec | 1.22 sec |
| RATE (ml/sec) | 1.32 ml/sec | 1.27 ml/sec | 1.14 ml/sec | 0.79 ml/sec |
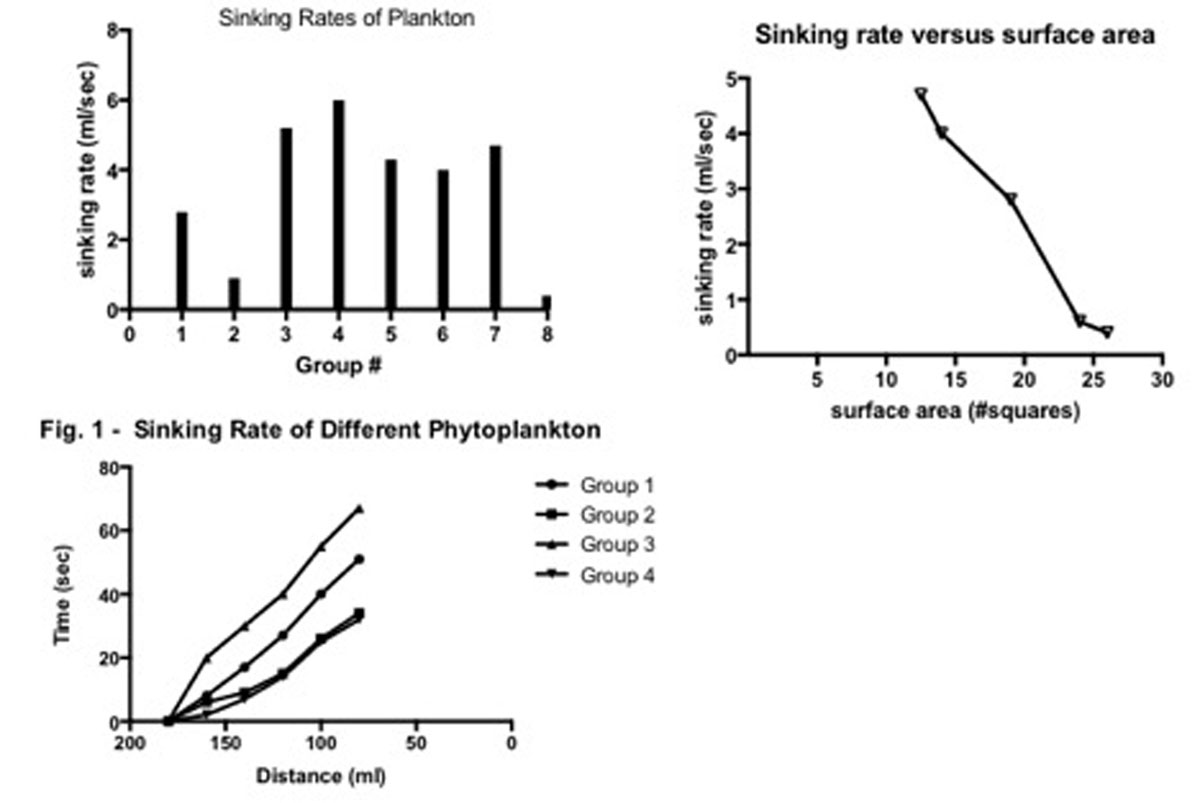
Figure 4
Several examples of ways to graphically display the data. Photo: Lisa Pike. Reproduced with permission of the photographer.
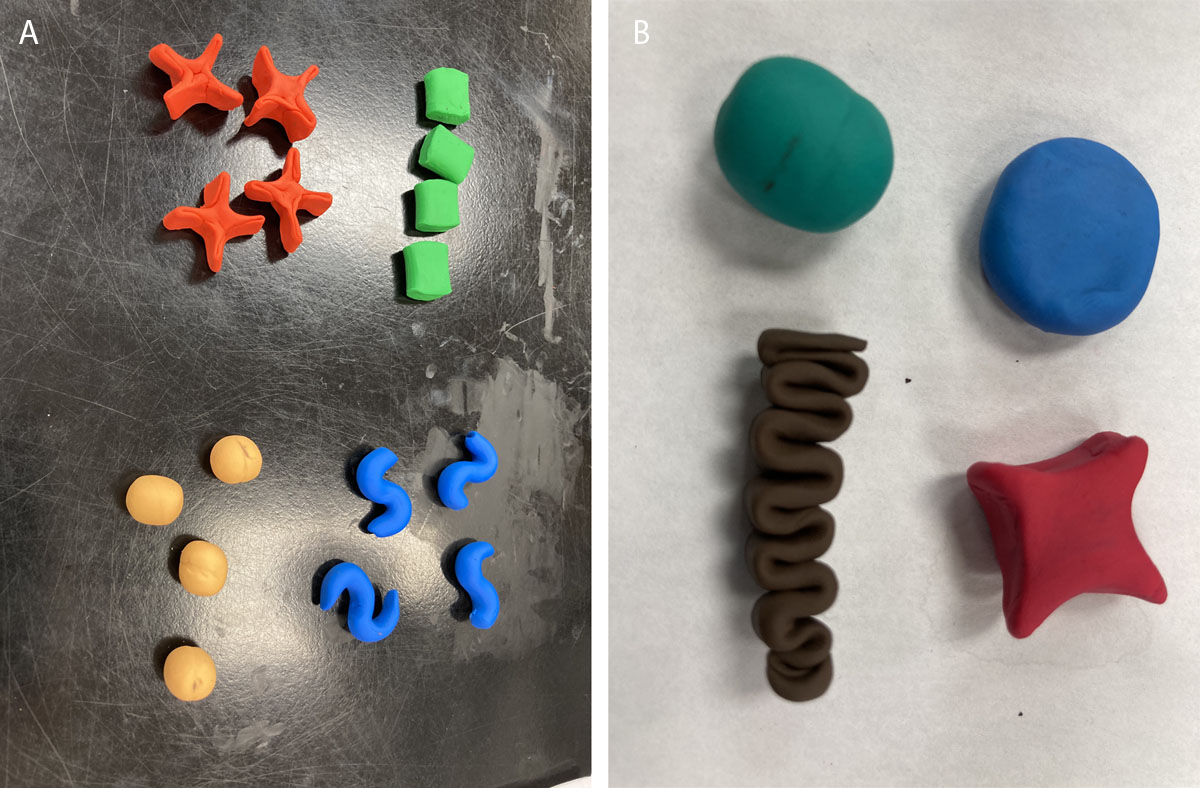
Figure 5
A and B. Examples of plankton shapes students will ‘race’. Photo: Lisa Pike. Reproduced with permission of the photographer.