
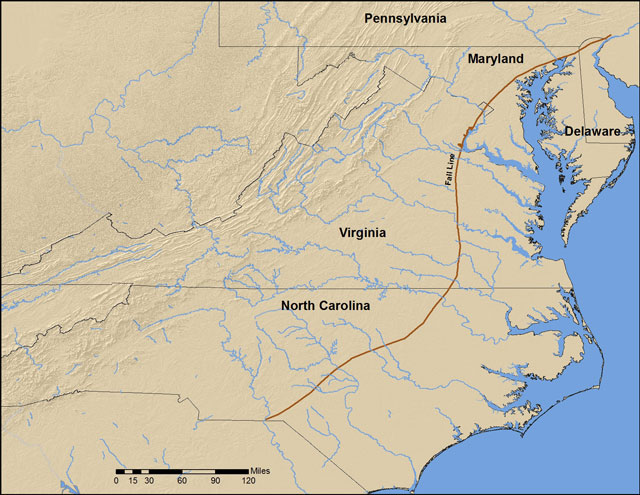
Figure 1
The Middle Atlantic Region. Source: ESRI USA Political Map and Topographic Map.
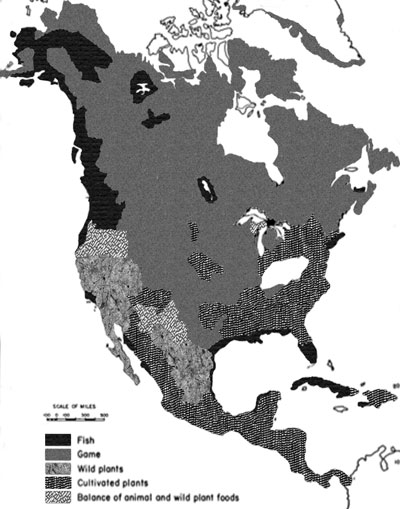
Figure 2
A recreation of one of the qualitative maps from Driver and Massey’s article Comparative Studies of the North American Indian (1957). The map illustrates the geographic extent of subsistence practices of different Native American groups based on ethnographic and archaeological research.
Table 1
Summary of main criteria used to classify thematic maps into different categories and examples of each type of map.
| Subdivision | Criteria | Example |
|---|---|---|
| Cartogram | A map that distorts real-world geographic distances to reflect an attribute or variable. | A map where counties or cities have been resized by scaling area in proportion to a variable such as population or GDP. |
| Choropleth | A map in which areas are shaded or patterned in proportion to the measurement of a statistical variable being displayed on the map. The statistical variable is usually collected in previously defined enumeration units, such as counties or states. | Election maps that use different colors to infill state, county, or legislative district areas based on the percentage of voters for a particular political party. |
| Dot | A map that uses dot symbology. Dots are set equal to a certain number of observations of a phenomenon and dots are placed wherever that phenomenon is known to occur. | See Figure 4a |
| Flow | These maps use lines of varying width to depict the movement of phenomena between geographic locations. | Flow maps are commonly used to show the movement of trade goods between different locations or the number of migrating people and the direction of their movement. |
| Geologic | A map that depicts a bird’s eye view of geological phenomena or a map of a stratigraphic profile. These can also be considered a type of qualitative map. | See Figure 3 |
| Graduated Symbols | A map that scales symbols in proportion to the magnitude of data occurring at point locations. | See Figure 4b |
| Historic | Maps depicting events or places from the past. | John Smith’s Map of Virginia depicts the geographic layout of the area’s major rivers, the Chesapeake Bay, and Virginia Indian towns in 1607. |
| Isarithmic | Maps that depict smooth continuous phenomena and use contour or isolines to identify areas of similar data. | Topographic maps |
| Qualitiative | Maps that use lines or infilling to illustrate the geographic extent of a certain cultural or natural phenomena such as language groups or forested land. | See Figure 2 |
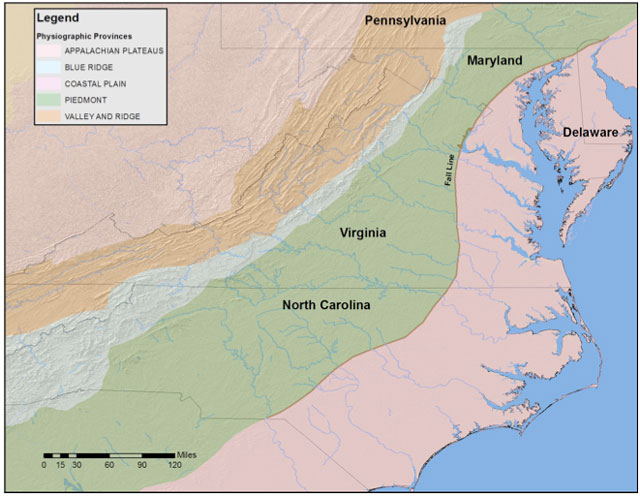
Figure 3
The physiographic provinces of the Middle Atlantic region: Coastal Plain, Piedmont, Blue Ridge Mountains, Ridge and Valley, and the Appalachian Plateau. Source: ESRI Geologic Base Map.
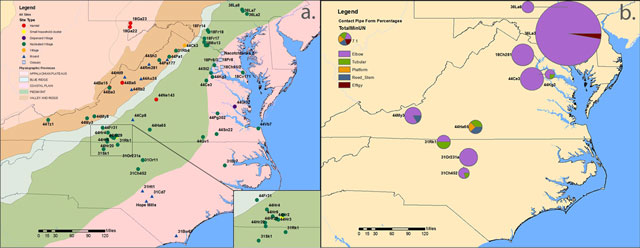
Figure 4
a) Example of a dot map (Bollwerk 2012). Each symbol (dot, triangle, square etc.) represents the approximate location of a single archaeological site. b) Example of a map with graduated symbols (Bollwerk 2012). The size of each pie chart is proportional to the size of an archaeological assemblage. The location of the pie chart represents the approximate geographic location of the archaeological assemblage it represents.
Table 2
The total number of articles and percentage of articles containing maps in each time period.
| Years | Number of Articles | % of Articles with One or More Maps |
|---|---|---|
| 1985–1989 | 45 | 44 |
| 1990–1994 | 46 | 76 |
| 1995–1999 | 55 | 64 |
| 2000–2004 | 54 | 46 |
| 2005–2009 | 61 | 44 |
| 2010–2012 | 49 | 67 |
| Total | 297 |
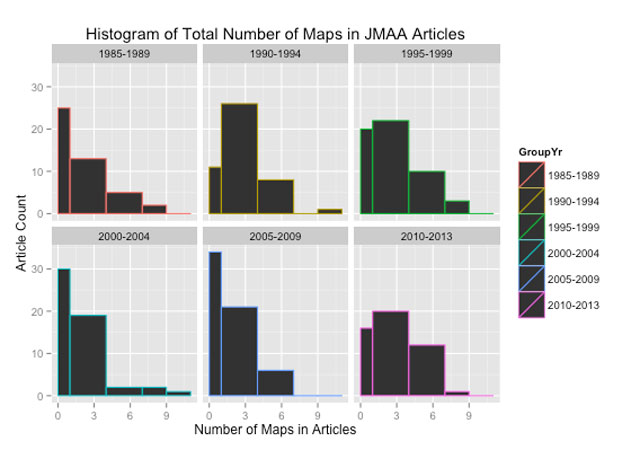
Figure 5
Frequency of maps used in JMAA articles published between 1985–2013, divided into six time periods.
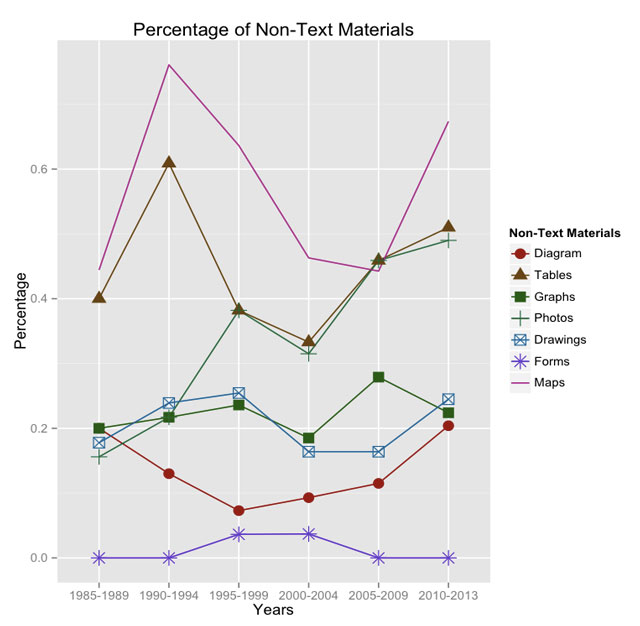
Figure 6
Comparison of non-text materials used in JMAA articles published between 1985 and 2013.
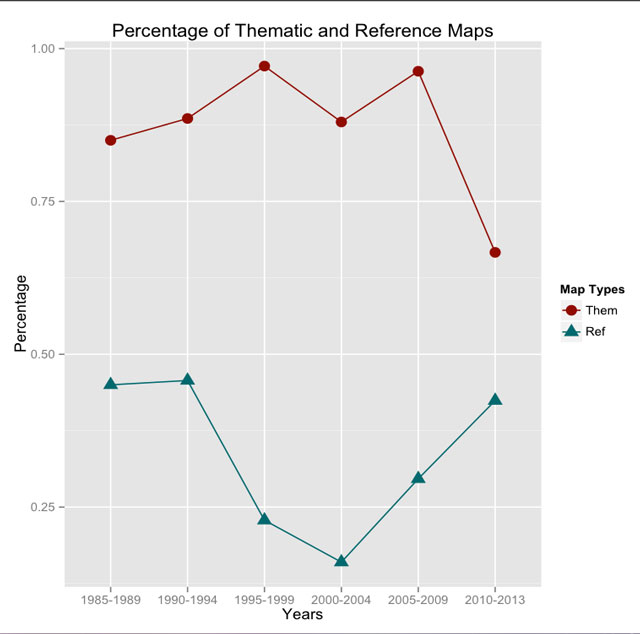
Figure 7
Comparison of referential/locational maps and thematic maps used in JMAA articles published between 1985 and 2013.
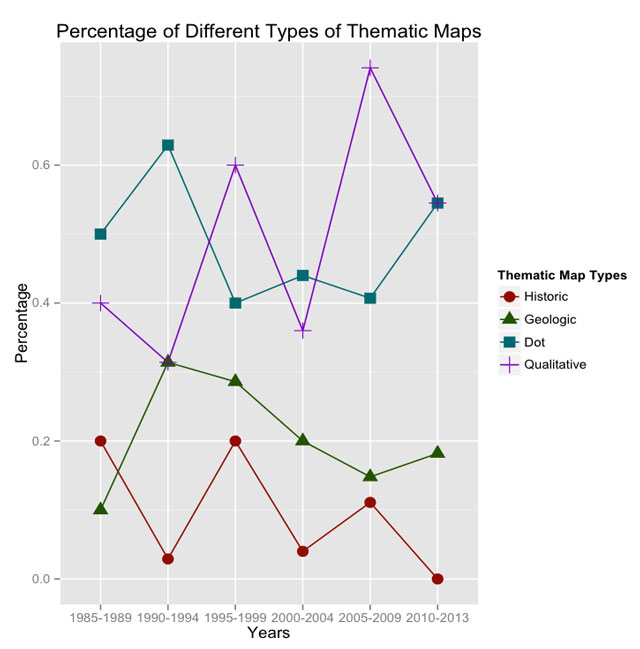
Figure 8
Percentages of historic, geologic, dot, and qualitative maps in the sample of maps from JMAA.
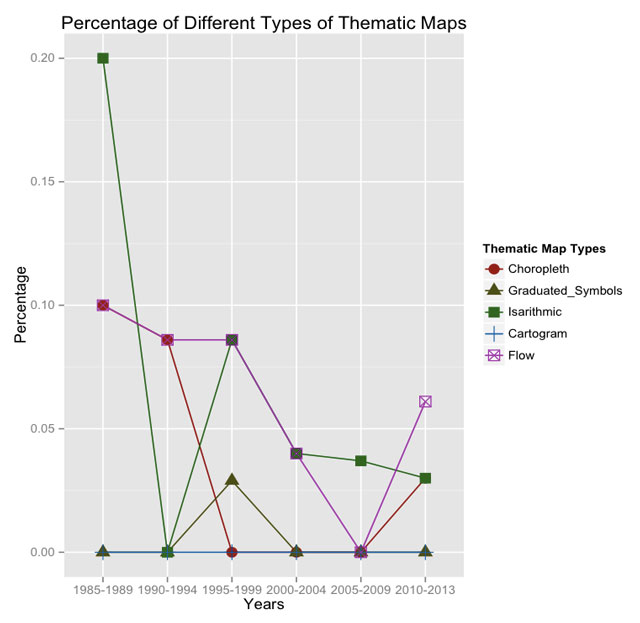
Figure 9
Percentages of choropleth, graduated symbol, isarithmic cartogram, and flow maps in the sample of maps from JMAA. Note the scale for the y-axis is different than Figure 8.
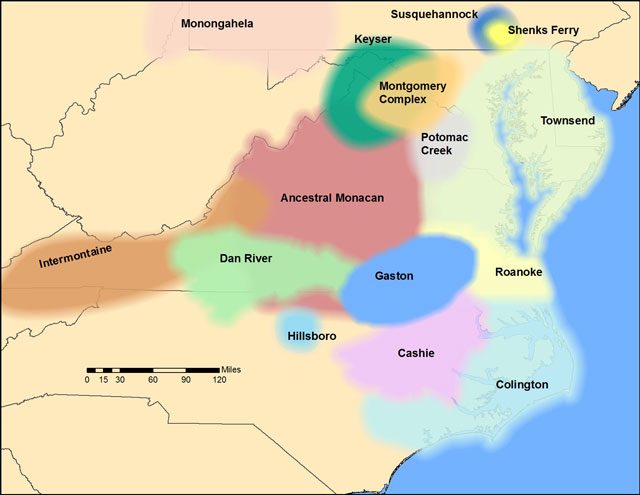
Figure 10
Cultural Complexes of the Middle Atlantic depicted with ‘Fuzzy Boundaries’.