
Table 1
PM10 and PM2.5 limits as defined by the National Environment Protection Measure for Ambient Air Quality (Air NEPM).
| POLLUTANT | THRESHOLD (µg/m3) | AVERAGING PERIOD | ALLOWABLE EXCEEDANCE |
|---|---|---|---|
| PM10 | 50 25 | 24 h 1 year | Exceptional event rule: an exceptional event is a fire or dust occurrence that adversely affects air quality at a particular location; causes an exceedance of one-day average standards in excess of normal historical fluctuations and background levels, and is directly related to bushfire, jurisdiction-authorised hazard-reduction burning or continental-scale windblown dust |
| PM2.5 | 25 8 | 24 h 1 year |
[i] Source: ADEE (2016).
Table 2
Technical data of the sensors used in the monitoring campaign: sensor types, accuracy, resolution and range are reported.
| SENSOR TYPE | ACCURACY | RESOLUTION | RANGE | |
|---|---|---|---|---|
| CO2 | Non-dispersive infrared | ±3% ± 50 ppm | 1 ppm | 400–2000 ppm |
| PM10 | Light-scattering (350 nm) | ±10% (< 30 ± 3 µg/m3) | 1 µg/m3 | 1–100,030 µg/m3 |
| PM2.5 | Light-scattering (350 nm) | ±10% (< 30 ± 3 µg/m3) | 1 µg/m3 | 1–100,030 µg/m3 |
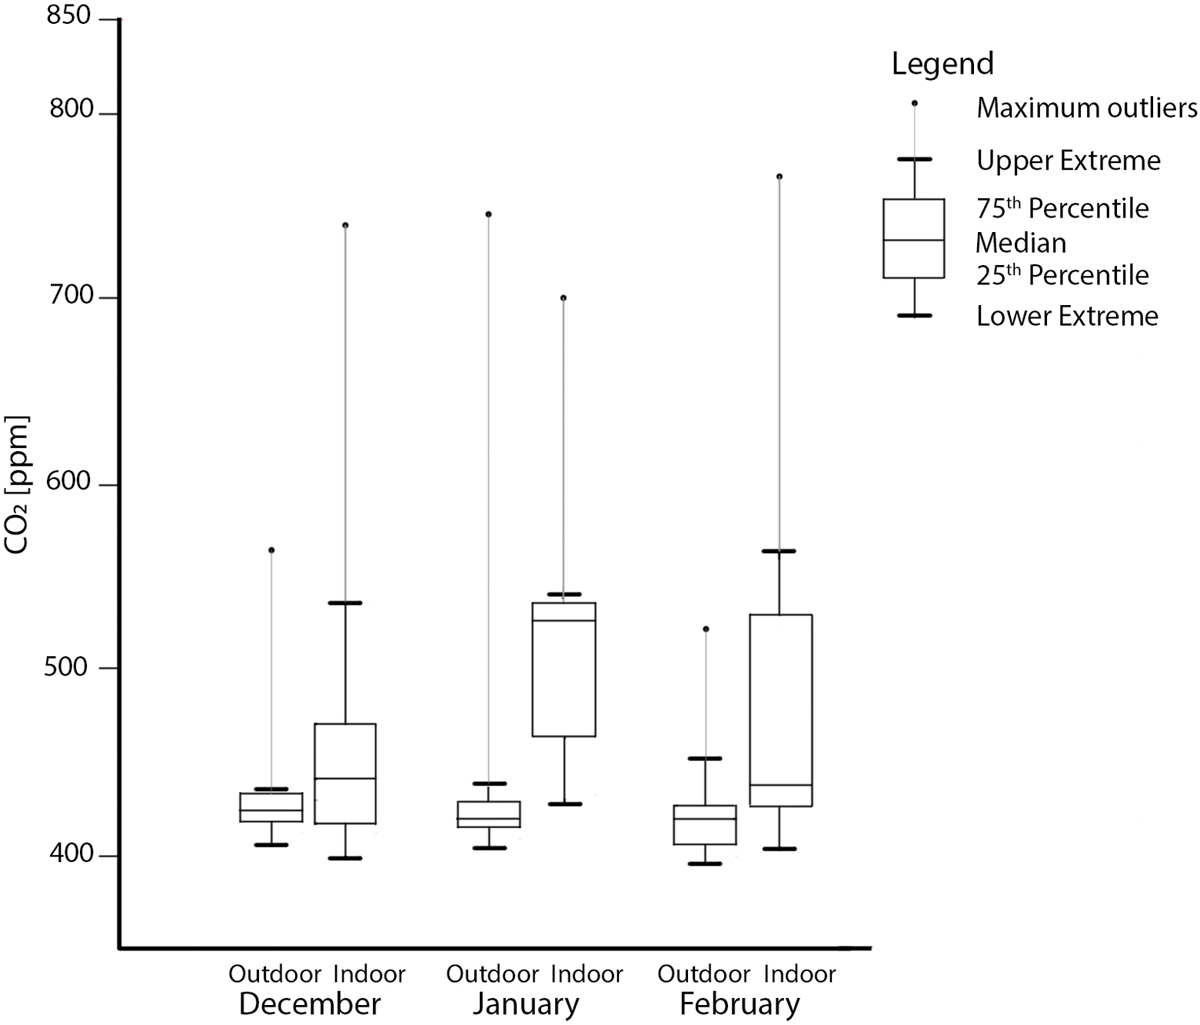
Figure 1
Box plot graph of the monthly indoor and outdoor CO2 concentrations, December 2019–February 2020.
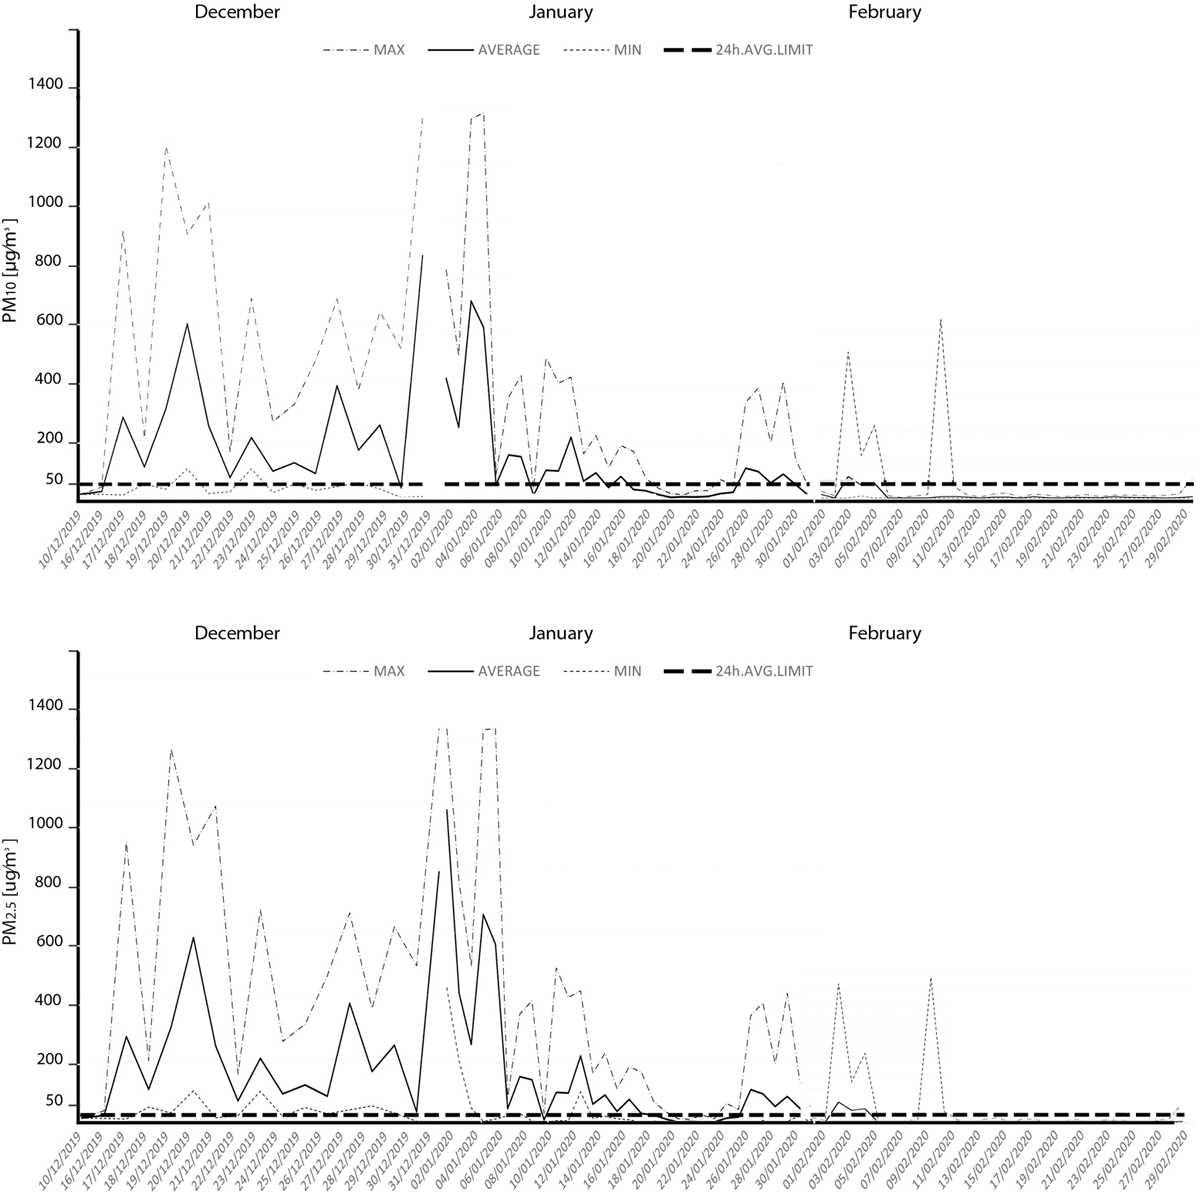
Figure 2
Outdoor PM10 (above) and PM2.5 (below) daily average, maximum and minimum values, December 2019–February 2020.
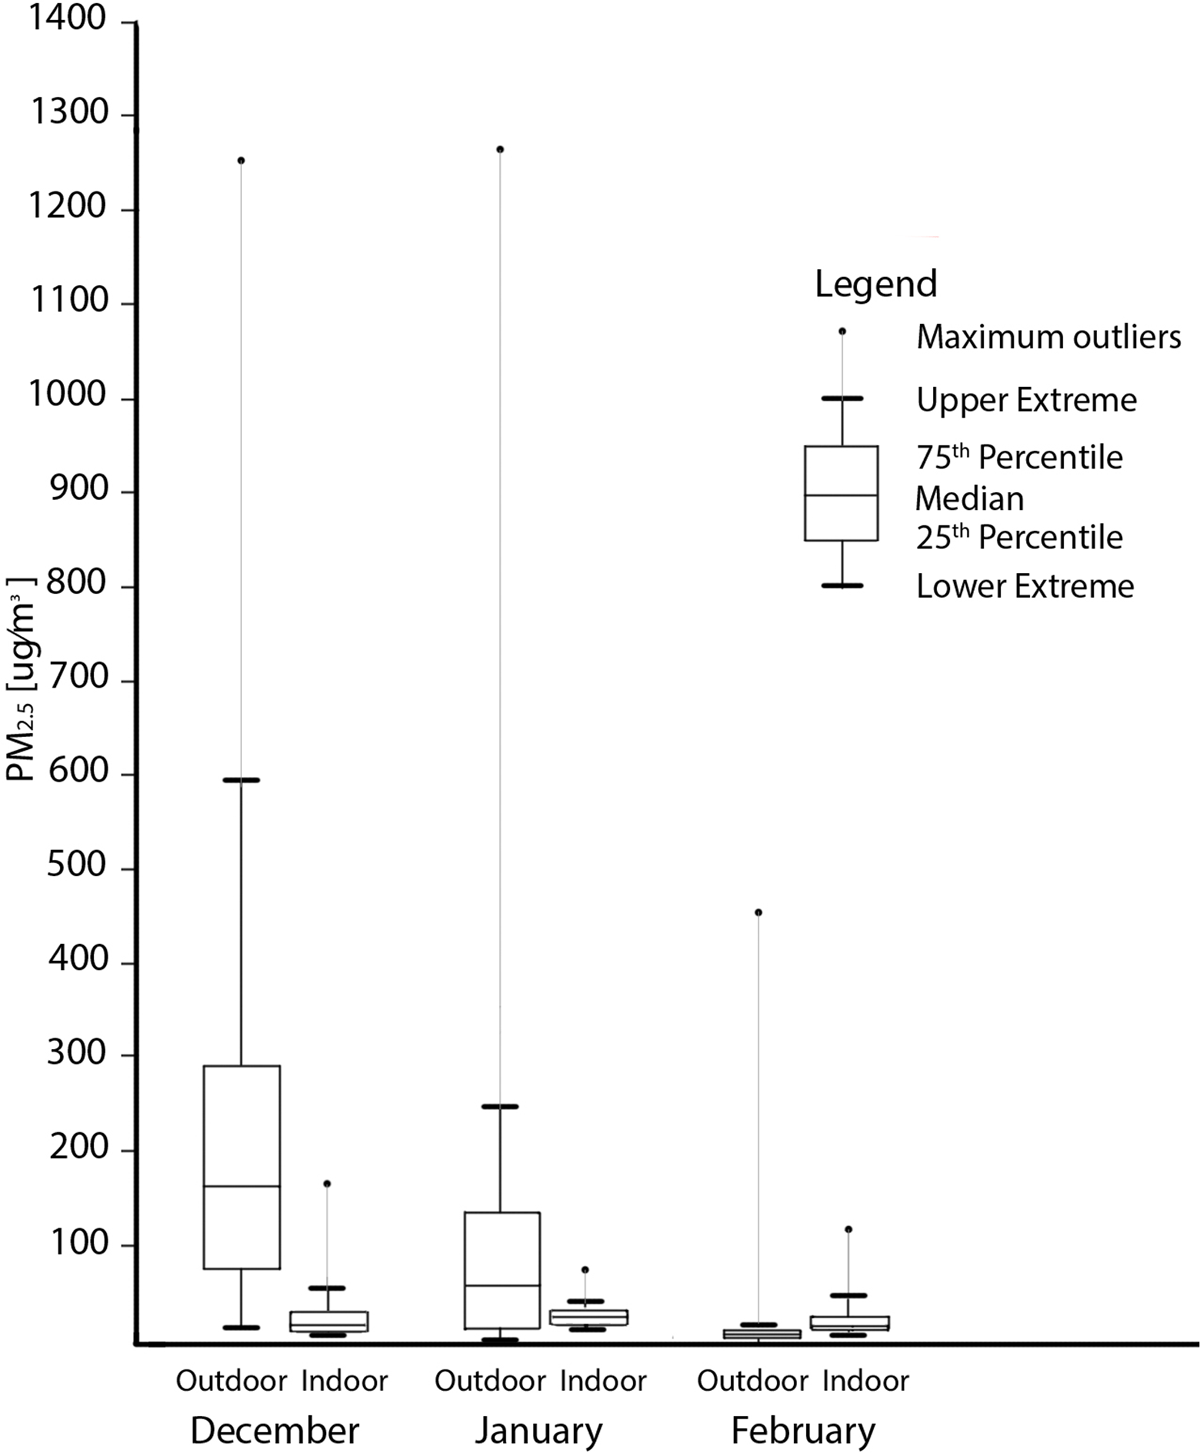
Figure 3
Box plot graph of the monthly outdoor and indoor concentration of PM2.5, December 2019–February 2020.

Figure 4
Indoor and outdoor daily concentration of PM10 and PM2.5, 17–21 December 2019.
Table 3
Multiple regression analyses of the relationship between indoor PM2.5 and outdoor PM2.5 and CO2 data for occupied and unoccupied hours.
| TIME PERIOD | INDEPENDENT VARIABLE | R 2 | B | t | p | STANDARD ERROR |
|---|---|---|---|---|---|---|
| Unoccupied hours | PM2.5 outdoor | 0.23 | 0.62 | 36.97 | 0 | 0.017 |
| CO2 outdoor | 23.07 | 48.13 | 0 | 0.479 | ||
| Occupied hours | PM2.5 outdoor | 0.14 | 0.058 | 34.89 | 0 | 0.002 |
| CO2 outdoor | 0.003 | 12.50 | 0 | 0.000 |