
1. INTRODUCTION
The construction industry remains one of the most resource-intensive sectors, placing considerable pressure on material supply systems and contributing heavily to global waste generation (UNEP 2025). In the European Union, the built environment stands for approximately 35% of annual waste generation, 50% of raw material extraction and 5–12% of the domestic carbon footprint (European Commission 2025). As circular-economy principles gain prominence, extending the lifespan of building products and recovering them at their end of life has become increasingly important. However, the transition to circular construction is hindered by limited access to reliable information on the availability, composition and condition of products embedded in existing buildings (Amarasinghe et al. 2024; Ranasinghe et al. 2024).
Recent disruptions to global supply chains have revealed the vulnerability of construction material flows, underscoring the need for more resilient and regionally grounded resource strategies (UCL 2024). Circular-economy ambitions further reinforce this need, as accurate data on stocks, lifespans and reuse potential of building components are essential (Gonçalves et al. 2025). Yet current assessment practices often rely on fragmented or inconsistent indicators, prompting calls for more harmonised and comprehensive measurement approaches. In response, key performance indicators (KPIs) have emerged as a structured means of translating circular economy objectives into measurable outcomes and supporting evidence-based decision-making (Aljaber et al. 2024). By quantifying material availability, resource circulation, recovery potential, reuse rates and value retention, KPIs enable the systematic assessment of circularity performance and the identification of opportunities for design for reuse, urban mining and circular construction (European Commission 2023; Mani et al. 2026).
Parallel developments in urban mining have introduced various methods for identifying and quantifying reusable building products. Bottom-up approaches applied to residential building stocks demonstrated how components such as windows can be systematically identified and incorporated into circular resource planning (Arora et al. 2020). Although these methods provide detailed stock information to support product flow assessments (Devos et al. 2025), they remain time-consuming and data-intensive (Nasir et al. 2021). Studies of building and demolition permits in France showed that material demand from new construction far exceeds the resources released through demolition (Simba & Lemelin 2024), while on-site scouting for reusable products remains inefficient due to its labour-intensive nature and low success rates (Takser et al. 2025). To address these challenges, researchers recommend standardised reporting, accessible demolition registers (Takser et al. 2025) and frameworks that enable progressively refined assessments as more information becomes available (Lambec & Fivet 2025). Studying buildings approaching demolition is a logical starting point for product-level reuse because they represent the segment of the building stock that will soon release materials and products, making them the primary source of products available for reuse. Since establishing product availability is a prerequisite for subsequent steps, such as quality assurance, demolition-bound buildings provide the most immediate basis for reuse planning.
Alongside these developments, material intensity coefficients approaches are widely used to estimate material stocks and effectively quantify general material categories such as concrete, steel, timber and brick (Fishman et al. 2024; Heeren & Fishman 2019). However, they provide limited information on the quantity, condition and reuse potential of specific building products. As circular construction requires product-level information, complementary approaches are needed to identify and quantify reusable building products. The KPI framework developed in this study complements material intensity approaches by enabling product-specific assessments at the stock level and providing a basis for evaluating circularity dimensions such as accessibility, recoverability and reusability. Together, these approaches offer a more comprehensive understanding of building stocks and their circular potential.
Understanding reuse potential across building types is essential in this context. A study of Flemish social housing indicates that building products and reuse potential varies with both building type and construction method (Devos et al. 2025). Expectations for recoverable components differ across typologies, with finishing materials—such as tiles and bricks—showing notable reuse. Also in Denmark, researchers found that reuse rates vary by region and building type, with detached houses and commercial buildings showing the greatest reuse potential and calling for more detailed studies on building typologies and local strategies (Hoxha & Birgisdottir 2025). These findings align with evidence from Swedish construction practices. Berggren & Wall (2019), for example, show that the exterior wall and facade in Swedish residential buildings vary considerably across the country, with pronounced regional differences in materials such as wood, brick and concrete (Berggren & Wall 2019). This variability underscores the importance of considering local construction traditions when estimating reusable product stocks.
Local climate conditions also influence building form and material selection, shaping the distribution of reusable components. They affect choices such as window design and configuration (Alsehail & Almhafdy 2020; D’amato & Kapoor 2024). Together with regional construction traditions, these factors underscore the need to contextualise product-level stock assessments.
Municipal planning practices influence building design, particularly for public buildings such as preschools, affecting the distribution of embedded products (Ekman Ladru & Gustafson 2025). Likewise, Mårtensson & Nordström (2017) emphasise that Nordic municipalities differ significantly in their building regulations, planning strategies and the provision of child-friendly environments. These variations suggest that municipal planning practices can directly influence the quantity, type and characteristics of building products present in public facilities, reinforcing the need to account for local governance when analysing potential urban mined product stocks.
Pre-demolition audits are a key mechanism for improving information on building products prior to demolition (Fasanmi & Ferriz-Papi 2025). They support the structured documentation of material contents, the identification of hazardous substances and the facilitation of high-value reuse (European Commission 2018). However, they remain unstandardised (Fasanmi & Ferriz-Papi 2025), and reported quantities often diverge from actual observations (Cha et al. 2017). Demolition permits similarly suffer from unstructured, incomplete or inconsistent product data, limiting their reliability for circular-economy planning (Ericsson et al. 2026; Wu et al. 2022). Regulatory requirements can also affect the timing and feasibility of urban-mining activities, as shown in Singapore (Arora et al. 2021), while incomplete audit documentation in France further complicates feasibility assessments and restricts reuse options (Nicolas & Sébastien 2026). To address these issues, Nicolas & Sébastien (2026) argue that the critical policy focus should be on the specific information fields that reduce uncertainty. They recommend incorporating reuse-oriented fields with minimum quality standards, supported by aligned national protocols for consistent sampling and testing.
Together, existing research demonstrates both the advantages and the constraints of using demolition permit documentation and pre-demolition audits as sources for product-level stock assessment. At the same time, the expanding methodological landscape—encompassing KPI development, urban mining frameworks, stock estimation approaches, and insights into regional construction traditions and planning practices—provides a strong foundation for advancing product-level reuse strategies. Against this backdrop, the present study builds on previous work by testing, refining and extending a KPI-based approach for estimating product availability from demolition permit data. Importantly, the proposed KPIs should be regarded as a proof of concept rather than as definitive estimates of product quantities. Their primary purpose is to demonstrate the feasibility of deriving indicative assessments of product availability from demolition permit documentation and to support methodological development in this area. In doing so, the study contributes to the continued development of robust and transferable methods for quantifying reusable building products.
This article employs three key terms: product, material and material fraction. A product denotes a permanent building component composed of one or more materials. A material refers to a single substance, whether used in its raw form or as part of a composite. Material fractions, a term commonly used in waste-management contexts, describe categorised waste streams.
1.1 AIM, RESEARCH QUESTIONS AND HYPOTHESIS
Building on Ericsson et al. (2026), who derived KPIs from demolition permits in 13 municipalities in Greater Gothenburg, this study applies the same method to two additional municipalities in other regions to assess the consistency of regional KPIs. The aim is to determine whether KPIs for specific products within a given building type can be generalised across regions and if national KPIs are feasible. To achieve this, empirical data from the municipalities of Umeå and Stockholm were compiled, and product quantities were estimated and compared with those from Greater Gothenburg, after which the KPIs were calculated.
The hypothesis is that KPIs derived in one region are transferable to others, indicating no significant regional differences and supporting the use of national KPIs. This is examined through the following research question: Are there regional differences between KPIs for various building types, and for which building products are these differences most pronounced?
2. METHODS, DATA AND ANALYSIS
The study followed the bottom-up method described by Ericsson et al. (2026). Data collection was combined with desktop analysis, following the workflow shown in Figure 1. In this study, the method was used to collect and analyse information from three regions—Umeå, Stockholm and Greater Gothenburg—to enable statistical evaluation of regional differences. Products quantities from demolished buildings were estimated using the information available in demolition permits and associated documentation. KPIs were introduced to represent the average quantity of a specific product within a defined building type. Their purpose is to provide indicative estimates of product quantities at both the building level and across a wider building stock, based solely on building footprint area (BFA). These KPIs are not intended to provide exact quantities but to offer approximate, scalable indicators.
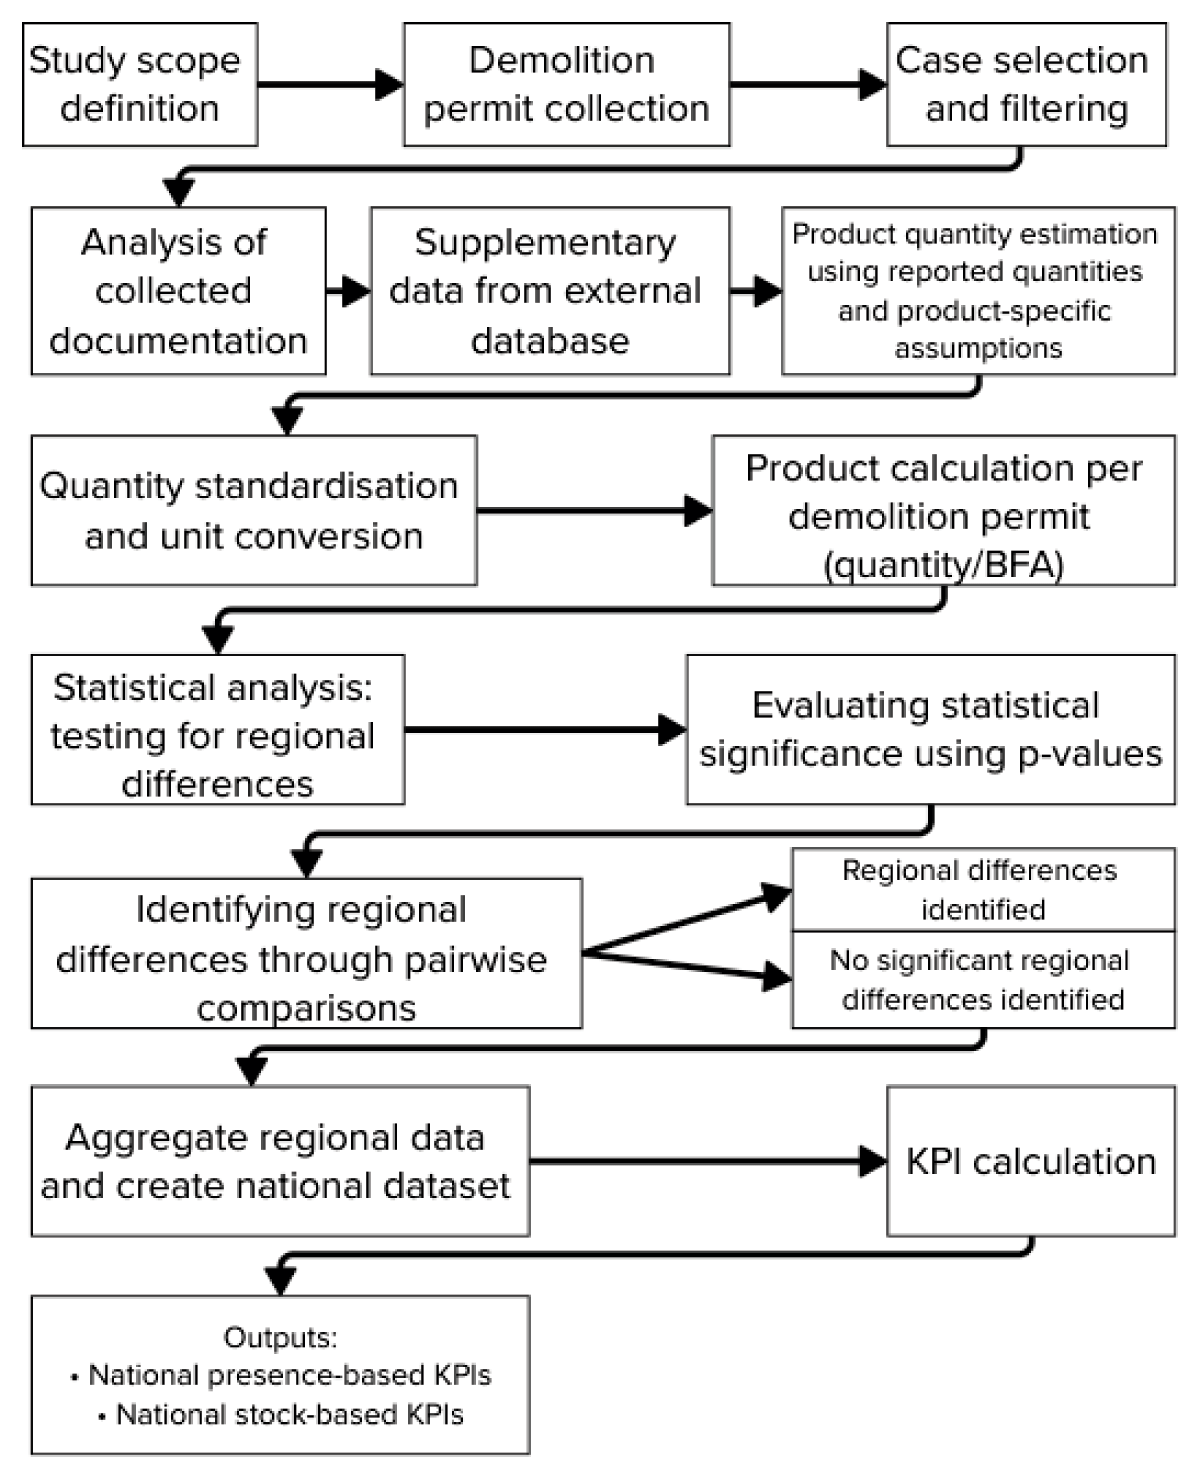
Figure 1
Overview of the methodological workflow.
2.1 METHODOLOGICAL FRAMEWORK
The methodological framework for quantifying the potential availability of building products for reuse following demolition was first developed by Ericsson et al. (2026). The framework basically consists of four steps: compilation of data on the buildings to be demolished; curation of data by transforming them to same format and completing missing data; estimating product quantities; and calculating the KPIs.
Consistent with Ericsson et al. (2026), the analysis focuses on six predefined product categories: windows, radiators, facade products, roofing products, structural frameworks and gypsum boards. Each category is subdivided into more specific product types to enable a more detailed assessment. The categories were selected to represent products with different functions, locations, characteristics and measurement units, capturing a broad range of attributes. These products should be regarded as illustrative examples rather than those with the highest reuse potential. The aim was to test and demonstrate the proposed methodology across a diverse set of products. Although the methodology could be applied to any product, the study was limited to six categories to ensure a feasible yet robust analysis within the available time and resource constraints.
2.1.1 Data compilation
To compile the data, each municipality was requested to provide lists of demolition permits from a defined time period. The municipalities supplied permit lists containing, to varying degrees, information such as case number, case description, property designation, start and end dates, case classification (notification or permit), permit category (construction or demolition), project type (new construction, renovation, extension or demolition) and building type. Following the identification of relevant cases, all available documentation for these demolition permits was requested from the municipalities.
Each permit and its associated documents were systematically reviewed to collect the information required for deriving product quantities. Data were obtained either as explicitly reported quantities for the six targeted product categories or, where such data were unavailable, as desktop estimates derived from the demolition documentation.
Permit documentation typically included applications, site plans, drawings, photographs, pre-demolition audits, waste plans and reported waste quantities. These were provided in a mixture of editable formats (e.g. PDFs and Word files) and scanned or handwritten materials, requiring careful interpretation and extraction of information.
Where documentation included measurements such as BFA, height and roof pitch, these values were used directly to inform the desktop estimations. When such information was missing or incomplete, it was approximated using available drawings, photographs or other visual records; no site visits were conducted. The four key variables—BFA, building height, external perimeter and roof pitch—were required to estimate product quantities and to calculate KPIs standardised by BFA.
2.1.2 Data curation and completion
In case data from the demolition permits were lacking or incomplete, other data sources were used, or assumptions were made to complement the information.
Supplementary data
Additional information, including heated floor area and construction year, was sourced from a private database on the Swedish building stock, developed by Johansson et al. (2017). This database compiles property-level records from the national property register and links them to data from energy performance certificates.
Product-specific assumptions
When available documentation lacked explicit information on specific product characteristics, several product-specific assumptions were required. These assumptions, primarily based on literature references, enabled desktop estimations of product quantities by supporting the conversion of recorded quantities into the units defined for each product category, as summarised in Appendix A in the supplemental data online.
In this study, only external windows and the outermost layers of the facade and roofing products were included in the estimations. Furthermore, when no information on roof pitch was available, the roof was assumed to be flat, which underestimates the actual roof area compared with a pitched roof.
Facade product quantities were estimated by calculating the facade area from drawings, using the building’s perimeter and height, and subtracting 10% of the heated floor area to account for window openings, in line with former Swedish authority recommendations (Boverket 2014). If heated floor area was unavailable, BFA was used instead. For buildings with multiple facade products, the window area was subtracted from the area of the dominant facade product.
The number of heating radiators was assumed to correspond to the number of external windows, aligning with common Swedish construction practice and installation guidelines (ADAX 2026). This simplified assumption also supports methodological consistency, as heated area and heating demand are typically not available in demolition permit documentation, whereas drawings and photographs are more commonly provided.
Framework estimations considered both interior and exterior walls, as well as ground, intermediate and attic floors, but excluded slabs and foundations. The ground floor structure was defined as the floor construction between a cellar or basement and the ground floor above, or as the ground floor above a crawl space. Only vertical studs were counted in walls; when dimensions were not specified, studs were assumed to be 45 × 95 mm at 500-mm spacing. Floor joists were included in one direction only and were assumed to measure 45 × 220 mm at 600 mm spacing for ground and intermediate floors, and 45 × 200 mm at 1200 mm spacing for attic floors. Additional framing at wall junctions and around openings such as windows and doors was not included.
Interior wall lengths—together with building height, required for framework and gypsum board calculations—were obtained from scaled floor plans. When unavailable, these were estimated visually and scaled using external building dimensions. No estimation was made without adequate visual evidence. Gypsum boards were assumed to be present in a single layer on both interior and exterior walls, as well as on subfloors and ceilings.
While these assumptions inevitably introduce simplifications and cannot fully capture the variability present in real buildings, they enabled consistent, scalable and comparable estimations across a diverse building stock. They were therefore necessary to standardise units and to support the desktop-based estimation process. Overall, this approach underpinned the development and application of the KPIs and enhances the methodological transferability of the study.
2.1.3 Estimation of product quantities
Possible reusable quantities for the six product categories were estimated using the documentation provided for each demolition permit. Since the available documentation often lacked explicit details, these estimations relied heavily on the assumptions previously described, together with methodological decisions on how best to interpret and use the information provided. Pre-demolition audits typically described construction methods and product types, while drawings served as the primary basis for quantity estimations. Photographs offered additional evidence and were frequently used to verify or refine interpretations of written documentation, particularly when visual information contradicted other sources.
When quantities for specific products were stated, e.g. in pre-demolition audits, waste plans or reported waste quantities, they were not directly transferred into the dataset. Instead, such information served as reference points when performing the desktop estimations. For instance, if a pre-demolition audit specified the number of wooden windows, this information was considered during the estimation based on drawings and photographs.
If the presence of one of the analysed product categories could not be confirmed, the quantity was recorded as zero. In cases where a product was mentioned in the text but no supporting material for quantification was available, no numerical estimate was assigned; however, the noted presence contributed to the assessment of product occurrence frequency within each building type and therefore influenced the KPI calculations. When two alternative products were reported for the same application without specifying their proportions, an equal distribution was assumed. For example, if documentation stated that interior walls were constructed using ‘either gypsum or chipboard’, it was assumed that 50% of the walls consisted of gypsum.
Following quantity estimation, product quantities were divided by the associated building’s BFA to obtain product quantities per m2 of BFA. These normalised values formed the basis for all subsequent analyses, regional comparisons and KPI calculations.
2.2 DATA USED FOR APPLYING THE METHODOLOGY
2.2.1 Building typologies in focus
The methodological approach was applied on a dataset consisting of demolition permits from three regions in Sweden. A subset of data on preschools and multifamily buildings was chosen, since the same building types were retained in the preceding study (Ericsson et al. 2026). This would ensure analytical consistency, comparability and relevance, enabling a meaningful reassessment and adjustment of the KPIs. Preschools were selected due to their relative uniform construction, material composition and size, which supports the development of KPIs that express average product occurrence per unit of BFA. Moreover, demolition of preschools in Sweden is expected to increase due to demographical changes (SKR 2024).
Multifamily buildings were included to test the method’s applicability beyond a single building type. They are both prevalent and comparatively consistent in design (Berggren & Wall 2019), representing a substantial share of the Swedish building stock.
2.2.2 Collection and screening of demolition permits
The municipalities provided lists of recent preschool and multifamily demolition permits, which were screened to remove partial demolitions or renovation activities, as such cases may also be processed under demolition permits.
In total, 38 demolition permits with start dates between 2017 and 2025 were collected, comprising 20 preschools and 18 multifamily buildings. The sample included eight preschools and 11 multifamily buildings from Umeå, and 12 preschools and six multifamily buildings from Stockholm.
Of the 38 demolition permits, 73% concerned executed demolitions, while the remaining permits related to ongoing cases in autumn 2025. Furthermore, 76% of the cases included a pre-demolition audit, 38% included a waste plan (of which 27% specified product- and material-level quantities) and 57% contained reported waste quantities.
The demolition permits collected from Umeå and Stockholm were added to those previously collected and described by Ericsson et al. (2026), which comprised 39 preschools and 18 multifamily buildings.
2.3 ANALYSIS OF THE RESULTS
2.3.1 Calculation of KPIs
Two complementary KPIs, presence- and stock-based, were calculated to represent the average quantity of a specific product within a defined building type (b). The KPIs are intended to provide indicative estimates of product quantities at both the individual building level and across a wider building stock, based solely on BFA. They are therefore designed as scalable estimation tools rather than measures of exact product quantities.
The presence-based KPI represents the average quantity of a product in buildings of a specific type where the product was observed. Consequently, only demolition permits associated with building type b in which product p was identified were included in the calculation. For each product p and building type b combination, the presence-based KPI was calculated using equation (1) as the sum of product quantities per unit of BFA divided by the number of demolition permits in which the product occurred. This KPI therefore answers the question: How much of a given product is typically present in a building of a specific type when that product is present?
where KPIpresence,p,b is the presence-based KPI for product p within building type b; Qp,d is the estimated quantity of product p in demolition permit d; Ad is the BFA of the building in demolition permit d; and np,b is the number of demolition permits of building type b in which product p was identified.
The stock-based KPI represents the average quantity of a product across the entire stock of buildings belonging to a given building type, including buildings where the product is absent. The stock-based KPI is therefore more suitable for estimating aggregate product availability at larger spatial scales. It was calculated by multiplying the presence-based KPI by the product occurrence rate (Pp,b), defined as the proportion of demolition permits within building type b in which product p was identified. By accounting for both the quantity of a product when present and the frequency with which it occurs, the stock-based KPI provides an estimate of the average quantity of that product across all buildings of the specified type.
where KPIstock,p,b is the stock-based KPI for product p within building type b; PIpresence,p,b is the presence-based KPI for product p within building type b; and Pp,b is the occurrence rate of product p within building type b, calculated as:
where np,b is the number of demolition permits of building type b in which product p was identified; and Nb is the total number of demolition permits of building type b.
To investigate whether KPIs derived in one region can be applied to others, and to assess whether significant differences exist between analysed Swedish regions, product quantities estimated for Greater Gothenburg were compared with those from two additional municipalities: Umeå, the most populous city in northern Sweden, and Stockholm, the largest city in Sweden. These regions provide a geographically diverse basis for evaluating the transferability of KPIs across the Swedish context, though all are urban; conditions in sparsely populated rural areas may therefore differ.
2.3.2 Statistical analysis and aggregation of KPIs
A statistical analysis was conducted to evaluate whether mean product quantities per BFA differed between regions. Identifying regional differences is important because significant variation could affect the representativeness of aggregated national KPIs.
For each product and building-type combination, mean product quantities per BFA were compared across regions using a one-way analysis of variance (ANOVA). ANOVA is a statistical method that evaluates whether differences among the means of three or more groups are larger than would be expected from random variation alone (Blanca et al. 2018). In this study, region was treated as the independent variable and product quantity as the dependent variable. Despite the limited sample sizes, ANOVA was considered appropriate because it is generally robust to moderate deviations from normality and variance heterogeneity (Blanca et al. 2018; Schmider et al. 2010), while independence was ensured by study design.
ANOVA produces an F-statistic and an associated p-value (Blanca et al. 2018). The p-value represents the probability of observing differences at least as those found in the data if no true regional differences exist. A significance level of α = 0.05 was used; therefore, p-values below this were interpreted as evidence of statistically significant regional variation.
When ANOVA indicated significant differences, post-hoc tests were applied to determine which regions differed. The Games–Howell test was used when variances were unequal, and the Tukey–Kramer test when variances were similar. Both tests are suitable for unequal sample sizes. If only two regions had more than one observation, a Student’s t-test was performed, using either equal- or unequal-variance assumptions as appropriate.
For products for which no statistically significant regional differences were identified, the regional datasets were combined into a national dataset comprising observations from all three regions. From this combined dataset, presence- and stock-based KPIs were calculated for each product type p and building type b.
3. RESULTS
The results section is divided into three subsections. The first presents a visual analysis and comparison of regional product quantities for preschools and multifamily buildings. These results, focusing on windows, heating radiators, facade, roofing, frameworks and gypsum boards, form the basis for estimating the availability of products and for the subsequent establishment of the KPIs. Alongside the quantities estimated for Umeå, Stockholm and Greater Gothenburg, an aggregated dataset comprising all three regions is also presented. The second subsection reports the findings of the statistical analysis of regional differences in the selected products. The third subsection presents national KPIs derived from the aggregated dataset for products for which no statistically significant regional differences were identified.
3.1 ANALYSIS AND COMPARISON OF REGIONAL DIFFERENCES
This section presents the visual analysis of product-quantity-per-BFA distributions across regions using box plots. Medians and the number of observations for each product, region and building type are provided in Appendix B in the supplemental data online, together with all box plots. In the main text, box plots are shown only for windows as an illustrative example. Note that neither the box plots nor the tables represent KPIs but rather provide the basis for their development.
The box plot analysis of the available data for windows showed that preschool medians were tightly clustered around 0.09 for both the wood and undefined categories, with minimal regional variation (Figure 2). For multifamily buildings, the analysis showed generally higher medians (Figure 3). In the aggregated dataset, the median for the wood category reached 0.18, approximately twice that observed for preschools. Similar box plots for all analysed products are presented in Appendix B in the supplemental data online. Products with only one or two observations are insufficient for reliable distributional or regional inference.
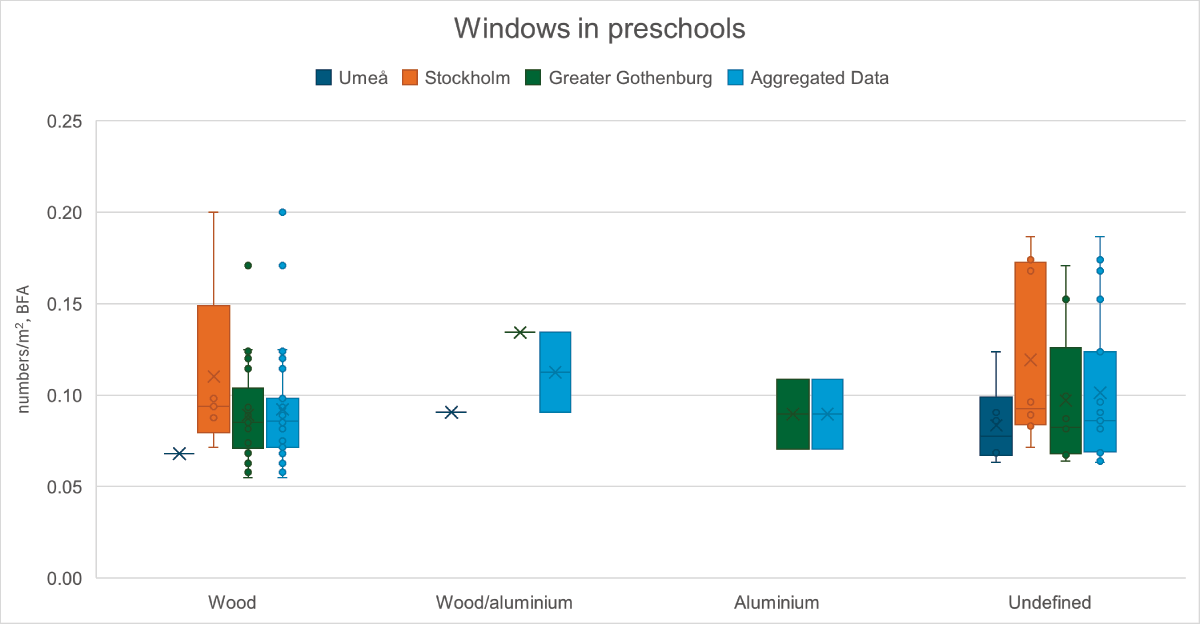
Figure 2
Distribution of product quantities per building footprint area (BFA) for windows in preschools in the three regions.
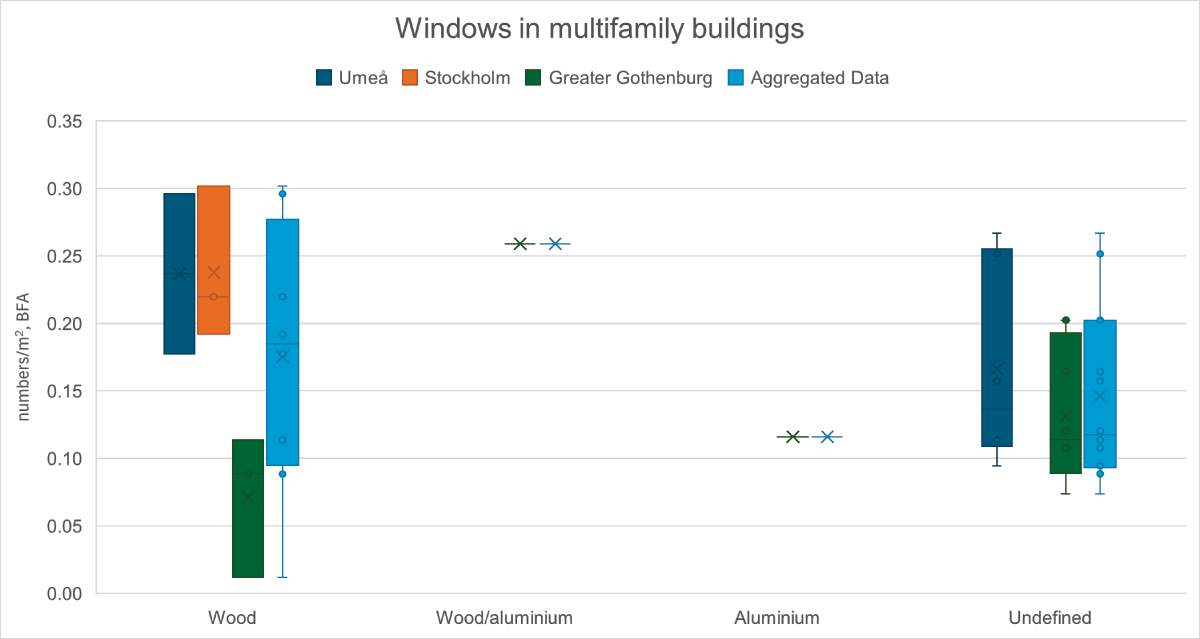
Figure 3
Distribution of product quantities per building footprint area (BFA) for windows in multifamily buildings in the three regions.
For windows, dispersion was greater in the multifamily datasets, whereas the preschool datasets showed tighter distributions where sample sizes were adequate. Within multifamily buildings, the Umeå and aggregated datasets (undefined category) displayed right-skewed distributions with extended upper tails. Regional contrasts were more pronounced in the multifamily data. The wood/aluminium and aluminium categories remained too sparsely represented for reliable interpretation.
Similar to windows, heating radiator quantities per m2 were higher in multifamily buildings than in preschools, particularly for water-based systems. Regional patterns moderated these differences. Within multifamily buildings, Stockholm exhibited the highest medians and Umeå the lowest, a pattern also observed in preschools for water-based systems. Elevated observations in Stockholm had a substantial influence on the multifamily datasets and overstated variability in preschool datasets, where distributions were comparatively tight.
Estimated quantities of facade products showed clearer contrasts between building types than between regions. Preschools were dominated by wood facades, with moderate regional variation, while mineral-based boards appeared mainly in Greater Gothenburg and plaster or brick facades only in small parts of the national sample. Multifamily buildings displayed far larger numerical ranges, especially for plaster and sheet metal facades, where Stockholm contributed extreme upper-tail observations that drove overall variability.
Across both building types, the aggregated medians generally obscured the influence of these high-magnitude cases and exaggerated the apparent spread in categories with tight regional distributions.
For preschool roof construction, roofing felt showed the most coherent pattern of use. The other roofing products analysed were sheet metal, clay tiles and concrete tiles. When the data from the regions were aggregated, the use of sheet metal and concrete tile varied, whereas roofing felt remained consistently used for all analysed regions.
In multifamily buildings, the use of clay tiles in roof construction became more dispersed in the aggregated dataset, largely due to the Gothenburg results. Roofing felt was used to a similar extent in Stockholm and Gothenburg, while sheet metal was slightly higher in Umeå and Stockholm than in Gothenburg. Other roofing products were rarely used.
The use of concrete frameworks showed a strong building-type contrast, with its use in quantities in multifamily buildings consistently higher than those in preschools. Conversely, the use of timber frameworks was higher in preschools than in multifamily buildings. Lightweight concrete frameworks appeared in both building types but were represented by small and uneven samples; quantities in multifamily buildings were generally higher or more variable.
For preschools, gypsum-board quantities showed clear regional variation with the lowest values in Umeå and the highest in Stockholm. The aggregated dataset’s median largely reflected the Gothenburg data due to its greater sample size.
For multifamily buildings, the gypsum board dataset was extremely limited. The box plot reflected only two widely separated observations, resulting in a broad distribution and substantial uncertainty. Consequently, no reliable inferences could be drawn.
3.2 STATISTICAL ANALYSIS OF REGIONAL DIFFERENCES
The collected data for the six selected product categories were statistically analysed using one-way ANOVA to identify significant differences between means. In total, data for 44 products across six categories (e.g. clay tile roofing in preschools) and the two building types were compiled (22 for preschools and 22 for multifamily buildings). This means that for all 44 products, data were available for at least one region. However, not all products had sufficient data to conduct either an ANOVA or a t-test.
As shown in Table 1, the statistical analysis of the six product categories across the two building types indicated statistically significant differences at the 5% significance level for wooden windows and concrete frameworks in multifamily buildings, and for water-based radiators, clay roof tiles and gypsum boards in preschools. Post-hoc analyses identified significant pairwise differences in three of these cases.
Table 1
Analysis of variance (ANOVA) indicating significant differences between means.
| BUILDING TYPE | PRODUCT | P-VALUE (ANOVA) | POST-HOC (METHOD) | RESULT |
|---|---|---|---|---|
| Multifamily buildings | Wood, windows | 0.04 | Tukey–Kramer (approximately homogeneity of variance, unequal sample sizes, p = 0.05) | Significant difference between the means of Greater Gothenburg and Stockholm |
| Preschool | Water, radiators | 0.04 | Games–Howell (significant difference in variance between group means, three groups, p = 0.05) | No significant difference between region means |
| Preschool | Clay tiles, roofing | 0.02 | Student’s t-test (only two regions with more than one value, p = 0.05) | Significant difference between the means of Stockholm and Greater Gothenburg |
| Preschool | Gypsum boards | 0.01 | Games–Howell | Significant difference between the means of Umeå and Greater Gothenburg |
| Multifamily buildings | Concrete, framework | 0.03 | Games–Howell | No significant difference in the means between any regions |
For wooden windows in multifamily buildings, the Tukey–Kramer post-hoc method was applied, as the ANOVA results indicated approximately homogeneous variances across regions but unequal sample sizes.
For clay roof tiles in preschools, ANOVA was not performed because the dataset for Umeå was too small. Instead, a direct two-sample t-test was conducted between Stockholm and Greater Gothenburg using a procedure suitable for samples with unequal variances.
For gypsum boards in preschools, water-based radiators in preschools and concrete frameworks in multifamily buildings, the Games–Howell test was used due to heterogeneity of variance between regions. This method is also appropriate when group sizes differ.
3.3 NATIONAL KPIs
Based on the calculated means and the results of the statistical analysis of differences between regional means, national KPIs were established. Table 2 presents the aggregated national KPIs derived from the datasets from Greater Gothenburg, Umeå and Stockholm for products where no statistically significant regional differences were identified. These KPIs are therefore suggested as national indicators given the current dataset. Table 2 also shows two national KPIs for both preschools and multifamily buildings: KPI1 (presence based) and KPI2 (stock based). The presence-based KPI represents the average quantity of a product in buildings where it is present, whereas the stock-based KPI represents the average quantity across the entire building stock, including buildings where the product is absent.
Table 2
Aggregated key performance indicators (KPIs) for preschools and multifamily buildings across all three regions, suggested as national KPIs.
| PRODUCT | PRESCHOOLS, KPI1/KPI2 | MULTIFAMILY BUILDINGS, KP1/KP2 | |
|---|---|---|---|
| Windows | Wood | 0.09/0.04 | No national KPI suggested |
| Wood/aluminium | 0.11/0.01 | 0.13/0.004 | |
| Aluminium | 0.09/0.003 | 0.06/0.002 | |
| Undefined | 0.10/0.04 | 0.14/0.06 | |
| Radiators | Water | 0.09/0.05 | 0.18/0.06 |
| Electricity | 0.11/0.02 | 0.24/0.02 | |
| Undefined | 0.08/0.01 | 0.12/0.003 | |
| Facade | Wood | 0.55/0.42 | 1.70/0.39 |
| Brick | 0.40/0.02 | 1.40/0.20 | |
| Mineral-based boards | 0.44/0.04 | 1.40/0.36 | |
| Treated wood | 0.21/0.01 | n.a. | |
| Plaster | 0.19/0.003 | 1.60/0.42 | |
| Sheet metal | n.a. | 4.20/0.36 | |
| Roofing | Clay tile | No national KPI suggested | 1.00/0.34 |
| Concrete tile | 1.30/0.18 | n.a. | |
| Roofing felt | 1.00/0.39 | 0.99/0.14 | |
| Sheet metal | 1.10/0.27 | 1.20/0.36 | |
| Eternita | 0.79/0.03 | 0.03/0.001 | |
| Frameworks | Timber | 10.70/7.10 | 14.90/7.90 |
| Concrete | 884/74.90 | 2,129/912 | |
| Lightweight concrete | 206/7.0 | 363/104 | |
| Treated timber | 4.80/0.25 | n.a. | |
| Brick | n.a. | 834/71.5 | |
| Steel | n.a. | 90.00/5.10 | |
| Gypsum boards | No national KPI suggested | 57.10/11.40 | |
[i] Note: KPI1 refers to the presence-based KPI; KPI2 refers to the stock-based KPI. n.a. = no data available.
aEternit roofing is a brand of durable, corrugated fibre-cement roofing sheets and slates.
The present study demonstrates, as a proof of concept, the feasibility of calculating KPIs for estimating potentially reusable product quantities at a national level using regional data. However, these findings are dependent on the current dataset and should be interpreted considering its limitations.
4. DISCUSSION
4.1 COMPARISON WITH PREVIOUS RESEARCH AND METHODOLOGICAL POSITIONING
The results contribute to the ongoing debate regarding the feasibility of harmonised indicators for circular construction. In the introduction, prior studies emphasised the need for reliable and standardised indicators (Aljaber et al. 2024; Lambec & Fivet 2025). This study demonstrates where such harmonisation is achievable and where it is constrained.
For stable products, such as roofing felt and timber frameworks, the findings align with Nasir et al. (2021), who argued that bottom-up methods can provide reliable and transferable indicators when construction practices are relatively consistent. In contrast, the pronounced variability observed for products such as gypsum boards and concrete frameworks reflects the challenges highlighted by Fasanmi & Ferriz-Papi (2025), Nicolas & Sébastien (2026) and Wu et al. (2022), who emphasised the limited and uneven documentation arising from pre-demolition audits and demolition activities. This variability evidenced in the present study is further explained by regional construction traditions and climatic influences as previously noted by Alsehail & Almhafdy (2020), Berggren & Wall (2019), D’amato & Kapoor (2024) and Hoxha & Birgisdottir (2025). Collectively, these factors restrict the applicability of uniform KPIs, underscoring the need to account for region-specific conditions.
The findings also reinforce the argument made by Nicolas & Sébastien (2026) that the value of pre-demolition audit and demolition documentation depends on the specificity and structure of the information recorded. Differences observed between municipalities suggest that inconsistent documentation practices may contribute to apparent regional variation—an interpretation consistent with Cha et al. (2017), Nicolas & Sébastien (2026) and Wu et al. (2022), who identified systematic discrepancies between reported and observed material quantities. This indicates that KPI reliability is influenced not only by regional construction practices but also by the quality of underlying data reporting and collection systems.
4.2 IMPLICATIONS FOR URBAN MINING AND CIRCULAR ECONOMY PLANNING
The findings have several implications for urban mining and circular construction. While detailed building-level inventories remain an important tool for identifying reusable products, they are often resource-intensive and time-consuming to undertake. The KPI framework has the potential to complement such inventories by providing scalable estimates of product stocks across larger building portfolios at early stages. This enables broader strategic planning and mapping of reuse potential, although the resulting estimates should be interpreted with an awareness of the associated uncertainties.
The results demonstrate that the applicability of KPIs depends on both product type and construction context. For products exhibiting high variability or statistically significant regional differences, such as gypsum boards in preschools and windows in multifamily buildings, the use of national KPIs may misrepresent local stock characteristics and lead to less effective reuse planning. This supports the recommendation of Lambec & Fivet (2025) that assessments should be progressively refined as more detailed and context-specific data become available. Conversely, products displaying relatively low variability, such as roofing felt and timber frameworks, appear more suitable for national-level KPIs, thereby supporting large-scale strategic planning and stock-mapping initiatives, as suggested by Gonçalves et al. (2025).
The observed variation in product intensities among preschool buildings further highlights the influence of local planning and governance decisions on building design. This finding is consistent with Ekman Ladru & Gustafson (2025) and Mårtensson & Nordström (2017), who emphasised the role of municipal planning frameworks in shaping construction practices. Consequently, estimates of product stocks should consider not only regional construction traditions but also the governance structures that influence the built environment.
The results also indicate that aggregated datasets can mask important differences within building stocks. Several product distributions exhibited upper-tail characteristics that became less visible when data were aggregated, reinforcing concerns raised by Devos et al. (2025) and Hoxha & Birgisdottir (2025) that national-scale building stock models may overlook local variation and compromise accuracy. This finding further emphasises the importance of selecting an appropriate level of spatial and statistical aggregation when developing stock estimates for reuse planning.
Overall, the study demonstrates that KPI-based methods can provide a practical means of estimating product stocks at scales where detailed inventories are not feasible or for mapping at an early stage. However, their reliability depends on product characteristics, regional context and data representativeness. As three products exhibited statistically significant regional differences, national KPIs cannot be assumed to be universally applicable. At present, regional KPIs appear to provide the most reliable basis for forecasting and planning, although further data collection and validation are required to confirm their robustness and applicability across wider geographical contexts.
4.3 REGIONAL KPI VARIATION
This study examined whether KPIs derived from demolition-permit documentation can be generalised across regions and, by extension, whether national KPIs are feasible. A direct comparison between regional KPIs and an aggregated national value was not undertaken because the latter is derived from the regional figures and cannot serve as an independent benchmark, making such a comparison circular. The analysis therefore concentrated on regional variation within each building type, as differences between typologies are structurally self-evident. The core question was whether regional KPIs differ significantly. Significant regional divergence would render aggregated KPIs unrepresentative of local conditions, whereas limited variation would support their use for national-level planning and generalisation across regions.
The results show that while many products exhibit limited regional variation, e.g. roofing felt and timber frameworks, five products displayed significant differences: gypsum boards, clay roof tiles and water-based radiators in preschools, and wooden windows and concrete frameworks in multifamily buildings. For three of these (gypsum boards and clay roof tiles in preschools, and wooden windows in multifamily buildings), pairwise tests confirmed the differences, strengthening the evidence for genuine regional divergence. These marked variations indicate that, contrary to the initial hypothesis, KPIs derived in one region cannot be directly applied to others.
The regional differences observed align with earlier research showing that product use and construction traditions vary geographically (Berggren & Wall 2019; Hoxha & Birgisdottir 2025). The pronounced variation in window intensities across multifamily buildings corresponds with climate-dependent window-to-wall ratios (Alsehail & Almhafdy 2020), while differences in gypsum-board quantities likely reflect divergent construction practices and municipal standards (Ekman Ladru & Gustafson 2025). The lower prevalence of wooden windows in multifamily buildings in Greater Gothenburg may also stem from the region’s harsher coastal and high-moisture conditions, which favour aluminium or other non-wooden frames due to their greater durability and reduced maintenance needs.
Taken together, these findings reinforce the view that product-level stock estimation is context dependent, as noted in urban-mining research (Berggren & Wall 2019; Devos et al. 2025; Hoxha & Birgisdottir 2025). National KPI averages may provide broad approximations, but reliable planning for reuse, procurement and circular-economy strategies requires KPIs tailored to regional conditions. The findings suggest that aggregated national KPIs cannot confidently be applied across all products. For stable categories with low regional variation national-level KPIs may be adequate. However, for products with significant regional differences, region-specific KPIs are essential to avoid misrepresenting local conditions. Aggregated datasets should therefore be used cautiously because they can obscure meaningful differences.
4.4 CHOICE OF METRIC FOR KPIs
This study used means to maintain a consistent KPI methodology across products and regions. Although medians can be advantageous for sparse or skewed datasets, the mean is better suited for estimating average quantities per unit area and for the aggregation and statistical comparisons required to evaluate regional alignment and the feasibility of national KPIs. It also supports the aim of applying a uniform KPI-derivation procedure across all regions and aligns with standard inferential methods such as ANOVA. The KPIs presented should therefore be regarded as a proof of concept rather than definitive estimates of product quantities.
To address uncertainty while retaining the mean as the primary metric, box plots were employed as robustness checks to visualise medians, quartiles and outliers, thereby highlighting skewness and dispersion without altering the KPI calculations. KPIs were calculated using means, statistically assessed using ANOVA, and complemented with box plots for transparent comparison across regions and aggregated datasets. Where the KPIs showed no statistically significant regional differences, they were combined into a national dataset and proposed as national KPIs (Table 2).
Overall, this approach balances long-term comparability with short-term robustness. The mean supports future national scalability, while distributional summaries enhance transparency and indicate where skewness or outliers warrant cautious interpretation and further refinement.
4.5 METHODOLOGICAL LIMITATIONS AND FUTURE RESEARCH
First, this study should be regarded primarily as a methodological development study. The dataset was used to develop and test the proposed method and to explore potential differences between regional and national datasets, rather than to establish definitive benchmarks. The analysis draws on demolition permit data from 38 buildings, supplemented by 57 buildings reported by Ericsson et al. (2026). While sufficient for method development and identifying broad trends, the dataset limits the statistical robustness of the results. Variations in sample size, uneven regional representation and atypical buildings may have influenced the findings.
Second, demolition-permit documentation remains inconsistent in quality, structure and completeness, echoing concerns raised in earlier research (Cha et al. 2017; Ericsson et al. 2026; Wu et al. 2022). Where detailed information was unavailable, material fractions were used to approximate product quantities, introducing some uncertainty but enabling the inclusion of otherwise missing material flows. Consequently, the reported KPIs should be considered indicative rather than universally applicable. Future research should validate the method using larger and more geographically diverse datasets to improve reliability and support the development of robust regional and national benchmarks.
Third, the study focuses on estimating the availability of potentially reusable products within existing building stocks. However, availability represents only one dimension of actual reuse potential. Factors such as technical performance, remaining service life, aesthetic quality, damage, contamination and ease of dismantling may significantly affect reuse in practice. Although outside the scope of this study, these factors should be considered when interpreting the reuse potential based on the reported product quantities. They were intentionally excluded from the KPI framework at this stage, as the primary purpose of the KPIs is to quantify products within existing buildings and establish a basis. Future research could build on this foundation by incorporating additional product characteristics to provide more realistic reuse potential estimates.
Fourth, the KPIs were normalised using BFA, as this was available with relatively high consistency across the demolition permits. Although BFA provides a practical basis for comparison, it may represent reusable product quantities less accurately than metrics such as heated or gross floor area. This limitation is particularly relevant when comparing building types with differing spatial configurations and numbers of storeys, and likely to be more pronounced for the multifamily buildings than for the relatively homogeneous single-storey preschools in this study. The findings should therefore be interpreted with caution. Future research should examine the influence of alternative normalisation variables on KPI accuracy and assess whether building type-specific, regional or national KPIs provide more reliable estimates.
Finally, the study was conducted in a Swedish context, and the resulting KPIs reflect Swedish buildings characteristics, construction practices and demolition permit data. Nevertheless, the methodological framework is not specific to Sweden and can be applied wherever comparable building inventory data are available. Further studies should test the methodology in different geographical contexts to evaluate its transferability and identify regional variations in product stocks and reuse opportunities.
5. CONCLUSIONS
This study assessed whether demolition-permit-derived building product key performance indicators (KPIs) can be generalised across Swedish regions, and if national indicators can support product-level stock estimation for circular construction planning. By applying a bottom-up method to datasets from the Swedish municipalities of Umeå and Stockholm, as well as the Greater Gothenburg region, the study generated a comparative evidence base that clarifies both the potential and the limitations of regional KPI transferability.
The results show that regional differences exist but are selective rather than widespread. Only a few products—gypsum boards and clay roof tiles in preschools, and wooden windows in multifamily buildings—displayed statistically significant regional differences, indicating that regional KPIs remain essential for certain products. By contrast, several products, such as roofing felt and timber frameworks, showed limited regional variation, suggesting that national KPIs may be sufficiently robust for these products. These findings provide empirical support for a differentiated approach to indicator harmonisation, where the feasibility of national KPIs depends on product-specific stability rather than an assumed regional uniformity. Although some products show significant regional differences, the overall pattern does not indicate systematic divergence. Instead, regional variation appears modest, meaning that national KPIs could still be feasible for certain products, provided further data are collected to confirm their reliability.
Beyond these findings, the study reinforces a recurring challenge in circular construction research: the inconsistency and incompleteness of demolition permit documentation. Despite expanding the empirical base across three urban regions, the availability, structure, and precision of underlying data varied markedly, affecting both the reliability of product quantification and the statistical power of cross regional comparisons. This highlights the need for more standardised, reuse oriented reporting practices, including strengthened pre demolition audits and harmonised documentation requirements.
Taken together, the results suggest that KPI-based stock estimation is a viable but evolving method. Its utility depends on both methodological refinement and improvements to the quality of underlying data. Although detailed building-level inventories remain necessary for project-specific reuse assessments, KPI-based approaches can complement these and support strategic planning through broader estimate of product stocks, albeit with greater uncertainty. Future research should therefore prioritise the development of larger regional datasets, further investigate potential regional variations in reuse opportunities, incorporate additional product-related characteristics, and examine how different normalisation variables influence KPI accuracy. As the construction sector moves towards circularity, such advances will be critical for enabling reliable planning of reusable product flows and for building a more comprehensive national understanding of the urban mine.
SUPPLEMENTAL DATA
Supplemental data for this article can be accessed at: https://doi.org/10.5334/bc.827.s1
Appendix A: Product-specific assumptions.
Appendix B: Box plots, medians and numbers of observations for each product, region and building type.
DATA ACCESSIBILITY
Data on total estimated product quantities from all demolition permits across the three regions, together with building-level information, are available at https://doi.org/10.5281/zenodo.22810214. More detailed data will be made available from the authors upon request.
AI DECLARATION
The authors used Microsoft Copilot to translate and proofread the manuscript. All content was subsequently reviewed and edited by the authors, who take full responsibility for the final publication.
AUTHOR CONTRIBUTIONS
F.E.: conceptualisation, data curation, formal analysis, investigation, methodology, writing—original draft, writing—review and editing. K.M.: conceptualisation, funding acquisition, supervision, writing—review and editing. U.J.: conceptualisation, supervision, writing—review and editing.