
Table 1
Scales and categories.
| SCALE | ||||
|---|---|---|---|---|
| INDEPENDENT BUILDING LEVEL | CONTEXTUAL BUILDING LEVEL | AGGREGATED INDICATORS | ||
| Category | Density & Coverage | |||
| Environmental | Environmental | |||
| Geometry & Shape | Geometry & Shape | |||
| Physical Appearance & Size | ||||
| Neighbourhood & Proximity | ||||
| Position & Orientation | ||||
| Road Network | Road Network | |||
| Semantics | Semantics | |||
| Socio-economic | Socio-economic | |||
[i] Note: Gaps indicate no metrics were found for this scale-category combination.
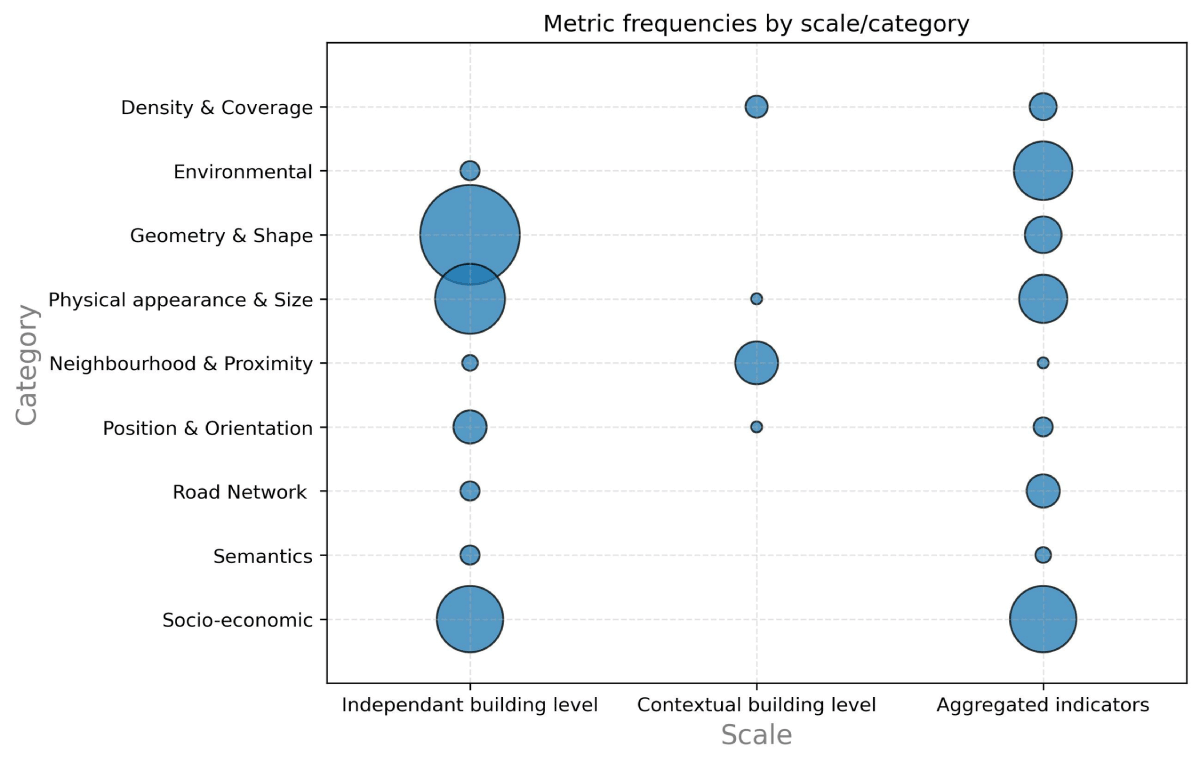
Figure 1
Urban morphology metric (UFM) frequencies by scale and category.
Table 2
Top urban form metrics (UFM) per scale level including category, importance and frequency of appearance.
| SCALE | CATEGORY | UFM | NORMALIZED IMPORTANCE (nI) | FREQUENCY (n) |
|---|---|---|---|---|
| Independent building level | Physical Appearance & Size | Area | 1 | 21 |
| Physical Appearance & Size | Height | 0.5747 | 12 | |
| Physical Appearance & Size | Volume | 0.4479 | 6 | |
| Road Network | Distance to the nearest road | 0.4284 | 6 | |
| Physical Appearance & Size | Perimeter | 0.4202 | 12 | |
| Contextual building level | Neighbourhood & Proximity | Number of neighbours within the buffer | 0.1463 | 4 |
| Density & Coverage | Ratio of building area to total block area | 0.1409 | 4 | |
| Density & Coverage | Ratio of area covered by buildings within the buffer | 0.1336 | 1 | |
| Physical Appearance & Size | Ratio of building volume to total block volume | 0.1252 | 1 | |
| Neighbourhood & Proximity | Separation | 0.1169 | 1 | |
| Aggregated indicators | Environmental | Night-time light intensity | 0.2465 | 5 |
| Socio-economic | Point-of-interest (POI) kernel density | 0.1962 | 5 | |
| Density & Coverage | Impervious surface ratio within the block | 0.1912 | 2 | |
| Density & Coverage | Number of buildings in a block | 0.1771 | 2 | |
| Semantics | Land use | 0.1608 | 3 |
Table 3
Data sources for top urban form metrics (UFM) per scale level.
| SCALE | UFM | DATA SOURCE | |||||||
|---|---|---|---|---|---|---|---|---|---|
| CENSUS DATA | LIDAR | NTL DATA | OFFICIAL DATA | OSM | OTHER | POI DATA | REMOTE SENSING | ||
| Independent building level | Area | ✖ | ✔ | ✖ | ✔ | ✔ | ✔ | ✖ | ✔ |
| Height | ✖ | ✔ | ✖ | ✔ | ✔ | ✔ | ✖ | ✔ | |
| Volume | ✖ | ✔ | ✖ | ✔ | ✔ | ✔ | ✖ | ✔ | |
| Distance to the nearest road | ✖ | ✖ | ✖ | ✔ | ✔ | ✔ | ✖ | (✔) | |
| Perimeter | ✖ | (✔) | ✖ | ✔ | ✔ | ✔ | ✖ | ✔ | |
| Contextual building level | Number of neighbours within the buffer | ✖ | (✔) | ✖ | ✔ | ✔ | ✔ | ✖ | ✔ |
| Ratio of building area to total block area | ✖ | ✖ | ✖ | ✔ | ✖ | ✔ | ✖ | ✔ | |
| Ratio of area covered by buildings within the buffer | ✖ | ✖ | ✖ | (✔) | ✔ | ✖ | ✖ | (✔) | |
| Ratio of building volume to total block volume | ✖ | ✖ | ✖ | (✔) | ✖ | ✖ | ✖ | ✔ | |
| Separation | ✖ | (✔) | ✖ | (✔) | ✔ | ✖ | ✖ | (✔) | |
| Aggregated indicators | Night-time light (NTL) intensity | ✖ | ✖ | ✔ | ✖ | ✖ | ✖ | ✖ | ✖ |
| Point-of-interest (POI) kernel density | ✖ | ✖ | ✖ | (✔) | ✔ | ✖ | ✔ | ✖ | |
| Impervious surface ratio within the block | ✖ | ✖ | ✖ | ✔ | ✔ | ✔ | ✖ | ✔ | |
| Number of buildings in a block | ✖ | ✖ | ✖ | ✔ | ✖ | ✖ | ✖ | ✔ | |
| Land use | ✖ | ✖ | ✖ | ✔ | ✔ | ✔ | ✖ | (✔) | |
[i] Note: ✔ = Metric has been used in collected papers from this data source; (✔) = metric has not been used in collected papers from this data source, but could technically be provided by/derived from it; ✖ = metric cannot be provided by/derived from this data source.
OSM = OpenStreetMap.
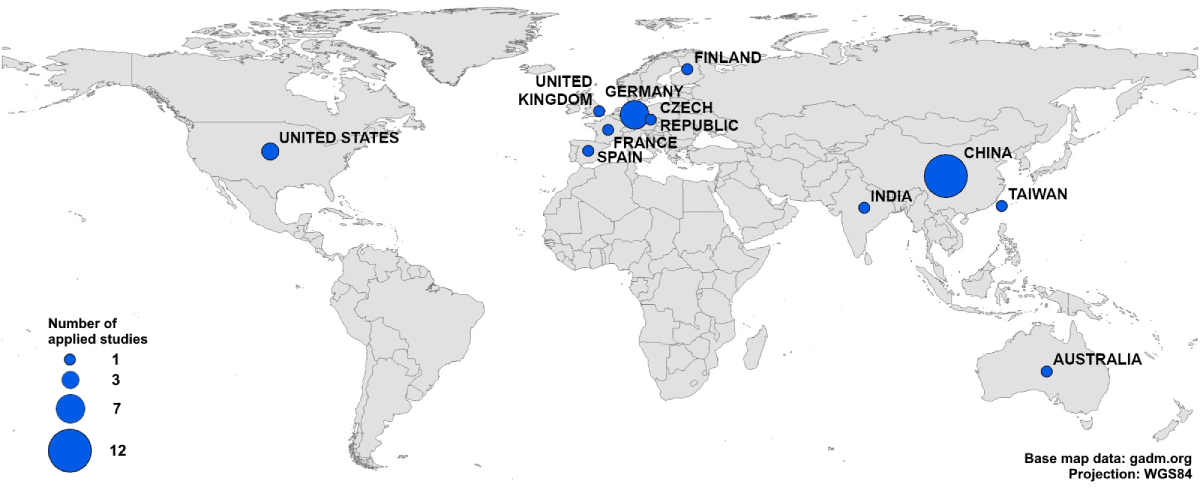
Figure 2
Number of applied studies considered in target countries according to source papers.
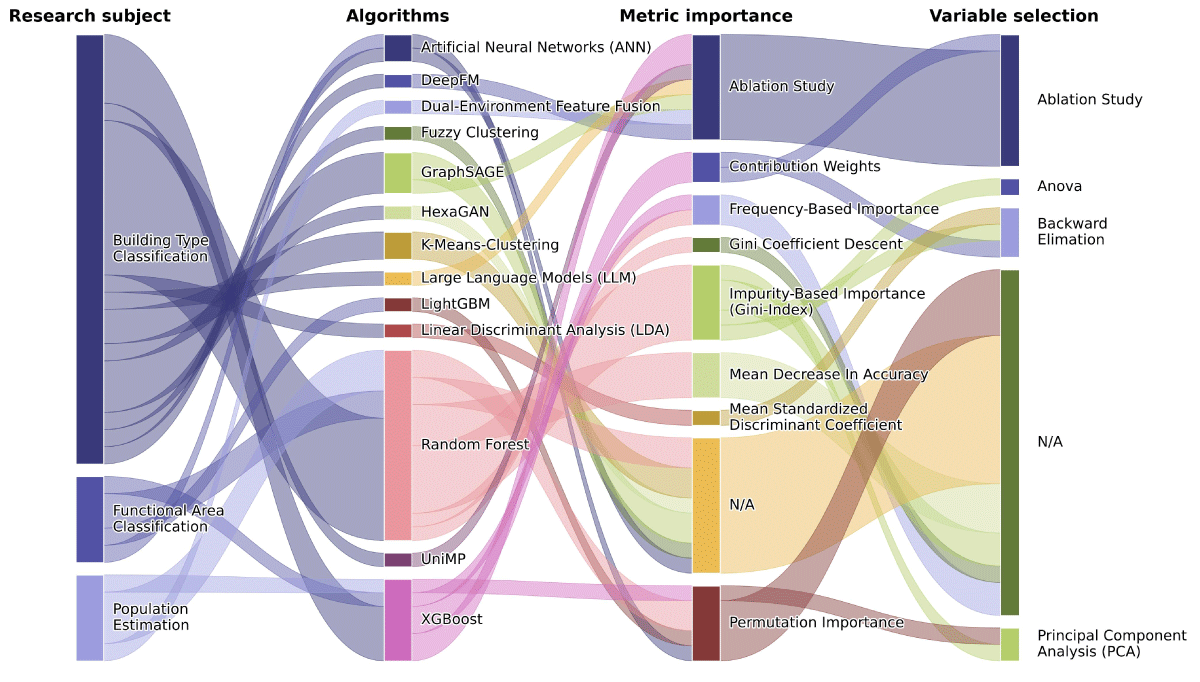
Figure 3
Overview of the algorithms used, metric importance ranking and variable selection strategies.
Note: Papers using multiple algorithms or methods are expanded into separate entries for each instance.