
1. Introduction
Commonly dubbed the ‘king of instruments’, the pipe organ dates back to ancient Greece (Williams 1993). In the third century BCE, Ctesibius of Alexandria invented a water-powered instrument called the hydraulis, which was popular in Roman times but, following the Empire’s decline, was rarely used. The pipe organ saw a resurgence in the eighth century; various innovations followed, including the use of bellows (Williams 1980). The pipe organ was firmly established in European churches by the 12th century, and following the Renaissance became incredibly popular in Britain with large installations at key religious sites such as Westminster Abbey and St Paul’s Cathedral, representing ecclesiastical power in all its grandeur and complexity. Well before the 19th century they were established in Britain as a core part of religious architecture. Today organs are considered a key heritage element, revered for their beauty and majesty in both sound and appearance (Williams 1993). Unfortunately, they are currently facing threat of removal, especially in impoverished areas. The UK charity Pipe Up estimates that of the 30,000–40,000 pipe organs in Britain, up to four per week are being scrapped (Pipe Up 2023). The conservation of pipe organs is a complex undertaking due to the variety of materials and craftsmen involved in their construction, specifically, mahogany, ivory, ebony and animal leathers (Williams 1980, 1993; Pipe Up 2023). Given the fragile nature of the materials used, it is abundantly clear that rising indoor temperatures will have adverse impacts on the conservation of pipe organs (Owen 1997; Douglas 1995; Xing et al. 2011, 2013).
Much concern has been raised regarding a gradual increase in the UK’s thermal comfort demands since the 1960s (Mavrogianni et al. 2013). Whilst suitable for homes, the temperature ranges at which people in the present day feel comfortable have been shown to have a disastrous impact on heritage buildings. In their 2014 systematic literature review, Public Health England recommended a room temperature of 18°C for ‘a sedentary person, wearing suitable clothing’ (Wookey et al. 2014: 6). This, however, does not reflect the general modern consensus for comfortable room temperature. In their study Yohanis & Jayanta (2010: 683) analysed the guidelines of various governing bodies, including the Building Research Establishment (BRE) and the UK government, concluding that ‘a temperature range of 19–21°C is considered satisfactory to achieve thermal comfort in homes’. The variability of room temperature moving into the 2020s has become increasingly static, with many modern indoor environments, as per recommendations by the American Society of Heating, Refrigerating and Air-Conditioning Engineers (ASHRAE) and International Organization for Standardization (ISO), limit room temperature variation to ±0.5 K. Dynamic set-point operational ranges are beginning to gain traction; however, large-scale implementation will require further research and education efforts (Pallubsinky et al. 2023). Heritage researchers recommend temperature ranges of 16–22°C and relative humidity (RH) ranges of 45–55% for historic buildings using heating, ventilation and air-conditioning (HVAC) systems (Camuffo 1998; Camuffo & Bernardi 1995; Negro et al. 2016; Schellen et al. 2003). Curteis & McVicker (2025) were willing to specify 18°C and 55% RH as optimal for pipe organ operation and conservation. However, maintaining such ranges in historic buildings has been found to be highly problematic. A series of papers by A. W. M. van Schijndel (van Schijndel 2008; van Schijndel et al. 2003, 2009) identified the relationship between low RH, high temperature (T) and damage to a monumental organ at the Walloon Church in Delft, the Netherlands (Schellen et al. 2003). In East Anglia, UK, medieval rood screens were discovered to have suffered various forms of degradation due to neglect, high mean humidities and extreme seasonal temperature/humidity variation (–1 to 28°C, 41–96% RH) (Curteis et al. 2020). Artefactual elements of churches: pipe organs, carvings, joinery, paintings and plasterwork, are placed at great risk of degradation when subjected to internal temperatures designed for human comfort and temperature variability.
Heritage buildings, churches in particular, are often assumed to be inefficient by those from a non-conservation background. Their thick, solid-walled constructions are unfamiliar to modern architects, whose work typically involves layered constructions of sheet materials and insulation. The use of high-temperature warm air-heating systems to meet thermal comfort demands may be leading to increased energy usage. Without immense energy expenditure, these systems fail to warm the occupants sitting in the pews, standing at the altar or in the chancel, whilst simultaneously causing damage to the church fabric and artefactual elements located in the upper reaches (typically organs) due to thermal stratification. Increasingly, the efficacy of bolstering traditional heating methods and HVAC systems with passive measures, as well as appropriate awareness and use of thermal mass, is being recognised as the optimal approach to conservation, energy efficiency and thermal comfort (Xing et al. 2011). The European Friendly Heat Project has begun to develop a multifaceted heating system, utilising a range of elements, including foils, infrared heaters and heated glass panes, to warm churchgoers when seated in pews or stood near the altar, whilst keeping historic elements such as carvings, panelling and masonry at lower ambient temperatures (Camuffo & Valle 2007). Radiant heaters, in particular, offer individual spot heating without raising air temperatures (Curteis & McVicker 2025).
One glaring issue regardless of the success of the friendly heating system is the increasing expectations for indoor church temperatures. If these expectations have indeed risen and continue to rise, there will be losses in terms of not only damage to church architecture and artefacts but also in a greater energy demand to accommodate such increases. The internal temperature of a church can change based on a variety of factors, namely the time of year, diurnal cycles, geographical location, human behaviours within it, HVAC system set-point operation and comfort expectations of visitors, all of which can lead to changes in temperature or humidity that may damage elements of the church. It has been noted that a distinct lack of indoor historical temperature data exists, making it difficult to identify longitudinal changes in thermal comfort expectations. Until now, the most fruitful historical record for obtaining weather information and meteorological data of the past has been parish records, though they typically constitute outdoor environment and weather records, not interior conditions. However, climate historians have used the sparse descriptions of weather events to great effect. For example, Williams & Archer (1999) used parish records to identify and predict flooding patterns dating as far back as the sixteenth century (Veale et al. 2017). Thus, a precedent for historical sources to offer valuable insights into the climates of the past had been set. This study offers a new data source: pipe organ tuning books.
Organ tuning books are small books kept for the benefit of organ tuners and church organists. Within, faults are recorded for the organ tuner to correct upon their next visit. Some tuning visits will deliver two spot measurements: a temperature reading (T) and a RH reading. To create the desired sound, pipe organs are tuned at a prespecified temperature, typically that of the occupied church during a service. Therefore, it can be presumed that the temperature readings found in organ tuning books are representative of thermal comfort expectations. It must be acknowledged that thermal comfort expectations in churches have been historically lower than residential buildings. Nineteenth-century perceptions of indoor church climates have been described as ‘damp and cool’ (Eriksdotter 2013: 29). Thus, internal thermal comfort expectations, at least in churches, can be mapped to organ tuning book data. Organ books typically reside within organ cases next to the keyboard. All bar one of the 22 records identified in this paper were found in similar locations at different churches, making organ tuning books a fairly accessible data source. If the books are not found in the historic buildings themselves, they may appear in public archives or private collections.
This is not to say that every church or organ has an organ tuning book. Many of the churches contacted or visited during the initial data collection phase of this project did not have an organ book. It must be acknowledged that organ tuning books are not a consistent record: their ability to relay longitudinal temperature data is reliant solely on the ability of the church and organ tuners to conduct maintenance. Pipe organs fall into periods of disuse when the accumulated detuning and damage cause them to prove too difficult or too expensive to repair, which can increase the ‘spottiness’ of the data contained within. Writing for the Royal School of Church Music, Harper (2015) stated that tunings varied based on the condition and usage of the organ. However, a general rule is to tune either every quarter, or every six months or every year. Moreover, not all organ books contain temperature and humidity data. Of the 22 books identified during this pilot study, four did not contain any usable temperature data. The oldest book in this study dates from 1943; however, it did not contain any temperature or humidity information. Older tuning records do exist, and some may contain temperature and RH readings, considering clergymen such as Revd W. Derham were recording temperatures using thermometers to record indoor temperatures as early as 1703 during the Great Frost, predating mercury thermometers by over a decade (Derham 1708).
Temperature and humidity control is at the core of historic building conservation. Muñoz Gonzáleza et al. (2020) found safe temperature and RH ranges for conservation to be between 10 and 20°C and below 65% RH. The installation of heating systems was shown to cause rapid degradation in churches when artefacts experienced an ‘extreme departure’ from their historical climate (Camuffo & Valle 2007). Organs themselves are at risk of detuning when operated at a room temperature 5°F above or below that of their original tuning. The American Institute of Organbuilders (AIO) (2006) recommended humidity ranges for maintaining organ tuning above 30% RH in winter and below 80% RH in summer. These ranges coincide with those intended for general church conservation. van Schijndel et al. (2009) found that when RH fell below 30%, wooden organ components experienced ‘drying-induced stress’ in the form of fractures and cracks, highlighting the risk to other wooden components in churches and historic buildings when HVAC systems are used at maximum capacity to rapidly heat indoor temperatures to meet thermal comfort demands.
Pipe organs are highly susceptible to rapid temperature changes and can be considered representative in nature of other volatile church features such as carpentry, artefacts and paintings which are all vulnerable to acetic acid and formic acid secretions in historic environments (Smedemark et al. 2020; Curteis et al. 2020). According to Camuffo & Valle (2007), the principal risk to organs is pipe corrosion, which occurs when wooden parts release formic and acetic acids; variations in microclimatic conditions can slow or accelerate this process. When Niklasson et al. (2008) surveyed the atmospheric environment of multiple historic European organs, they found heightened levels of formic and acetic acids and other corrosive compounds during summer suggesting higher temperatures were conducive to corrosion. The quality and build of a pipe organ may also influence the frequency at which faults occur. Material choice and positioning can greatly increase the chances of pipe corrosion: lead-rich pipes are at greater risk of corrosion when housed in hardwood instrument cases which can leak formic and acetic acids (Albano et al. 2017). A hallmark study by Smedemark et al. (2020) found that in a room at 23°C and 50% RH, emissions of formic and acetic acids from three types of wood were significantly higher (145–303 µg/m2/h) than in a room at 10°C and 50% RH which caused emission rates of 39–108 µg/m2/h. Pipe organs kept in warmer environments will experience more faults; the same conditions may also damage other artefactual elements vulnerable to formic and acetic acids.
Church artefacts with high thermal inertia, such as fabrics and paintings on canvas, were found to be severely damaged by the rapid heating and drop in RH caused by warm air heating systems (Camuffo & Valle 2007). As previously mentioned, medieval rood screens were also found to be at risk (Curteis et al. 2020). Schellen et al. (2003) found that rapid temperature changes cause shrinkage in wooden organ parts, causing cracking and splitting. This was argued to be the effects of a warm air heating system producing high thermal stratification, causing hot air to gather around the organ. A second study found that heating Delft’s Walloon Church between 18 and 20°C was causing significant damage to the organ; the aforementioned temperatures were required because visitors to the church did not wear overcoats, demonstrating the detrimental impact of rising thermal comfort expectations on heritage buildings (van Schijndel et al. 2009). Pitsch et al. (2008) found that ambient temperature changes surrounding organ pipes caused detuning. Aparicio-Fernandez et al. (2021) and Muñoz Gonzáleza et al. (2020) both concurred that temperature and RH fluctuations caused by historic heating systems were damaging pipe organs and other historic features. Whilst rapid drops in RH were responsible for causing damage to church artefacts, controlling for RH through HVAC operation was shown to be less effective than controlling for temperature to achieve the correct temperature and RH requirements for conservation (van Schijndel et al. 2009).
2. Methods
This study utilised a mixed methodology consisting of both qualitative and quantitative data analysis using data collected from organ tuning books. Given the unreliable nature of organ books, this study opted for a convenience sampling strategy, choosing to use organ tuning books from churches accessible at the time of research by the researchers. According to Stratton (2021), this could introduce regional biases, which must be acknowledged. Given the small sample size, caution must be observed when extrapolating local trends onto a national scale. This study is considered a pilot study, designed to demonstrate the value of organ tuning book analysis. Should this value be recognised, then a larger study utilising a more uniform sampling method, i.e. census sampling or common probability sampling, may be conducted.
Organ books offer qualitative data in the forms of fault reports and comments. This study employed ‘purposeful sampling’ as its primary method for qualitative data collection, extraction and analysis (Patton 1990). Purposeful sampling refers to a sampling methodology that selects specific samples of limited quantity based on the richness of their information. Organ tuning books containing relevant qualitative data such as tuner and organist comments relating to research objectives were selected for analysis and presentation. Comments relating to weather, internal church climate, temperature and humidity were prioritised when searching tuning books for information. This study utilised ‘extreme of deviant case sampling’ and ‘intensity sampling’ to highlight special cases within the qualitative data illustrative of key issues in pipe organ conservation, even if they do not fully represent the range of data available. An example comes in the form of the organ tuning book at St Bride’s, Fleet Street in the City of London, UK, which yields an exceptionally large amount of written information relating to the severity of the church’s internal environment; both organ tuning book and church are at the upper extreme of qualitative data and internal environment, and the issues illustrated by these extremes are representative of the dangers facing churches and building conservation as a whole. Given the abundance of qualitative data it contains, the organ tuning book at St Bride’s warrants its own study.
Quantitative spot data in the form of temperature and RH were extracted from 18 organ tuning books in the UK. Eleven tuning books belonged to Sir Christopher Wren’s City of London Churches and one to Nicholas Hawksmoor’s St Mary Woolnoth; the other six belonged to churches across Nottinghamshire and Derbyshire.1 Churches were labelled rural or urban based on their proximity to an urban centre. Organ tuning books were digitised, and quantitative data were extracted and recorded in a spreadsheet database. Organ temperature and humidity data were divided into ‘summer readings’ and ‘winter readings’. The former constitutes measurements taken between March and August; the latter constitutes measurements taken between September and February. Temperature and RH readings were compared with ideal conservation ranges. Readings were also used to identify long-term internal temperature trends with seasonal variations, and increases in internal church temperature were contrasted with pre-existing data from hallmark energy surveys (Mavrogianni et al. 2013). Geographical data were used to illustrate and compare temperature trends (seasonal and general) between urban and rural churches. Case study analysis of complete datasets, such as that of St Mary Aldermary, was conducted to highlight internal temperature changes over time.
3. Results
3.1 Indoor temperature trends
According to Mavrogianni et al. (2013), winter indoor domestic temperatures in Britain have increased by 1.3°C per decade between 1978 and 1996, indicating an increase in thermal comfort demands. The following section assesses whether this increase is representative of indoor church temperature trends and discusses the implications of increased indoor temperatures and thermal comfort demands on the conservation of churches and other historic buildings. Historical evidence suggests a great disparity between modern and historic temperature expectations. In 1889, the Journal of the Society of Arts recommended a comfortable room temperature to be in the range of 15.5–18.3°C (Hoey [et al.] 1889/1906); historic expectations of church temperatures were certainly lower (Eriksdotter 2013). Historical evidence shows a clear desire for thermal comfort in churches. In his diary entry for 14 January 1667/68, Samuel Pepys recalled a story from the Great Fire about the death of an old man who had entered a burning church to retrieve his ‘blanket which he had in the church’ (Pepys 1889: vol. 7, 304). Present-day temperature standards range between 18 and 21°C (Yohanis & Jayanta 2010; Wookey et al. 2014), with set-point operation standards sitting between 21°C for heating and 24°C for cooling (Pallubsinky et al. 2023), which represents a significant increase in thermal comfort demands between 1889 and today. Because the time of inspection varies each year, Figures 1 and 2 and Tables 1 and 2 can be considered indicative only of general indoor church temperature trends.
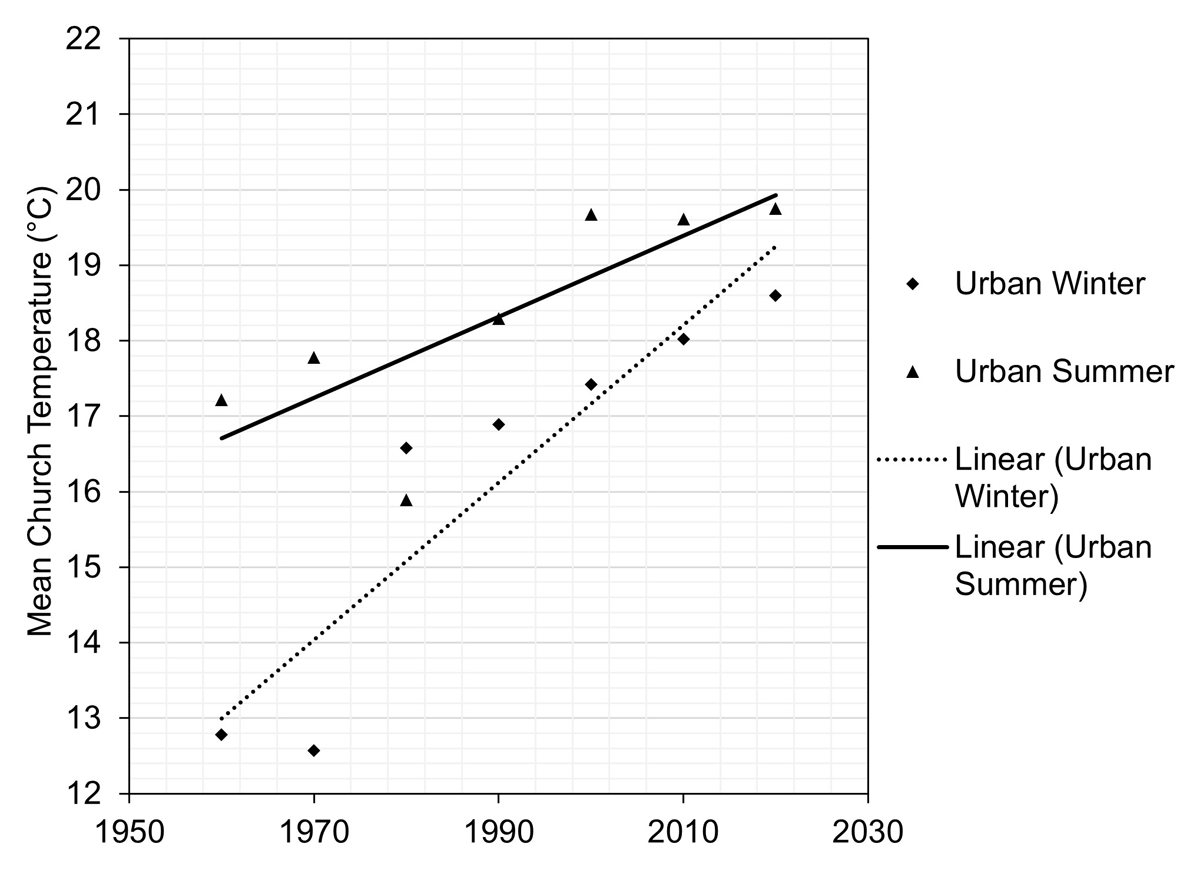
Figure 1
Mean seasonal indoor church temperature trends based on organ tuning book records in the UK.
Note: Data were obtained using daytime spot measurements (1966–2024), based on aggregated data from 18 churches.
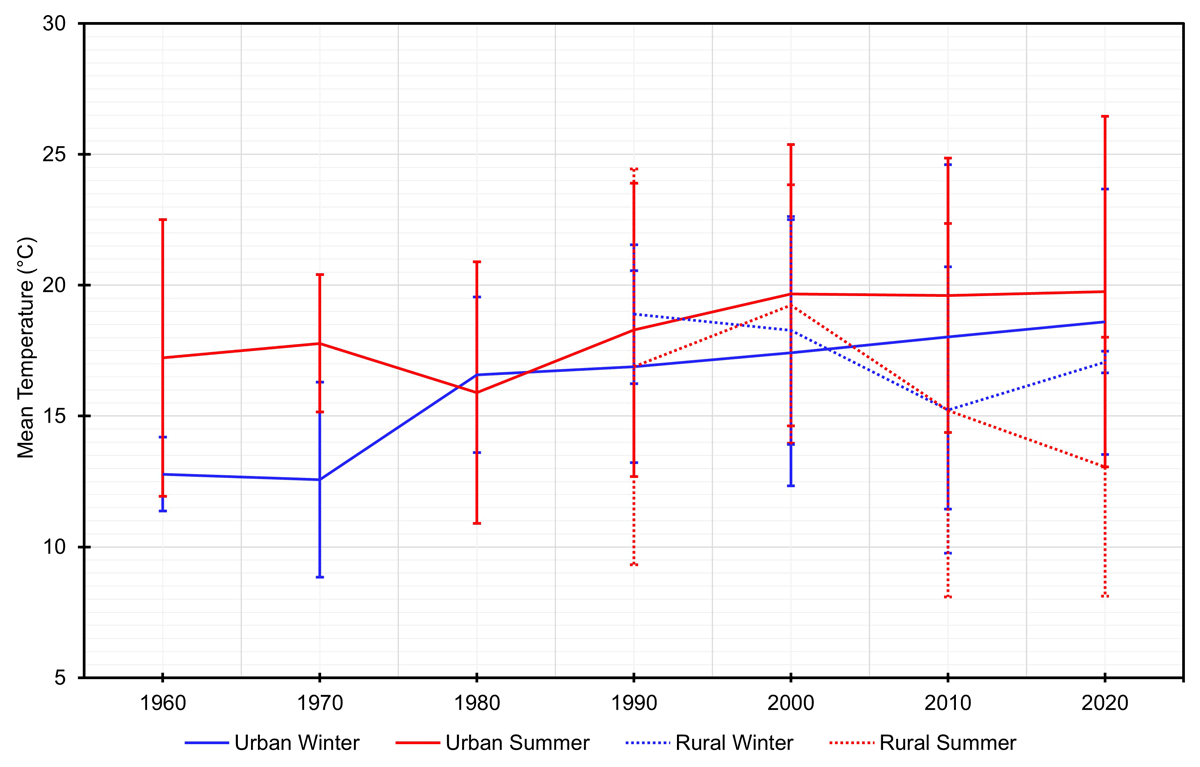
Figure 2
Indoor church temperatures by decade.
Note: Data are based on a preliminary sample of 18 churches, with error bars (the standard deviation is based on the data shown in Table 2).
Table 1
Indoor church temperatures by decade derived from the study’s sample of 18 churches.
| 1966–69 | 1970–79 | 1980–89 | 1990–99 | 2000–09 | 2010–19 | 2020–24 | |
|---|---|---|---|---|---|---|---|
| Mean temperature (°C) | 15.5 | 15.2 | 16.1 | 17.4 | 18.4 | 18.3 | 18.9 |
Table 2
Indoor church temperatures by decade, based on a preliminary sample of 18 churches.
| PERIOD | SEASON | LOCATION | SAMPLE MEAN (°C) | SD |
|---|---|---|---|---|
| 1966–69 | Winter | Urban | 12.78 | 1.41 |
| Rural | – | – | ||
| Summer | Urban | 17.22 | 5.29 | |
| Rural | – | – | ||
| 1970–79 | Winter | Urban | 12.57 | 3.73 |
| Rural | – | – | ||
| Summer | Urban | 17.78 | 2.62 | |
| Rural | – | – | ||
| 1980–89 | Winter | Urban | 16.58 | 2.97 |
| Rural | – | – | ||
| Summer | Urban | 15.89 | 5.00 | |
| Rural | – | – | ||
| 1990–99 | Winter | Urban | 16.89 | 3.67 |
| Rural | 18.89 | 2.65 | ||
| Summer | Urban | 18.29 | 5.61 | |
| Rural | 16.88 | 7.56 | ||
| 2000–09 | Winter | Urban | 17.42 | 5.09 |
| Rural | 18.27 | 4.36 | ||
| Summer | Urban | 19.67 | 5.71 | |
| Rural | 19.23 | 4.61 | ||
| 2010–19 | Winter | Urban | 18.02 | 6.58 |
| Rural | 15.23 | 5.47 | ||
| Summer | Urban | 19.61 | 5.24 | |
| Rural | 15.22 | 7.14 | ||
| 2020–24 | Winter | Urban | 18.60 | 5.07 |
| Rural | 17.06 | 0.41 | ||
| Summer | Urban | 19.75 | 6.70 | |
| Rural | 13.06 | 4.95 |
[i] Note: SD = standard deviation.
Table 1 shows the mean indoor temperatures of the 18 churches for every decade between 1966 and 2024, with a non-linear progressive rise of 3.4°C. In the 1970s, mean indoor temperatures dropped by 0.3°C, as the most likely impact of the 1970s’ energy crisis which resulted in soaring fuel prices relative to previous decades and shortages of petroleum caused by trade embargos and a population-wide desire to use less energy. Coinciding with Mavrogianni et al. (2013), a steady increase of the mean indoor temperature is visible since the 1970s.
Table 2 and Figure 2 display the mean indoor temperatures of each individual church every decade between the 1960s and 2020s, accounting for seasonal and geographical variations. There was a disparity in the distribution between rural and urban churches in the data. Due to a lack of data from rural churches before the 1990s, Figure 1 displays only urban church temperature data between 1966 and 2024. An upward trend in the expectations of thermal comfort since 1966 can be observed. Between 1966 and 2024, there was a 5.82°C increase in mean indoor winter temperatures in the urban churches, which indicates an increase of 0.97°C per decade. At the turn of the century, the progression slowed to around 0.5°C per decade. Mavrogianni et al. (2013) found an increase of up to 1.3°C in indoor winter temperature per decade between 1978 and 2008 in UK homes. Organ tuning book records indicate an increase of 1.2°C per decade in churches in the same period. Whilst churches overall tend to harbour cooler internal environments, a small group were shown to be subject to the same national thermal comfort demand changes as UK homes. Urban churches were found to experience significantly higher indoor temperatures than rural churches during both summer and winter in the 2010s–20s. The lack of rural indoor temperature data from the previous decades sheds doubts on the validity of such a trend before 2010. During the 2010s, the mean indoor temperature of urban churches was 2.79°C higher than rural churches in winter and 4.39°C higher in summer. This disparity could be caused by the urban heat island effect, where rapid urban development and replacement of the natural environment with solar energy-absorbing materials, such as concrete and asphalt, can lead to higher indoor and outdoor temperatures due to higher thermal load and poor ventilation in urban areas (Xing & Jones 2021). It was also observed that rural churches frequently used portable electric heaters which are less efficient than air-source heat pumps (Muñoz Gonzáleza et al. 2020), which may affect cost-sensitive heating schedules in rural churches.
3.2 Factors influencing microclimatic conditions
The degree to which a church experiences temperature fluctuations should coincide with its thermal mass as buildings with higher thermal mass release heat into the indoor environment throughout the day, stabilising indoor temperature (Yang & Zhang 2014). Human activity and HVAC operation can also influence the microclimatic conditions of a church. Solid walled churches using traditional construction techniques and systems were shown to have a higher thermal mass than modern layered-wall-construction churches, experiencing less natural temperature fluctuation in line with outdoor temperature and weather changes (Aparicio-Fernandez et al. 2021). The construction of the city churches, for example, of Portland stone, gives the buildings a higher thermal mass. The red brick construction of the Long Eaton Baptist Church is conducive to a lower thermal mass.
One study of an unheated church found that human behaviours, such as opening doors in the morning and congregating in the evening, caused indoor temperatures to change throughout the day (Aparicio-Fernandez et al. 2021). Extracts from Pepys’s diary suggest that churches nearing full capacity were warmed solely by body heat in the late seventeenth century:
After dinner to St. Dunstan’s again; and the church quite crowded before I came, which was just at one o’clock; but I got into the gallery again, but stood in a crowd and did exceedingly sweat all the time.
(entry for 17 August 1662; Pepys 1889: vol. 2, 308)
It must be noted that the impact of human activity on a church’s microclimate is heavily dependent on congregation size. Curteis et al. (2020) calculated the effect of human-generated heat and moisture from a congregation of 20 people on St Agnes’s, Cawston, microclimate to be negligible. They acknowledge, however, that larger congregations on a damp day ‘could result in damaging environmental instability’ (Curteis et al. 2020: 6).
HVAC operation in line with thermal comfort requirements is likely the largest contributor to fluctuations in church temperature. The tuning book of St Bride’s, Fleet Street, features multiple comments about the church’s internal temperature. On 8 October 2005, a tuner comments: ‘very hot church’; another comment from November 2006: ‘normally very warm […] no church heating on’. These comments suggest that human error is the cause of temperature changes, especially the comment mentioning heating. A comment from 15 October 1995 in the Sacred Heart’s, Carlton, tuning book speculated that poor weather may have caused damage to the swell box and detuned the organ: ‘Tuning of swell worse. Weather? Misty.’
As a part of new church attendance initiatives, many City of London churches have installed cafés serving hot food and drink to encourage visitors: St Mary Aldermary, St Nicholas Cole Abbey and St Mary-le-Bow, to name a few. The use of appliances such as coffee machines and dishwashers, alongside increased foot traffic, may cause dangerous microclimatic changes to the church environment. Between opening its Host Café on 27 November 2012 (Moot Community 2024) and the last organ tuning book record in 2019, the mean temperature of St Mary Aldermary was 19.6°C. The mean indoor temperature for 2003–11 was 18.1°C, indicating café installation may have increased internal temperature by as much as 1.5°C. The Church of England’s Presence & Engagement policies (P&E) open church doors to various religious groups throughout the week. St Lawrence Jewry and St Andrew-by-the-Wardrobe are occupied by a diverse array of religious and cultural groups. A church watcher at St Andrew-by-the-Wardrobe commented that before the installation of the air-source heat pumps, the church was nicknamed ‘St Andrew’s by the Freezer’ by various members of the congregation (The Church of England 2024). Overall, there is evidence that thermal mass, human activity, HVAC operation and weather can influence microclimatic conditions.
3.3 Urban versus rural comparison
Organ tuning books permit comparison of urban and rural churches. Figure 3 shows seasonal temperature and humidity variations at St Mary Aldermary, rebuilt in 1681 under the supervision of Sir Christoper Wren. Whilst Table 2 insinuates that churches adhered largely to safe conservation ranges, Figure 3 demonstrates that when observed, individual churches experience significant departures from safe temperature and humidity ranges. Winter temperatures at St Mary Aldermary were lower, correlating with higher RH levels from September to February. The lowest recorded temperature at St Mary Aldermary was 8.9°C in winter 1973 and the highest was 25.0°C in 1997. Humidity exceeded the recommended safe ranges for conservation in 1993, 1996, 2000, 2003, 2005, 2012, 2013 and 2019, with RH reaching as high as 68%. Between 1982 and 1993, St Mary Aldermary experienced higher temperatures in winter than in summer; likely a result of over compensatory indoor heating.
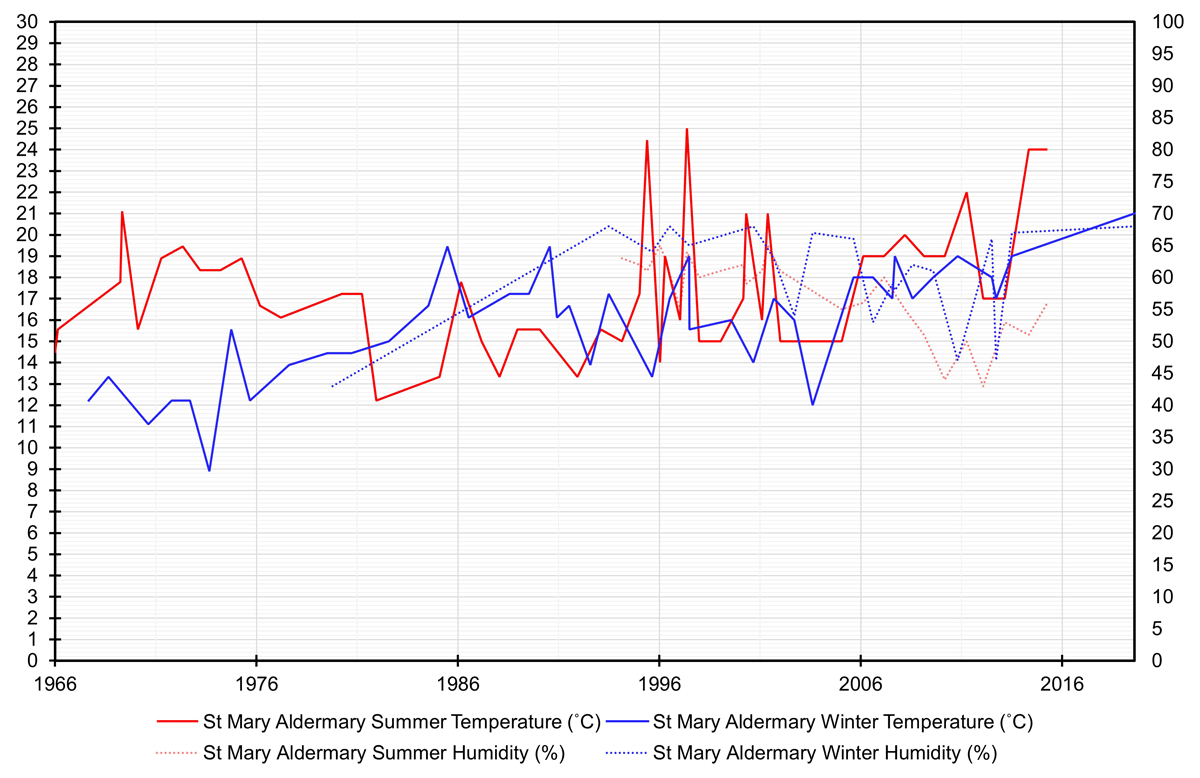
Figure 3
Indoor temperature and humidity variation at St Mary Aldermary, 1966–2019.
Figure 4 illustrates the temperature and humidity throughout the seasons at All Saints’ Church, which is a rural church situated on the edge of the village Sawley, Nottinghamshire. This church is heated by a central heating system using a boiler and radiators, supplemented by electric heaters. Between 1993 and 2019, All Saints was subject to significant temperature variations. The lowest temperature recorded was 7.8°C and the highest 25.0°C. Temperature fluctuations were similar to those of St Mary Aldermary, with the lowest temperature exceeding that of the urban church. All Saints maintained a significantly higher mean humidity of 65% compared with St Mary Aldermary’s 59%. The organ at All Saints also never dropped below the recommended lower bound for RH of 40%, but did exceed the upper bound reaching a peak of 77% RH in October 2000, indicating an internal environment at greater risk of biological deterioration and damage. It was again observed that on multiple occasions indoor winter temperatures exceeded indoor summer temperatures.

Figure 4
Indoor temperature and humidity variation at All Saints’ Church, Sawley, 1993–2017.
Table 3 compares the mean indoor temperature and humidity between a sample of both rural and urban churches. Churches experiencing day-to-day usage, such as St Bride’s, Foster Lane, exhibited higher temperature and lower RH levels than those used infrequently. The mean temperature for St Bride’s was a soaring 20.9°C, with a mean RH of 45.1%. In contrast, St Clement’s, Eastcheap, which opens only twice a week, had a mean indoor temperature of 18.6°C and a mean humidity of 59.5% between 1989 and 2009, indicating that frequency of use may impact long-term indoor temperature trends. Rural churches exhibited a lower mean temperature and a higher mean humidity overall; the opposite appears to be true for urban churches, which exhibited a higher mean temperature and a lower mean humidity.
Table 3
Mean indoor temperature and humidity (winter and summer) comparison of a small sample of urban and rural churches.
| CHURCH | T (x̄) (°C) | SD (σ) | RH (x̄) (%) | SD (σ) | PERIOD |
|---|---|---|---|---|---|
| Rural | |||||
| All Saints’ Church, Sawley, Nottinghamshire | 15.9 | 6.4 | 65.1% | 6.7 | 1993–2017 |
| Our Lady and St Edward’s Church, Nottingham | 14.8 | 3.4 | 64.2% | 7.5 | 2005–21 |
| St Leonard’s Church, Birmingham | 17.3 | 6.3 | 62.2% | 8.2 | 1999–2022 |
| Urban | |||||
| St Mary Abchurch, Abchurch Lane, London | 17.7 | 7.9 | 55.5% | 5.9 | 1993–2008 |
| St Bride’s, Fleet Street, London | 20.9 | 4.3 | 45.1% | 10.2 | 2002–24 |
| St Vedast Foster Lane, London | 18.9 | 5.0 | 49.9% | 6.9 | 2006–24 |
[i] Note: RH = relative humidity; SD = standard deviation; T, temperature.
3.4 Fault frequency
The literature suggests that warmer churches are more likely to face conservation issues, particularly in terms of pipe organ damage. Fault reports contained within tuning records highlight issues with the organ (Figure 5); by assessing the fault rate of two churches and comparing them, the impact of higher overall indoor temperatures on organ conservation is quantified. The rate at which faults are reported depends on two factors: the frequency of organ usage and the frequency at which faults occur. Figure 6 compares the mean temperatures of 12 City of London churches, permitting comparisons of fault frequency between hotter and cooler churches.
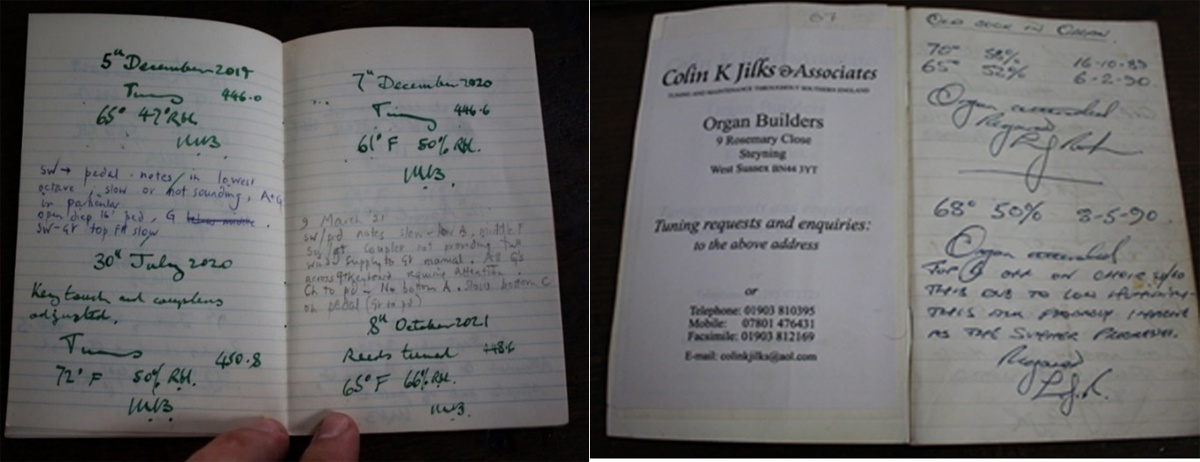
Figure 5
Two examples of organ tuning books.

Figure 6
Mean temperature and standard deviation of 12 City of London churches.
Note: Data are based on organ tuning records.
Figure 7 compares organ fault report frequency between the hottest church (St Bride’s, Fleet Street) and the coldest church (St James Garlickhythe) between 2010 and 2020. The data show that in a 10-year period, 50 organ faults were reported in the tuning book of St Bride’s. Faults ranged from ‘solo box still not working […] very difficult to control’ to ‘Voix Celestes stop head has come loose’; many reports contained multiple faults. In the same 10-year period, only nine faults were reported in the tuning book of St James Garlickhythe. Faults included ‘SW.4 stop extending further than usual’ and ‘Parchment split under Great middle E on bar’; few reports contained multiple faults. In this instance, staff at the hotter church reported over five times more organ faults than at the cooler church in the same 10-year period.
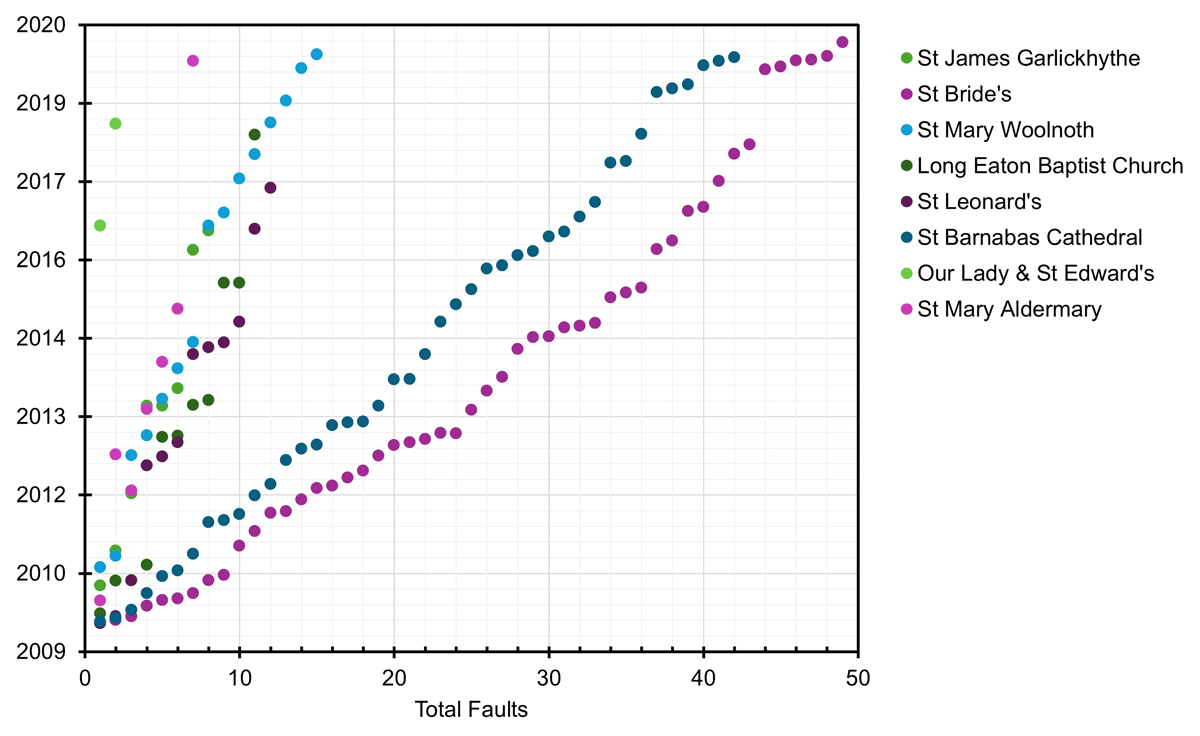
Figure 7
Pipe organ fault report frequency comparison between eight churches.
Note: Data were derived from organ tuning records.
Figure 7 also shows fault frequency in six other churches: St Mary Woolnoth, Long Eaton Baptist Church, St Leonard’s Church, St Barnabas Cathedral Church, Our Lady and St Edward’s Church, and St Mary Aldermary. Between 2010 and 2020, St Barnabas in Nottingham had a mean temperature of 16.8°C, and its pipe organ experienced 43 faults. The number of faults seems relatively high in comparison with the temperature; however, the frequency of use and organ quality can play a major factor in fault frequency and fault report frequency. Being a cathedral, St Barnabas undoubtedly hosts a higher number of ceremonies and services than the other churches, making it more liable to fault. St Mary Woolnoth, in comparison, had a mean temperature of 19.4°C in the same period, during which time 15 faults were reported; however, multiple comments mention the ‘poor condition’ of the organ.
3.5 Pipe organ disuse and the future of the pipe organs
Many of the churches visited for this project contained organs that had either not been played in several years or had fallen into disrepair due to high maintenance costs and time commitment. Whilst automatic tuning systems are in development, church uptake is slow, and organ tuning remains a costly and time-consuming process for the majority of churches (Sulz et al. 2016). The scale at which pipe organs are becoming obsolete is alarming for those interested in heritage and traditional musicianship. Table 4 indicates pipe organ disuse based on tuning records. Only 10 out of the 22 churches visited had fully operable pipe organs, meaning 54.5% (may be much worse in general) had pipe organs that were no longer being used. However, the disused organs do not appear to be structurally damaged. The pipe organ at Long Eaton Baptist Church fell into disuse during the COVID-19 pandemic when church services were held online. Since regular services resumed in 2021, the organ has not been reinstated as the church has instead opted for an electric keyboard. Despite having been built in 1781, St Mary Aldermary’s pipe organ (Figure 8) is still operational; however, it is disused due to a lack of organ-players. The primary reason for the disuse of organs appears to be the lack of an organ culture within the congregation, specifically a significant shortage of organ-players. It is evident that modern congregations tend to favour contemporary electronic instruments, such as keyboards and electric guitars, or more accessible alternatives, such as the piano and violin. Despite tremendous efforts to train new organ-players through programmes such as organ scholarships, the situation remains dire.
Table 4
Pipe organ disuse, based on 22 organ tuning book records.
| LOCALITY | CHURCH | PIPE ORGAN STATUS | LAST TUNED |
|---|---|---|---|
| Derbyshire | Long Eaton Baptist Church | Out of order | 9 December 2019 |
| Nottinghamshire | All Saints’ Church, Nottingham | Operational | 15 December 2023 |
| Holy Trinity Church, Ratcliffe on Soar | Out of order | 1 June 2015 | |
| St Barnabas’ Cathedral Church, Nottingham | Operational | 8 March 2024 | |
| All Saints’ Church, Sawley | Out of order | 28 June 2017 | |
| Our Lady and St Edward’s Church, Nottingham | Out of order | 5 October 2021 | |
| Church of the Sacred Heart, Carlton | Operational | 13 October 2023 | |
| Catholic Church of St Augustine, Nottingham | Operational | 27 September 2023 | |
| St Mary’s Church, Nottingham | Out of order | 19 July 2016 | |
| West Midlands | St Leonard’s Church, Birmingham | Operational (needing repair) | 11 April 2022 |
| City of Londona | St Bride’s, Fleet Street | Operational | 18 March 2024 |
| St Clement’s, Eastcheap | Out of order | 7 July 2009 | |
| St James Garlickhythe | Out of order | 20 September 2022 | |
| St Lawrence Jewry | Out of order | 8 March 2023 | |
| St Magnus the Martyr | Operational | 20 December 2022 | |
| St Margaret Pattens | Out of order | 2 May 2024 | |
| St Margaret Lothbury | Operational | 11 July 2023 | |
| St Martin within Ludgate | Out of order | 17 November 2017 | |
| St Mary Abchurch | Out of order (displaced) | 5 December 2008 | |
| St Mary Aldermary | Operational (but disused) | 1 November 2019 | |
| St Mary Woolnoth | Operational | 7 October 2023 | |
| St Vedast Foster Lane | Operational | 22 April 2024 |
[i] Note: aAll the City of London churches listed were designed and built by Sir Christopher Wren and his office in the period after the Great Fire of London (1666), except for St Mary Woolnoth, which was designed and built between 1716 and 1727 in a different building campaign by Nicholas Hawksmoor for the Commission for Building Fifty New Churches of 1711.
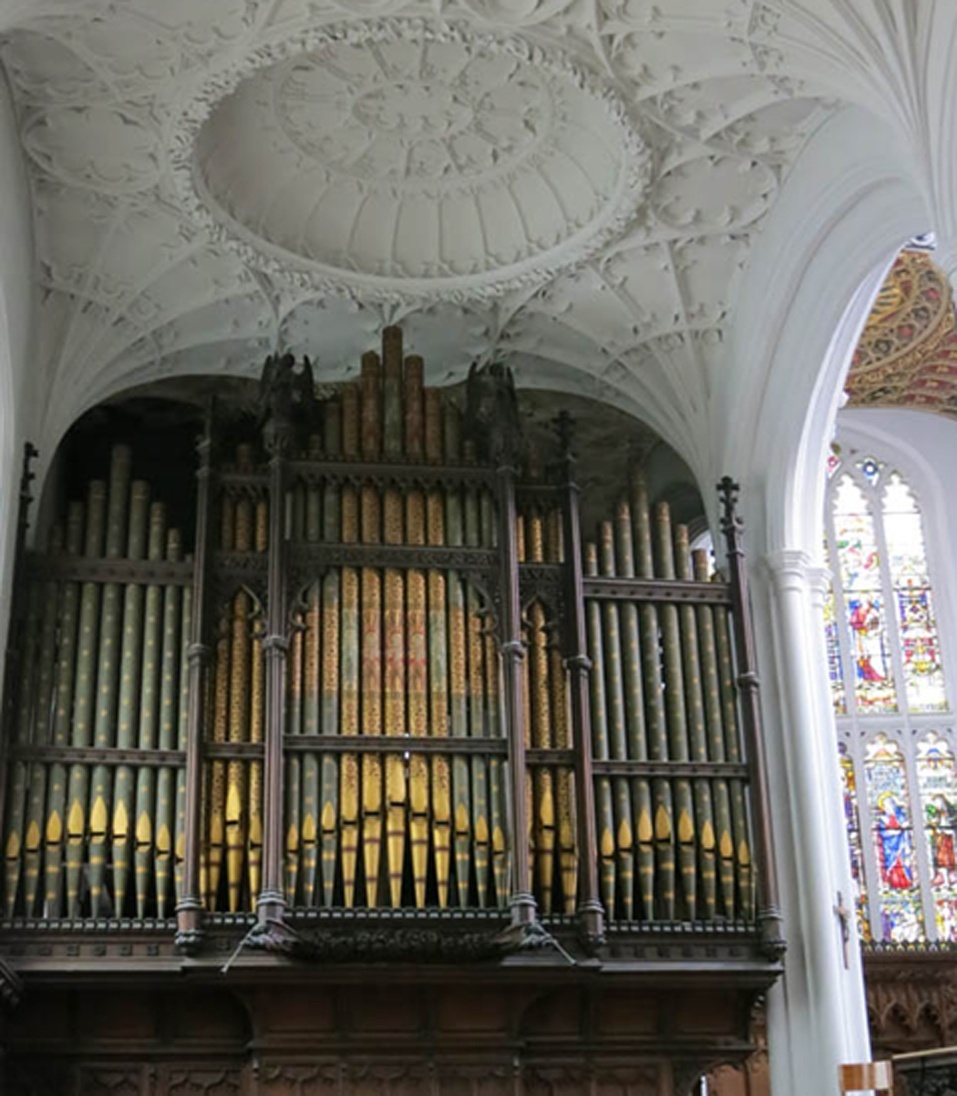
Figure 8
The pipe organ at St Mary Aldermary, first built in 1781 by England & Russell, London.
Source: National Pipe Organ Register (NPOR), https://npor.org.uk/
4. Discussion and conclusions
Overall, organ tuning books offer a promising historical indoor temperature record. Organ tuning data show that churches experienced the same increase in thermal comfort expectations as homes in the UK. Urban churches experienced higher indoor temperatures across both winter and summer of up to 3.2°C and were therefore at greater risk of artefactual and architectural degradation. Rural churches were found to be at greater risk of biological deterioration caused by humidities up to 17.8% higher than urban churches, as well as lower temperatures. Urban churches maintain a higher risk of stress-related deterioration caused by higher temperatures and lower humidities. The risks, therefore, appear to vary based on geographical location as well as time of year. The development of specified approaches to indoor environment regulation is key to preventing further damage to heritage objects.
Indoor temperature increases, causing the costs of organ maintenance to rise, is an unfortunate side effect of the desire to experience indoor thermal comfort in churches and other heritage buildings. Tempering thermal comfort expectations in line with historic levels would help historic spaces to be enjoyed without causing them harm. Undoubtedly, wearing extra clothing might be the first step to mediating expectations and allowing for lower temperatures in indoor spaces. Eriksdotter (2013) points out that in the 19th century, expectations for indoor church climates were ‘damp’ and ‘cool’. Whilst a full regression to this association is not necessary for building conservation, it does paint a picture about how much expectations have changed with regard to the comfort provided by indoor historic spaces.
Although a specific indoor temperature cannot be determined at which point faults become more frequent, there does appear to be a positive correlation between mean church temperature and organ fault frequency as observed in this study. Warmer churches experienced more pipe organ faults than cooler churches, indicating suboptimal set-point operation and the negative influence of inflated thermal comfort expectations. The decline in the use of pipe organs is multifaceted, closely linked to decreasing church attendance and a dwindling number of skilled organists. The general rise of indoor temperatures is also associated with this decline as warmer environments increase organ maintenance costs. These factors combined may also have contributed to the reduced presence of pipe organs in churches. Additionally, providing a thermally comfortable church environment is often presented as necessary to maintain or increase attendance, but in reality, is inflicting more damage upon church organs and artefacts. Higher static ambient temperatures have been found to be injurious to health, even in ageing and vulnerable populations, as they prevent the body from building resilience through processes of thermal acclimation (Pallubsinky et al. 2023).
With all this in mind, greater care is recommended when utilising churches as communal spaces of warmth. Church heritage buildings play a significant role in sustainable development but are at risk of being made redundant. The Warm Welcome Campaign is undoubtedly a positive social development; however, heating churches in order to meet the standards of a ‘warm welcome’ could have detrimental side effects with regard to the conservation of these buildings (WWS 2024). It would be beneficial to retain the use of these buildings long into the future, allowing more people to use them and learn about their history. To that end, mediation of thermal expectations in churches is paramount. Due to their thick-walled construction and typically cool internal environments, churches are better placed as a refuge during heatwaves, which are becoming increasingly common (Pallubsinky et al. 2023).
Future research is needed to discover more tuning books and develop interdisciplinary research collaboration between organ-builders and engineers. It is clear that many church organs are in danger of being lost. As thermal comfort expectations continue to rise, congregations shrink and maintenance becomes more expensive, a greater conservation research effort is needed to protect and preserve these majestic instruments. Clearly, a greater research effort is required to solve this multifaceted conservation problem.
1 All but one of the City of London churches mentioned in this study were designed and built by Wren and his office in the period after the Great Fire of London (1666). St Mary Woolnoth was designed and built between 1716 and 1727 by Hawksmoor in a different building campaign for the Commission for Building Fifty New Churches of 1711.
Data accessibility
The data are available from the authors upon reasonable request.
Notes
[4] All but one of the City of London churches mentioned in this study were designed and built by Wren and his office in the period after the Great Fire of London (1666). St Mary Woolnoth was designed and built between 1716 and 1727 by Hawksmoor in a different building campaign for the Commission for Building Fifty New Churches of 1711.
Acknowledgements
The authors gratefully acknowledge the churches that generously provided access to their tuning books. Their support and trust made this research possible.
Competing interests
The authors have no competing interests to declare.