
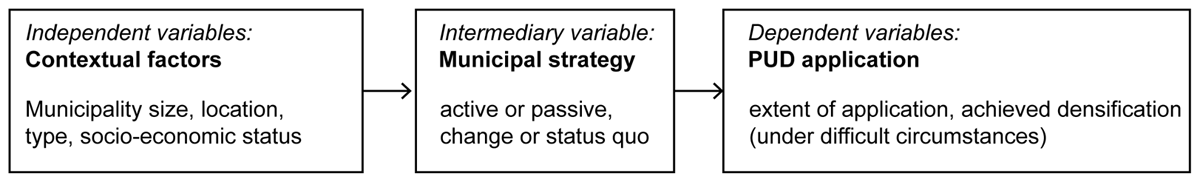
Figure 1
Conceptual framework.
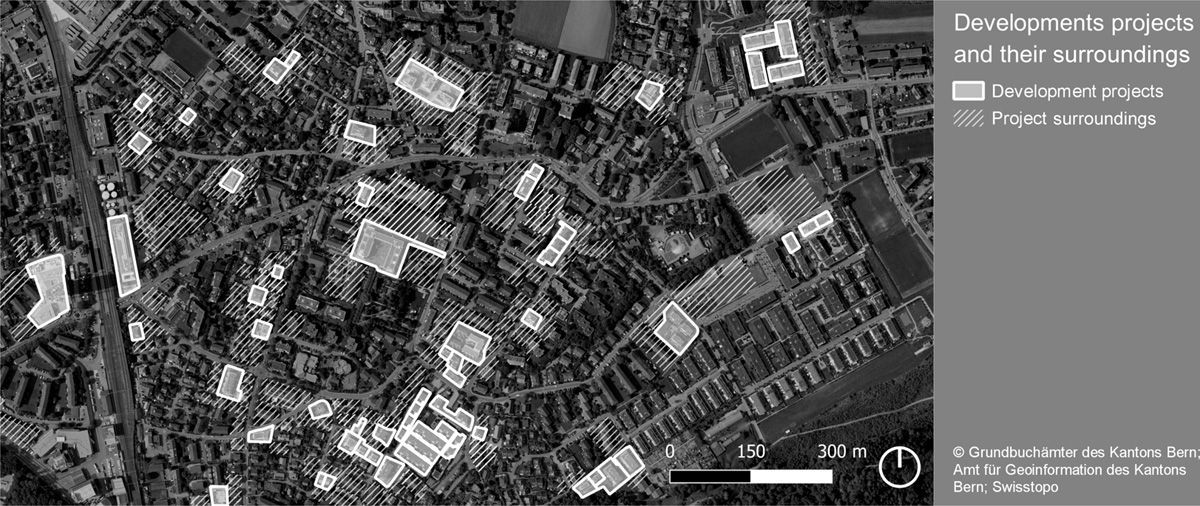
Figure 2
Delineation of development projects and their surroundings.
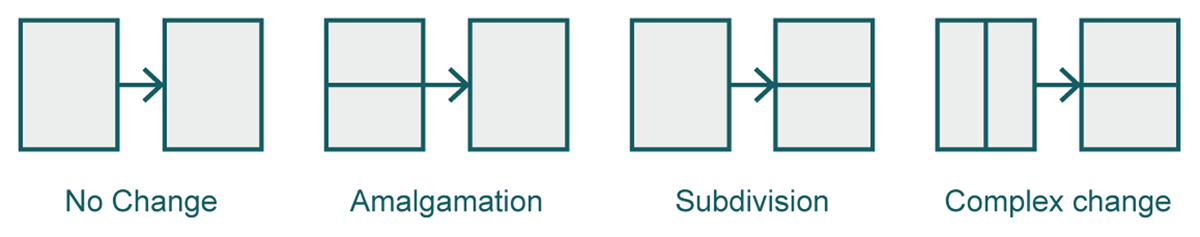
Figure 3
Four types of parcel changes.
Table 1
Descriptive statistics and data sources.
| VARIABLE | UNIT OF ANALYSIS | CONVENTIONAL | PUD | SOURCE (S) | ||||||||
|---|---|---|---|---|---|---|---|---|---|---|---|---|
| N | MINIMUM | MAXIMUM | MEDIAN | SD | N | MINIMUM | MAXIMUM | MEDIAN | SD | |||
| Construction year | Building | 46,842 | 2002 | 2023 | 2010 | 6.5 | 13,686 | 2002 | 2023 | 2010 | 6.3 | A |
| FSI | Parcel | 11,130 | 0.3 | 22.8 | 0.5 | 0.7 | 3114 | 0.3 | 17.2 | 0.6 | 1 | A |
| BCP | Parcel | 11,130 | 0 | 5433469 | 62 | 51569 | 3114 | 0 | 57780 | 79 | 2316 | A |
| Parcel area (m2) | Parcel | 11,130 | 12 | 41436 | 620 | 1296 | 3114 | 64 | 112706 | 614 | 3200 | B |
| Historic parcels (n) | Project | 5483 | 1 | 27 | 1.6a | 1.5 | 1011 | 1 | 32 | 2.3a | 3 | C |
| Project size (m2) | Project | 5483 | 12 | 82541 | 1024 | 2580 | 1011 | 85 | 128992 | 1486 | 6775 | A, B |
| Centrality | Building | 46,842 | 0.04 | 0.97 | 0.72 | 0.15 | 13,686 | 0.14 | 0.97 | 0.79 | 0.14 | D |
[i] Note: aMean.
BCP = building change pressure; FSI = floor space index.
Sources: A = Eidg. Gebäude- und Wohnungsregister 2024 © Bundesamt für Statistik; B = Grundeigentumskategorien 2024 © Grundbuchämter des Kantons Bern; Amt für Geoinformation des Kantons Bern; C = Digitale Parzellennummern des Kantons Bern 2003 © Amt für Geoinformation des Kantons Bern; D = © Openrouteservice.
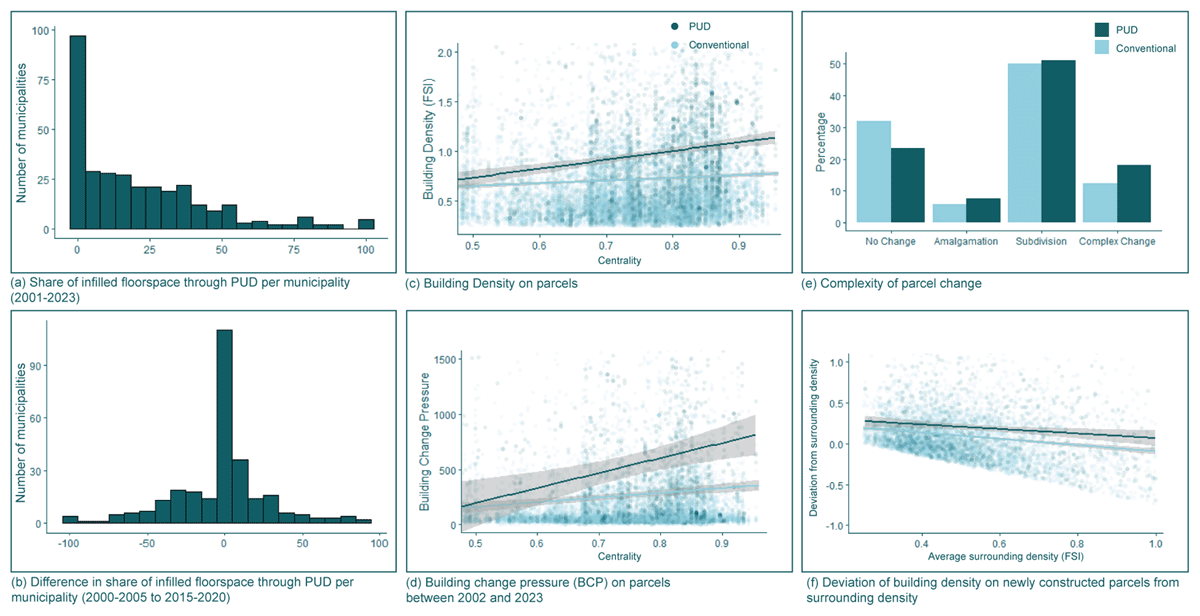
Figure 4
Variation in planned unit development (PUD) application.
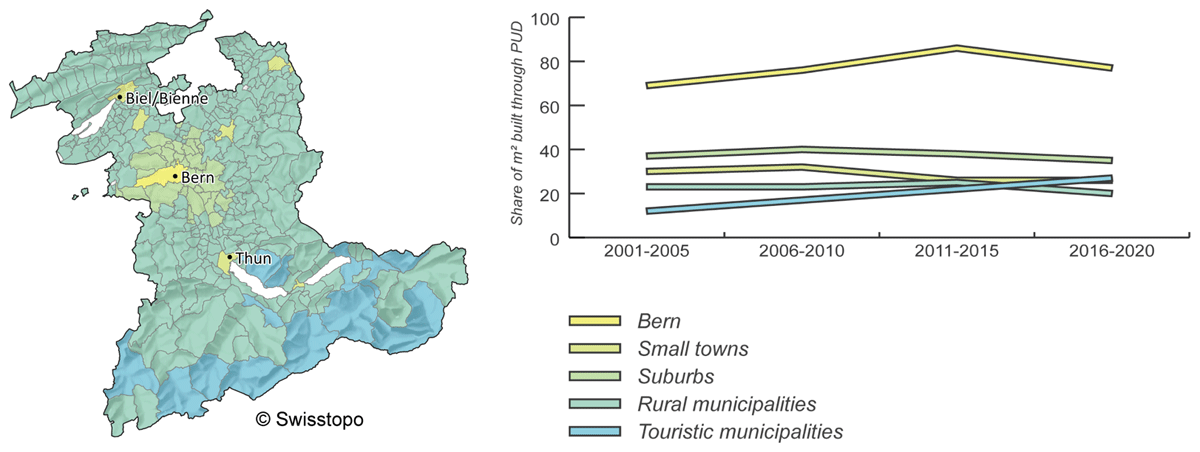
Figure 5
Share of building floorspace built through planned unit development (PUD) by municipality type and period (densification only, including non-residential use).
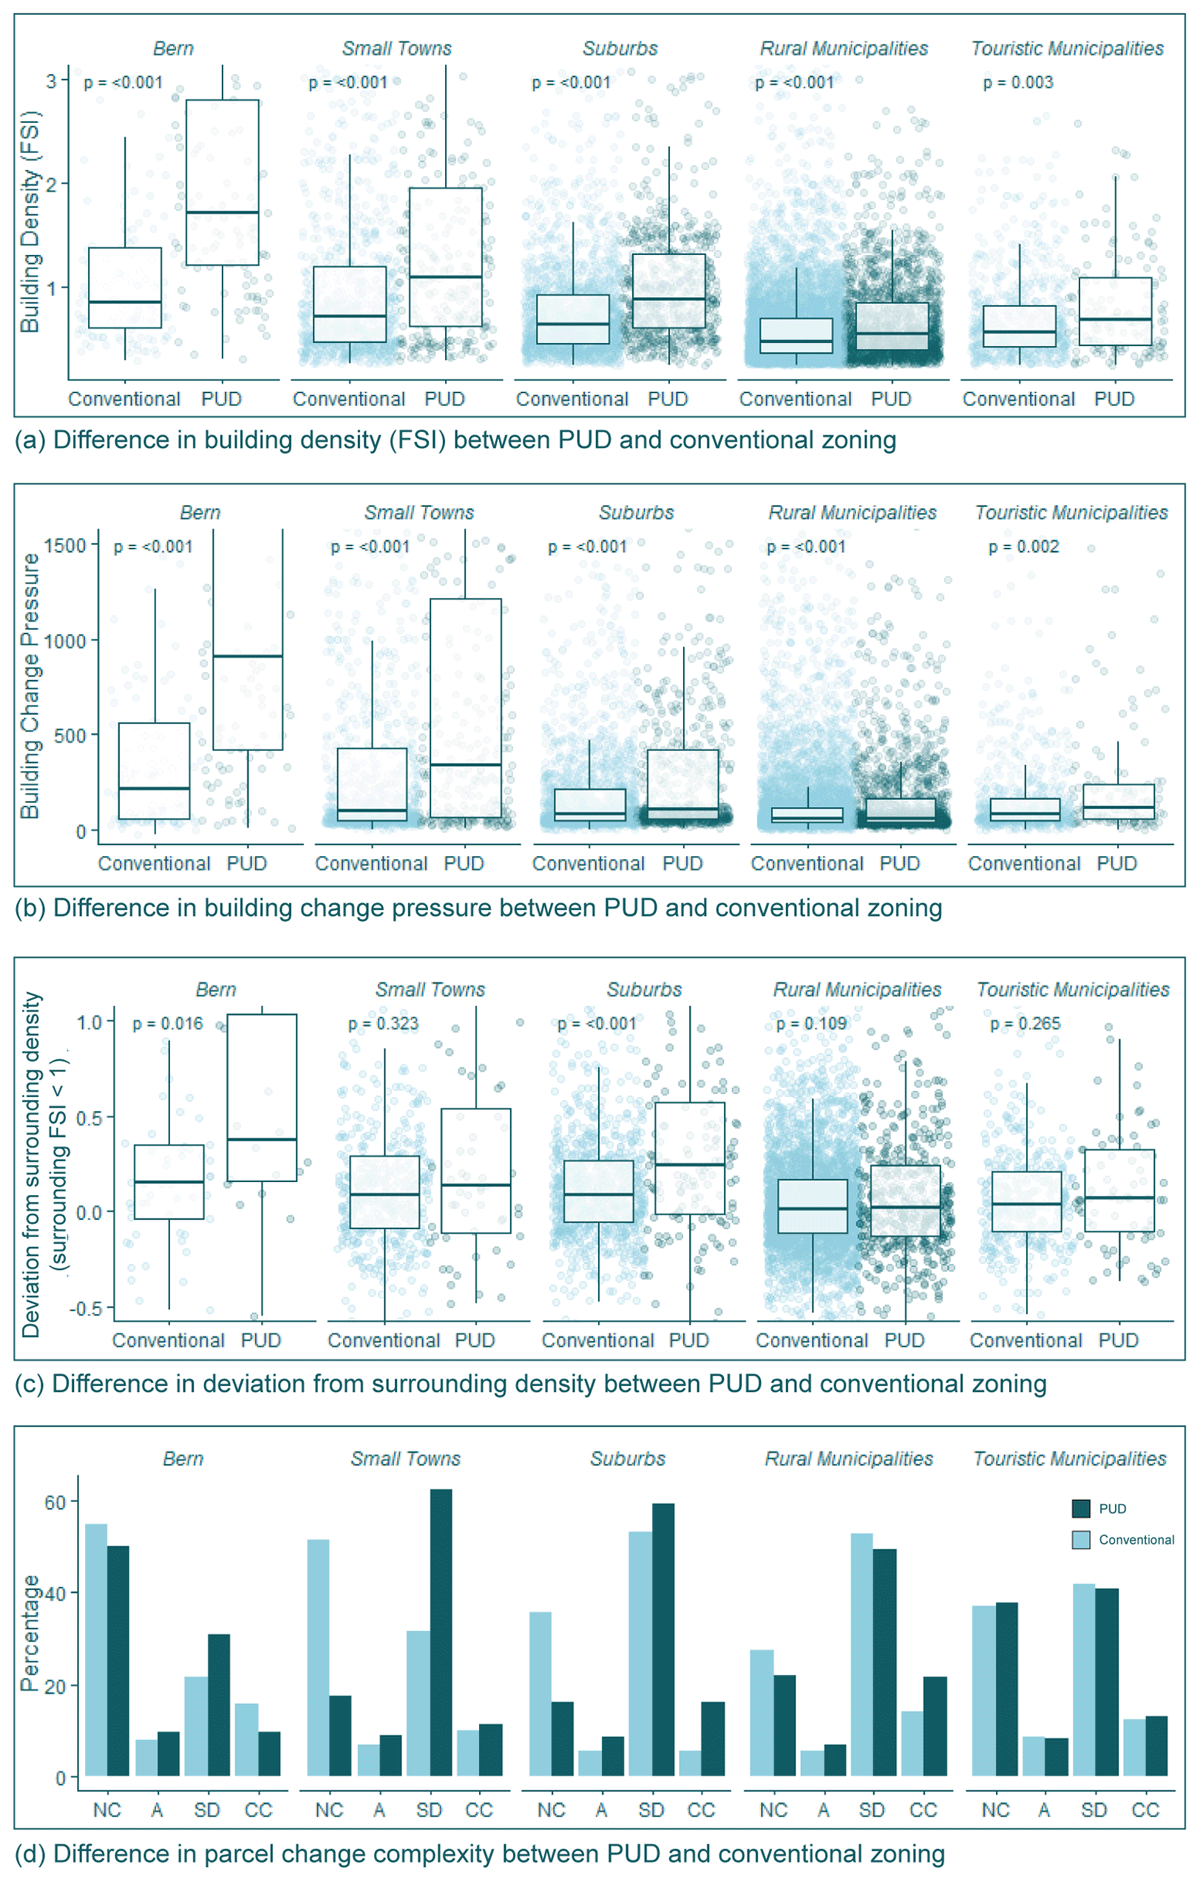
Figure 6
Building density and project complexity across municipality types.