
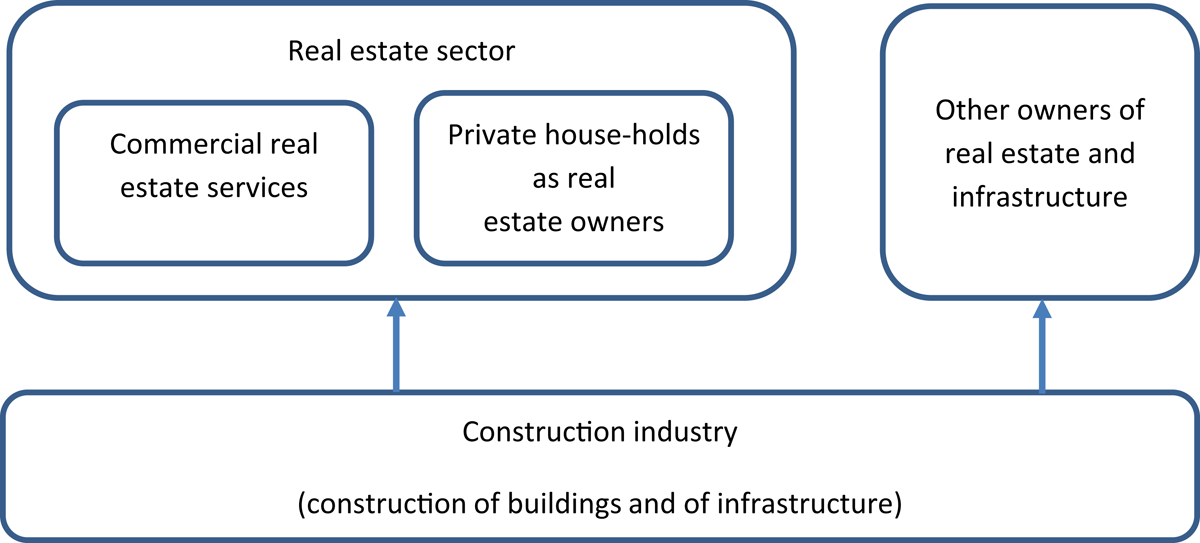
Figure 1
Relationship between the construction industry and the real estate sector. Source: Adapted from Nathani et al. (2019).
Table 1
Elements of the adapted environmentally extended multiregional input–output table (EE-MRIOT) approach (Nathani et al. 2019).
| Results | |||
|---|---|---|---|
| Output and value added | Imports into Switzerland | Greenhouse gas emissions | |
| Real estate sector | Swiss EE-IOT | Swiss EE-IOT | |
| Domestic suppliers | Swiss EE-IOT | Swiss EE-IOT | |
| Imports into Switzerland (by country of origin) | Swiss EE-IOT, Swiss and OECD trade statistics | – | |
| Suppliers in foreign countries | EE-MRIOT | EE-MRIOT | |
Table 2
Yearly emission budgets, global emissions in 2008 and the necessary reduction at the global level for each environmental indicator analysed.
| Environmental indicator | Unit | Limit for the global footprint (reference year) | Current global environmental footprint, 2008 | Necessary reduction (global level) (%) | Source |
|---|---|---|---|---|---|
| GHG footprint | Mt CO2e/year | 12,300a | 50,800 | 76% | Dao et al. (2015) |
| Biodiversity footprint | 10–6 PDF*year/year | 15,000 | 88,901 | 83% | Steffen et al. (2015); Frischknecht et al. (2018a) |
| Eutrophication footprint | Mt N/year | 47.6 | 55.6 | 14% | Dao et al. (2015) |
| Air pollution footprint | Mt PM10-eq/year | 65.3 | 106.3 | 39% | Frischknecht & Büsser Knöpfel (2013) |
[i] Notes: a Intermediate limit; net-zero emissions (100% reduction) required to stay within a 1.5°C temperature increase.
GHG = greenhouse gas; N = nitrogen; PDF = potentially disappeared fraction (of species); PM = particulate matter.
Table 3
Necessary reduction at the global and Swiss levels for each environmental indicator analysed.
| Environmental indicator | Unit | Necessary reduction (global level) (%) | Necessary reduction (Swiss level) (%) | Source |
|---|---|---|---|---|
| GHG footprint | Mt CO2e/year | 76% | 80% | Global: Dao et al. (2015); Swiss: Frischknecht & Büsser Knöpfel (2013) |
| Biodiversity footprint | 10–6 PDF*year/year | 83% | Steffen et al. (2015); Frischknecht et al. (2018a) | |
| Eutrophication footprint | Mt N/year | 14% | 34% | Global: Dao et al. (2015); Swiss: Frischknecht & Büsser Knöpfel (2013) |
| Air pollution footprint | Mt PM10-eq/year | 39% | Frischknecht & Büsser Knöpfel (2013) |
[i] Note: GHG = greenhouse gas; N = nitrogen; PDF = potentially disappeared fraction (of species); PM = particulate matter.
Table 4
Environmental footprints caused by the Swiss real estate sector, 2008.
| Indicator | Unit | In absolute terms | … of which in the use stage | … of which in production | Per gross output (only production) (CHF millions) | Per gross value added (only production) (CHF millions) |
|---|---|---|---|---|---|---|
| GHG footprint | kt CO2e | 24,286 | 16,569 | 7716 | 0.11 | 0.15 |
| Biodiversity footprint | nano PDF*year | 6631 | 879 | 5753 | 0.08 | 0.11 |
| Water footprint | million m3 | 3707 | 1884 | 1823 | 0.03 | 0.04 |
| Air pollution footprint | t PM10-eq | 28,254 | 13,756 | 14,499 | 0.20 | 0.29 |
| Eutrophication footprint | t N-eq | 7173 | 925 | 6249 | 0.09 | 0.12 |
| Gross output (industry itself) | CHF (millions) | 70,412 | ||||
| Gross value added (industry itself) | CHF (millions) | 50,064 |
[i] Source: Nathani et al. (2019).
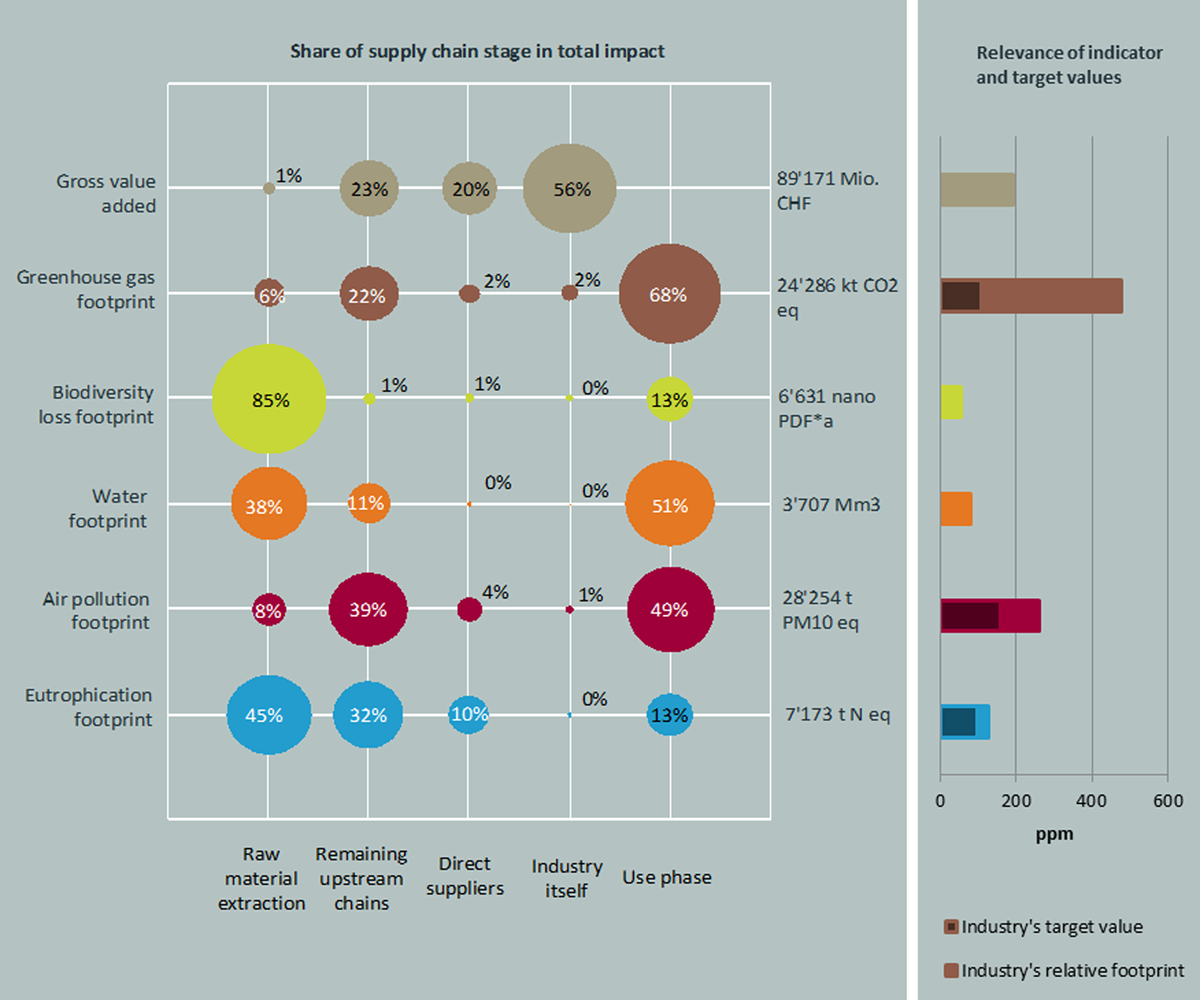
Figure 2
Environmental footprints caused by the Swiss real estate sector in 2008 by supply chain stages, share of the industry in global gross production value and global environmental footprints, as well as the reduction necessary to comply with the planetary boundaries. The greenhouse gas (GHG) footprint target is an intermediate value; the final target value is net zero. The length of the bars on the right-hand side shows the share of the environmental footprints, and for comparison the gross value added of the Swiss real estate sector on the global total environmental footprints and total global gross value added, expressed in parts per million (ppm), are shown. The bars on the right hand side represent the dimensionless score of each indicator after normalisation (according to ISO 2006), dividing the environmental footprint of the sector by the global environmental footprint. Source: Nathani et al. (2019).
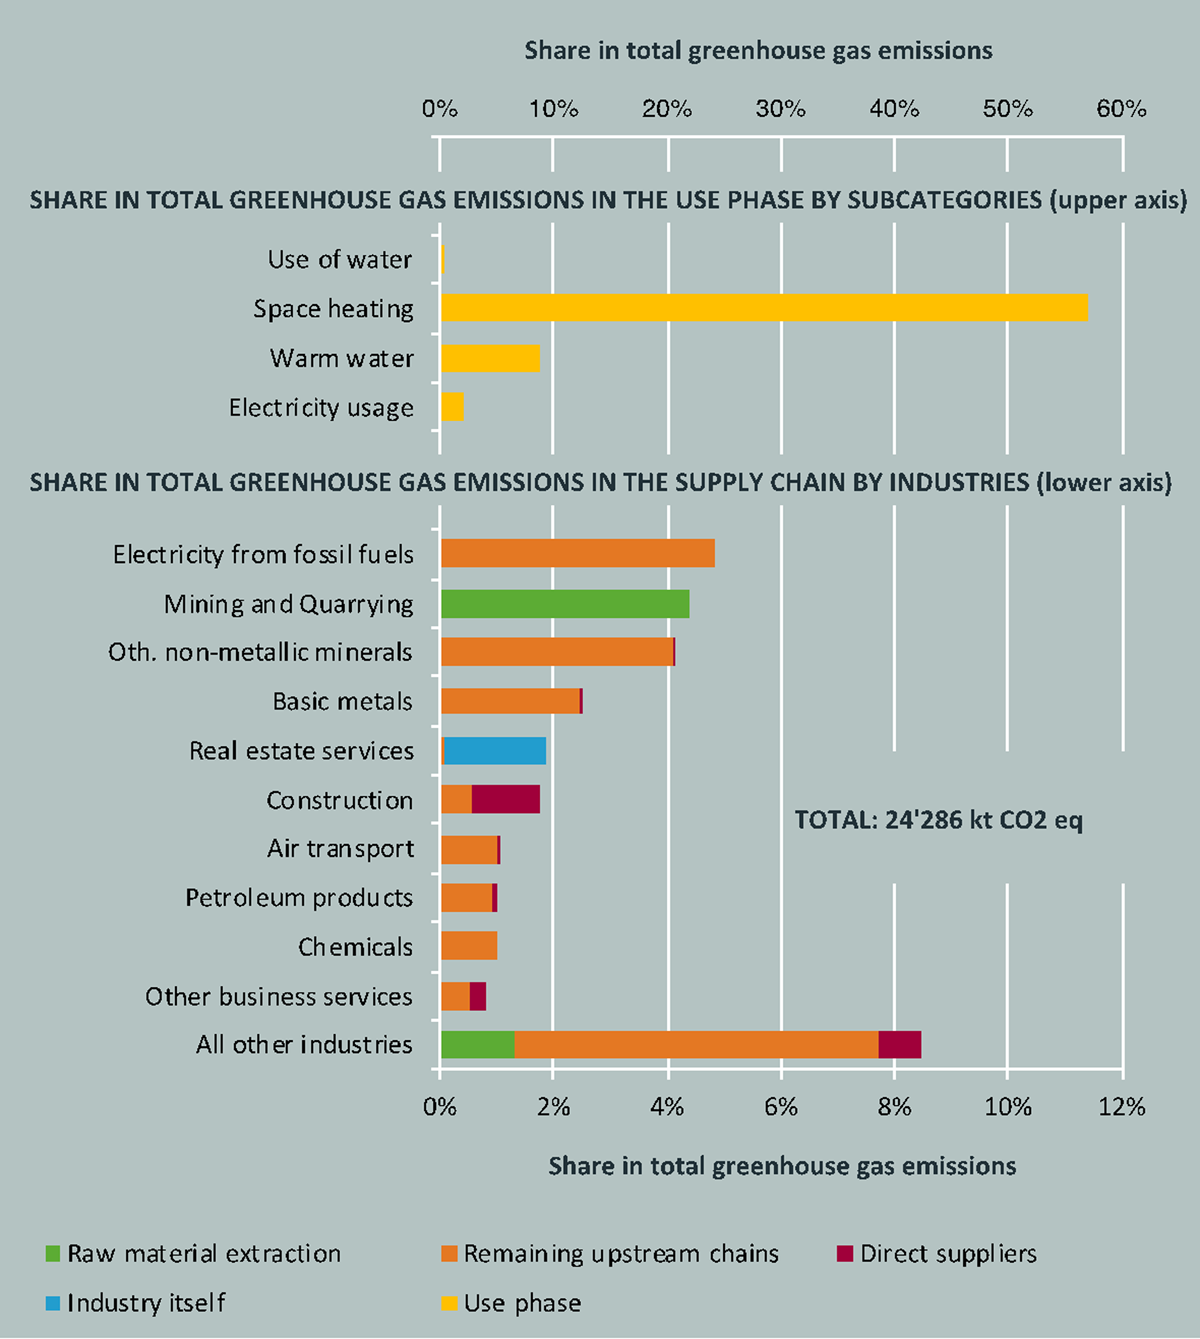
Figure 3
Greenhouse gas (GHG) footprint caused by the real estate sector in 2008 by supply chain stage and supplying industries. Source: Nathani et al. (2019).
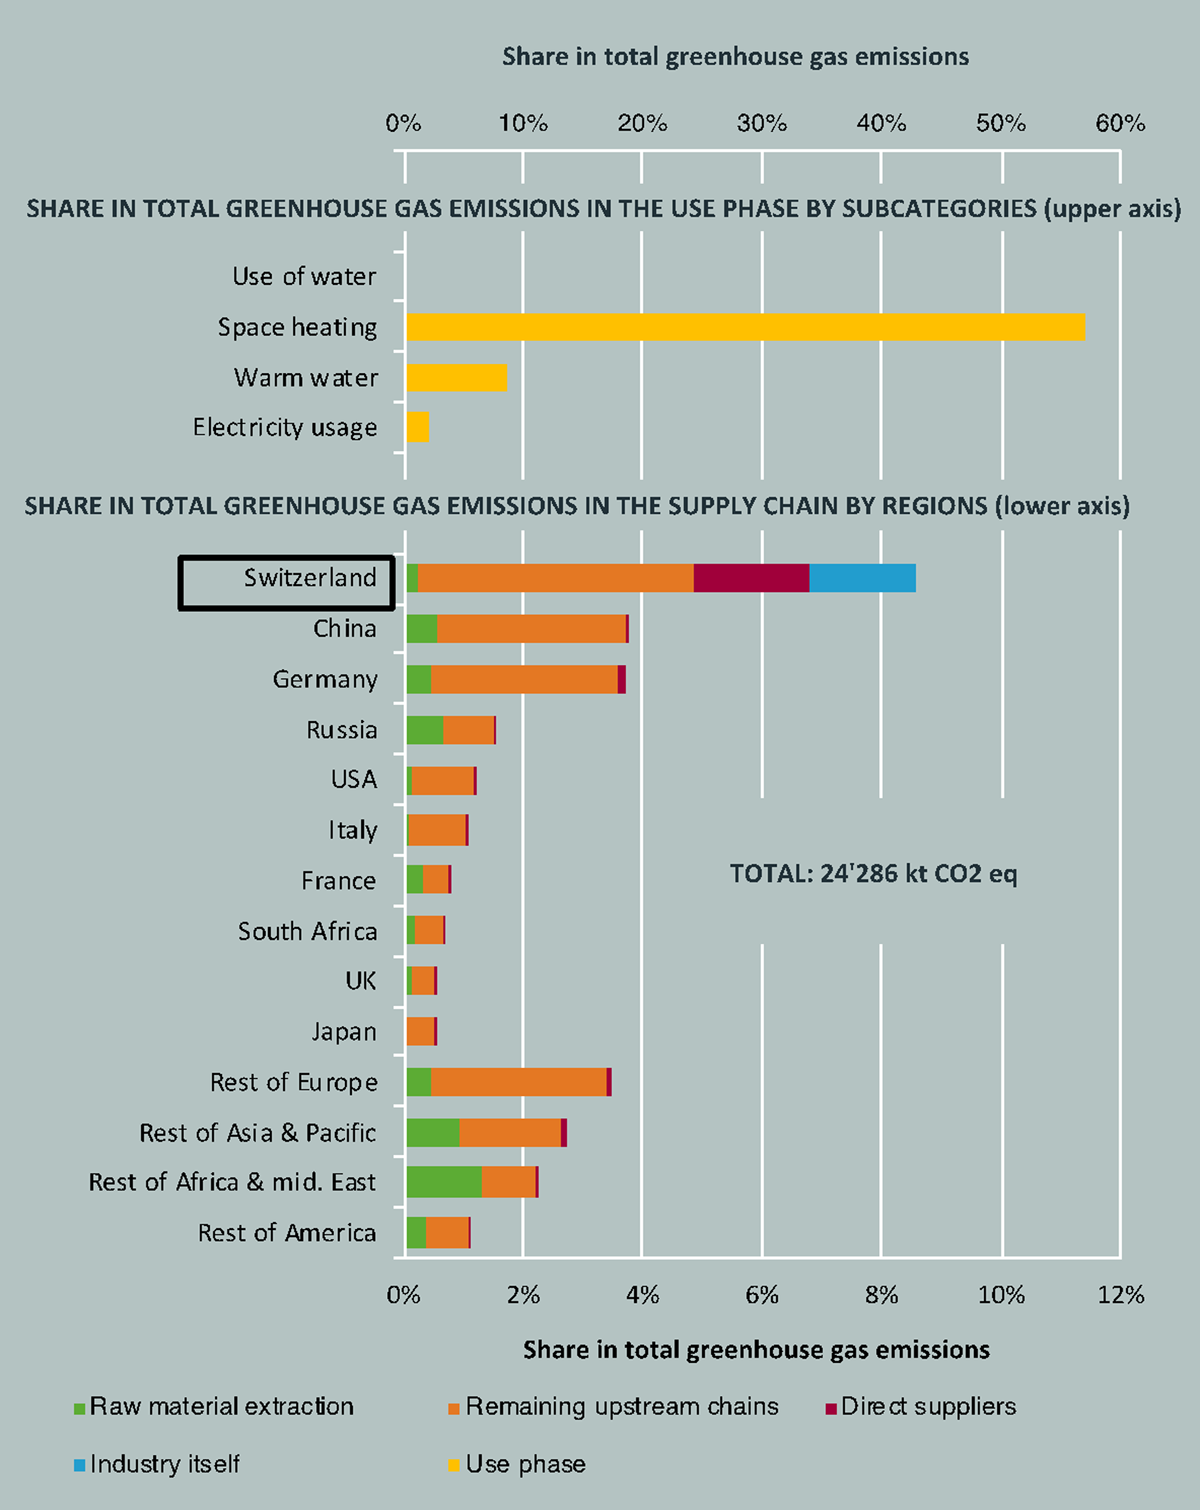
Figure 4
Greenhouse gas (GHG) footprint caused by the Swiss real estate sector in 2008, differentiated by supply chain stage and source countries. Source: Nathani et al. (2019).
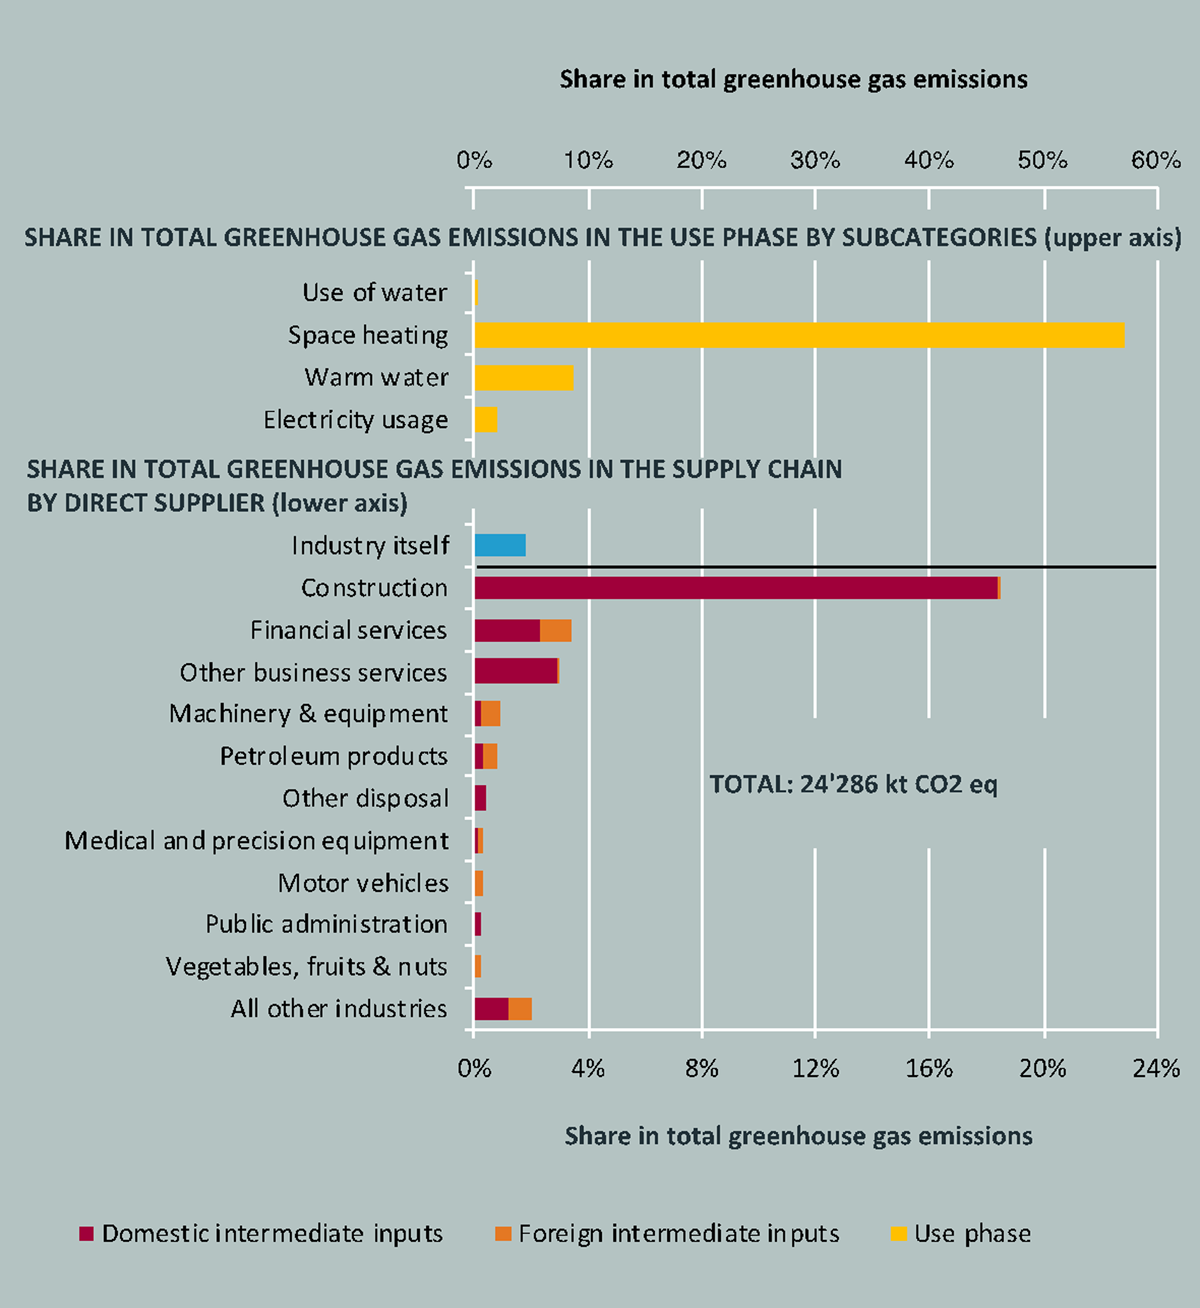
Figure 5
Greenhouse gas (GHG) footprint caused by the direct suppliers of intermediate goods and services for the Swiss real estate sector in 2008. Source: Nathani et al. (2019).