
Table 1
Research phases and participation.
| PHASE | GROUP | PERIOD |
|---|---|---|
| 1: Policy review | Expert group | September 2020 |
| 2: Identify the available data | Expert group | September 2020 |
| 3: Assessment of the indicators | Expert group | October 2020 |
| 4: Integration in the benchmark models | Expert group | November 2020 |
| 5: Selection of the benchmark model | Two directors groups and general board Aedes | January and April 2021 |
| 6: Data collection | Principal researcher | June–August 2021 |
| 7: Benchmark results | Principal researcher | September–December 2021 |
Table 2
Possible indicators to benchmark the energy performance of dwellings.
| POSSIBLE INDICATOR | UNIT | SOURCESa | DESCRIPTION |
|---|---|---|---|
| 1. Average theoretical primary fossil energy consumption | kWh/m2/yr | SHAERE | Energy label value after 2020 under the NTA 8800. Based on a theoretical energy consumption divided by floor area |
| 2. Average theoretical energy index | n | dVi | Energy label value up to 2020 |
| 3. Average number of label steps in the energy label | n | SHAERE | Average number of energy label steps after 2020 under the NTA 8800 |
| 4. Average theoretical heating demand | kWh/m2/yr | SHAERE | Theoretical unit of measurement of the heating demand of dwellings |
| 5. Average difference heating demand and maximum heating demand | kWh/m2/yr | SHAERE | Average difference between the heating demand of dwellings (quality building envelope) and the maximum heating demand based on the layout and topology |
| 6. Percentage dwellings complying with the maximum heating demand | % | SHAERE | Percentage of dwellings below the maximum heating demand of the dwelling based on its layout and topology |
| 7. Percentage of dwellings that are gas-free | % | SHAERE | Percentage of dwellings without a gas-fired heating system |
| 8. Percentage of dwellings with photovoltaic panels | % | SHAERE | Percentage of dwellings with photovoltaic (PV) panels, and therewith contributing to the production of clean electricity |
| 9. Indicator mix of building characteristics | Undefined | SHAERE | Undefined combination of building characteristics; however, not yet operationalised |
| 10. Average actual energy consumption (gas + electricity and district heating) | kWh/m2/yr | CBS | Combined average actual energy consumption on a dwelling level per m2 of the three main energy carriers in the Netherlands: gas, electricity and district heating |
| 11. Average actual CO2 emission (gas + electricity and district heating) | kgCO2/m2/yr | CBS | Combined average actual CO2 emissions on a dwelling level per m2 of the three main energy carriers in the Netherlands: gas, electricity and district heating |
| 12. Average actual CO2 emission (gas) | kgCO2/m2/yr | CBS | Average actual CO2 emissions on a dwelling level per m2 of gas consumption. CO2 emission within the building |
[i] Note: Indicators are listed without any order of preference.
Table 3
Assessment of indicators with a scoring table.
| WEIGHTING FACTOR ASSESSMENT CRITERIA: | 1 | 1 | 1 | 2 | 2 | |||
|---|---|---|---|---|---|---|---|---|
| INDICATOR NO. | INDICATOR DESCRIPTION | AVAILABILITY | COMPARABILITY | RECOGNISABILITY | NATIONAL POLICY | HOUSING ASSOCIATION POLICY | TOTAL | SELECTED FOR THE NEXT PHASE |
| Building indicator | ||||||||
| 1 | Average theoretical primary fossil energy consumption | 1 | 1 | 1 | 2 | 2 | 11 | × |
| 2 | Average theoretical energy index | –2 | –2 | 1 | –1 | 0 | –5 | |
| 3 | Average number of label steps in the energy label | 1 | 1 | 1 | –1 | –1 | –1 | |
| Insulation indicators | ||||||||
| 4 | Average theoretical heating demand | 1 | 0 | 1 | –1 | –1 | –2 | |
| 5 | Average difference between heating demand and maximum heating demand | 1 | 1 | 1 | 2 | 1 | 9 | × |
| 6 | Percentage of dwellings complying with the maximum heating demand | 1 | 1 | 1 | 1 | 1 | 7 | × |
| Installation indicators | ||||||||
| 7 | Percentage of dwellings gas-free | 1 | 2 | 2 | 1 | 1 | 9 | × |
| 8 | Percentage of dwellings with photovoltaic (PV) panels | 1 | 2 | 2 | 1 | 1 | 9 | × |
| 9 | Indicator mix of building characteristics | 1 | 0 | 0 | 0 | 0 | 1 | |
| Effect indicator | ||||||||
| 10 | Average actual energy consumption (gas plus electricity plus district heat) | –1 | 0 | 1 | 0 | 1 | 2 | |
| 11 | Average actual CO2 emissions (gas plus electricity plus district heat) | –1 | 0 | 1 | 1 | 2 | 6 | × |
| 12 | Average actual CO2 emissions (gas) | 0 | 0 | 1 | 2 | 1 | 7 | × |
Table 4
Schematisation of the four proposed benchmark models.
| INDICATOR NO. | INDICATOR DESCRIPTION | BASIC MODEL | REAL ESTATE MODEL | POLICY PERFORMANCE MODEL | WIDE MODEL |
|---|---|---|---|---|---|
| 1 | Average theoretical primary fossil energy consumption | × | × | × | × |
| 5 | Percentage of dwellings complying with maximum heating demand | × | / | ||
| 6 | Average difference heating demand and maximum heating demand | × | / | ||
| 7 | Percentage of dwellings gas-free | × | × | ||
| 8 | Percentage of dwellings with photovoltaic (PV) panels | × | × | ||
| 11 | Average actual CO2 emissions (gas + electricity + district heat) | × | |||
| 12 | Average actual CO2 emissions (gas) | × | × |
[i] Note: The symbol ‘/’ means that one of these two indicators should be chosen.
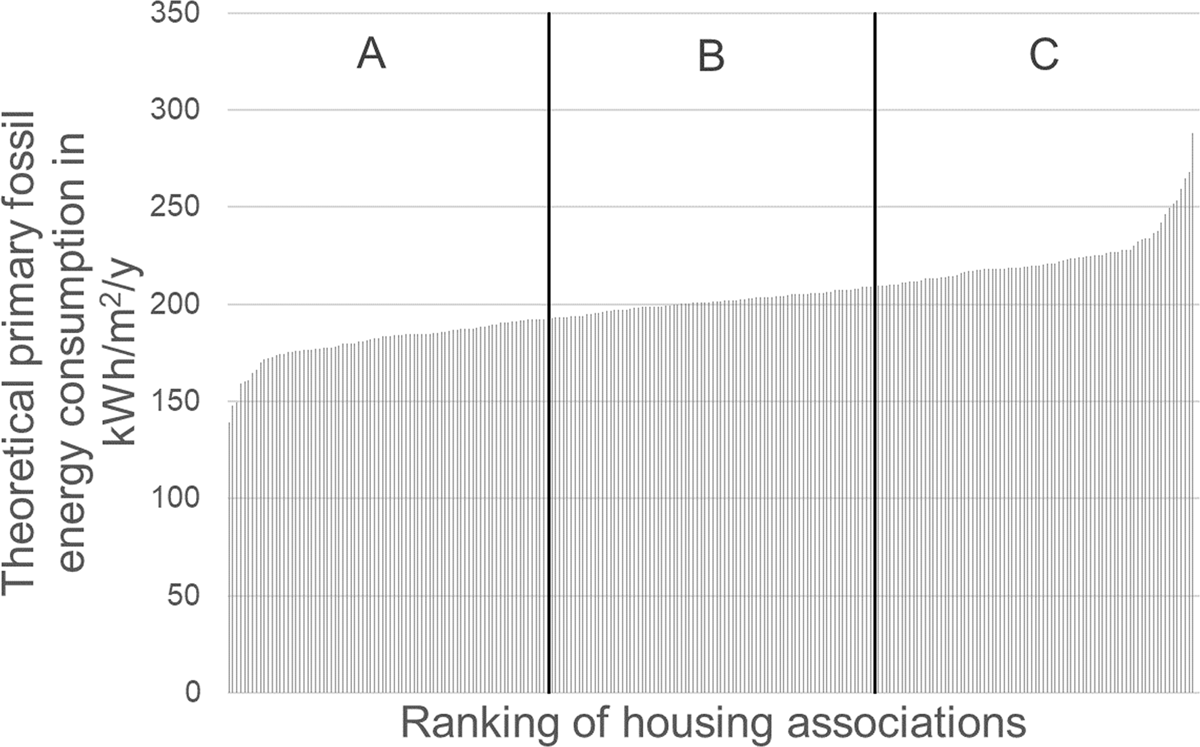
Figure 1
Housing associations ranked by the average theoretical primary fossil energy consumption.
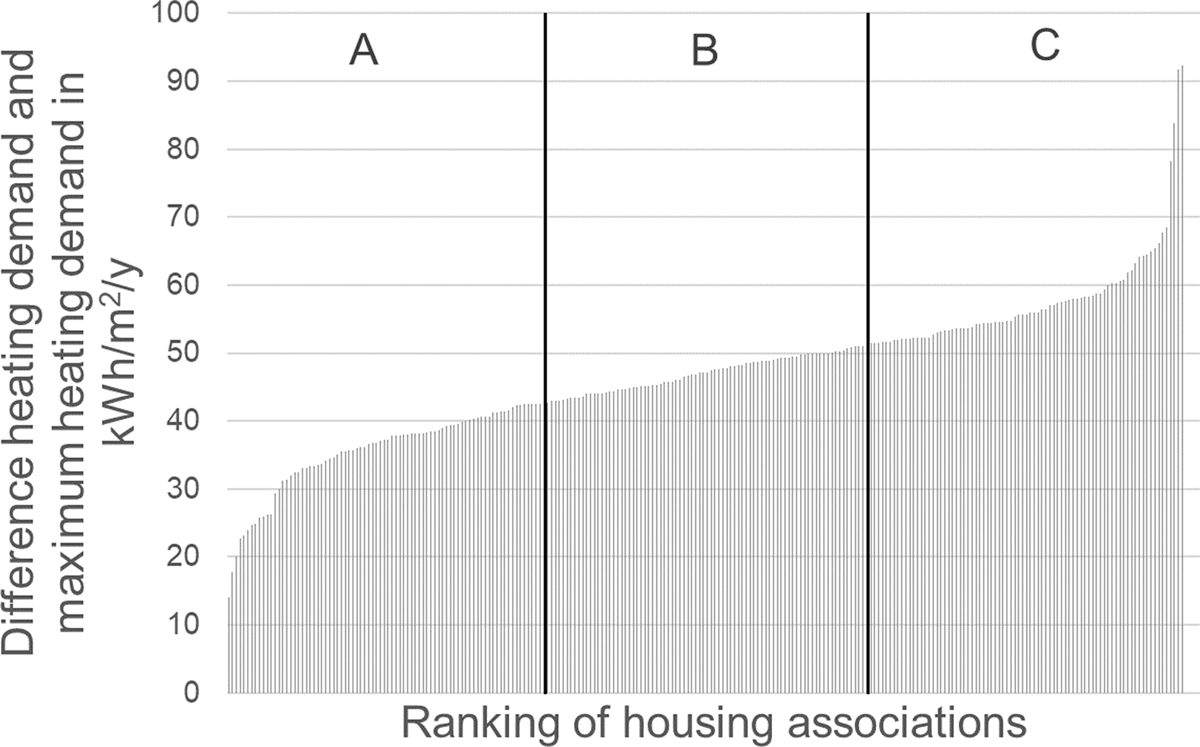
Figure 2
Housing associations ranked by the average difference between theoretical heating demand and maximum theoretical heating demand.
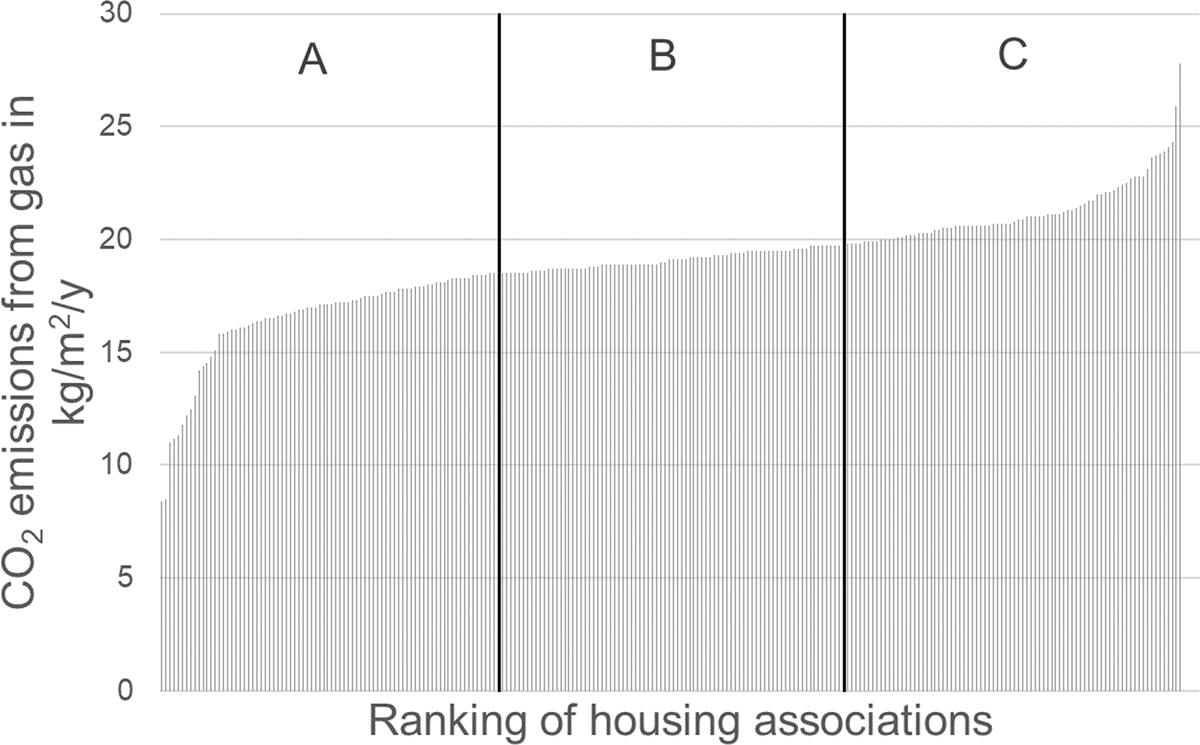
Figure 3
Housing associations ranked by the average actual CO2 emissions from gas.