
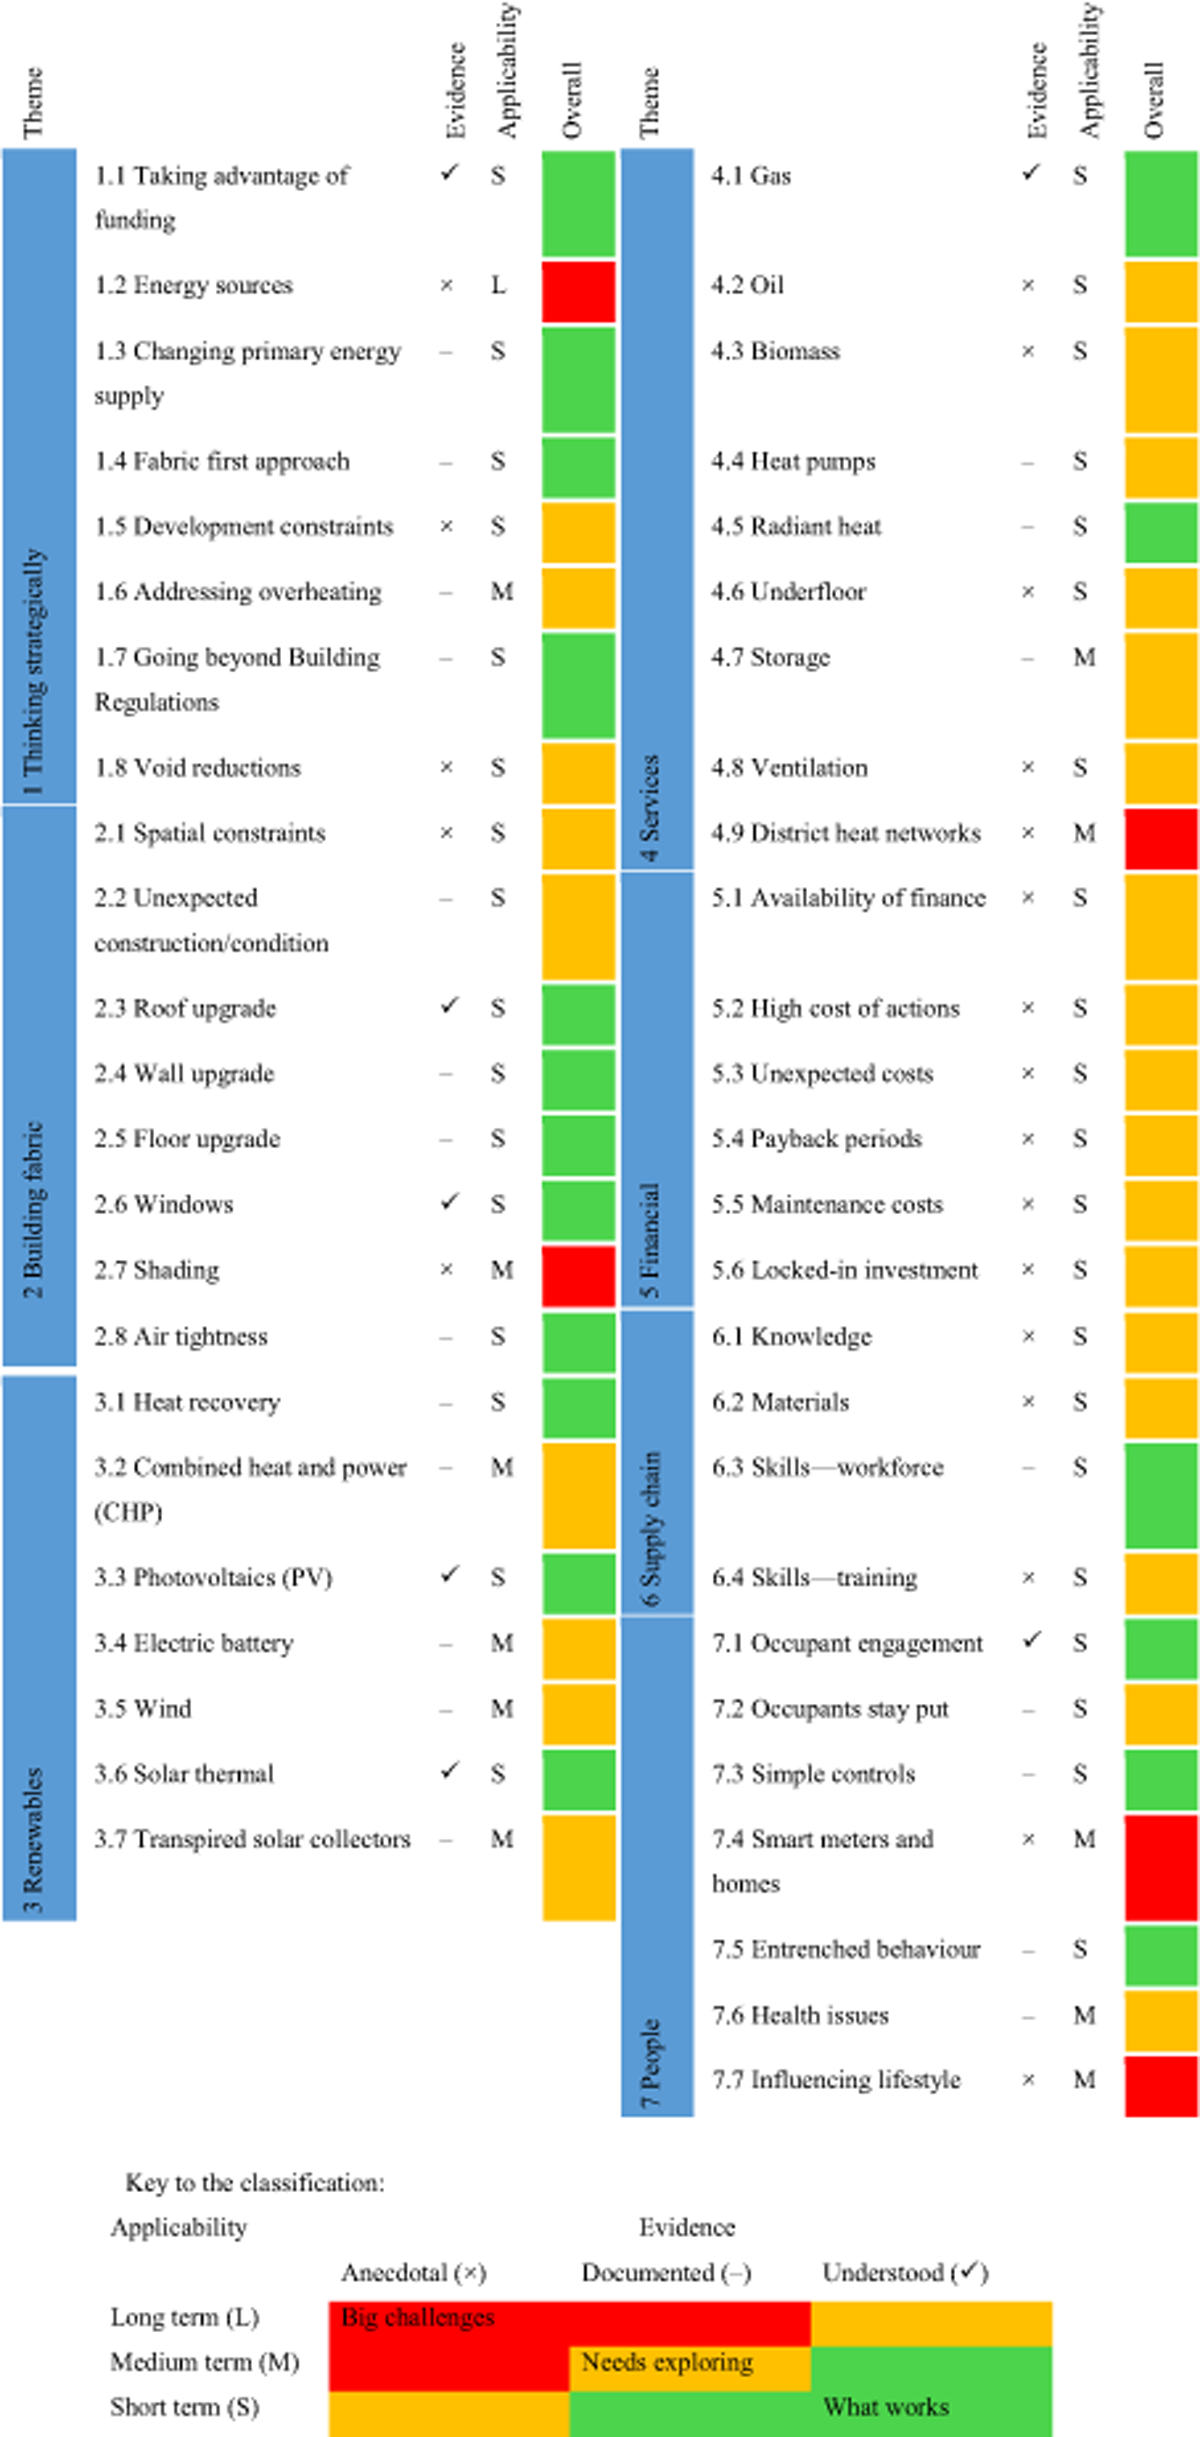
Table 1
Retrofit actions and challenges structured thematically and classified based on evidence and applicability, with links (see Stage 1 report) to case studies and literature.
Table 2
Fourteen archetypes collectively representing 84% of the Welsh housing stock.
| End terrace | Mid-terrace | Semi-detached | Detached | Flat | Total (%) | |
|---|---|---|---|---|---|---|
| Pre-1919 | Type 1, 3% | Type 2, 9% | Type 3, 4% | Type 4, 7% | 23% | |
| 1919–44 | Type 5, 5% | 5% | ||||
| 1945–64 | Type 6, 10% | 10% | ||||
| 1965–90 | Type 7, 4% | Type 8, 6% | Type 9, 10% | Type 10, 9% | Type 11, 4% | 33% |
| Post-1990 | Type 12, 5% | Type 13, 7% | Type 14, 1% | 13% | ||
| Total (%) | 7% | 15% | 34% | 23% | 5% | 84% |
Table 3
Four retrofit strategies developed from the Stage 1 review.
| Retrofit strategy | Action |
|---|---|
| Heritage | Actions are constrained, e.g. as a result of listed building status or location within a conservation area. The impact on the dwelling fabric is assumed to be restricted, requiring internal rather than external wall insulation, along with appropriate ventilation. No floor insulation is provided. Windows are secondary glazed rather than replaced. No roof-mounted renewables are provided. The wet (gas-fired) central heating system is retained (assumes mains gas supply to be available). Indicative SAP rating = 71 |
| Good practice | Actions are driven by best value—in terms of affordability, cost effectiveness, and availability of skills and resources in the current marketplace. Roof insulation is topped up. External wall insulation and replacement glazing are provided that meets current (refurbishment) UK Building Regulations. No floor insulation. Modest array of roof-mounted photovoltaic panels provided. Wet (gas-fired) central heating system is retained (assumes mains gas supply to be available). Indicative SAP rating = 88 |
| Best practice | Assumes an aspirational client or owner-occupier, likely to be more concerned with long-term quality than short-term cost. Environmental impact is a priority. Roof insulation is topped up. External wall insulation is provided that meets current (newbuild) UK Building Regulations. Triple glazing and floor insulation are also included. A generous array of roof-mounted photovoltaic panels is provided. Primary heat is whole house mechanical ventilation with heat recovery (MVHR) with an air-source heat pump, and electric immersion heater for hot water. Indicative SAP rating = 90 |
| Rural | Location is assumed to dictate off-grid energy solutions. The focus is on energy conservation and use of locally viable renewables. Roof insulation is topped up. External wall insulation and replacement glazing are provided that meet current (newbuild) UK Building Regulations. Floor insulation is included. A generous array of roof-mounted photovoltaic panels is provided, along with a direct solar hot water system. Primary heat is whole-house MVHR with an air-source heat pump (and electrical top up of hot water). Indicative SAP rating = 90 |
[i] Note: SAP = Standard Assessment Procedure.
Table 4
Specification for each retrofit strategy, developed from the Stage 1 review.
| Heritage | Good practice | Best practice | Rural | |
|---|---|---|---|---|
| Roof insulation (W/m2°C) | 0.16 | 0.16 | 0.16 | 0.16 |
| Wall insulation (internal) (W/m2°C) | 0.25 | |||
| Wall insulation (external) (W/m2°C) | 0.30 | 0.12 | 0.12 | |
| Floor insulation (W/m2°C) | 0.16 | 0.16 | ||
| New windows (W/m2°C) | 1.80 | 1.40 | 1.80 | |
| Secondary glazing (W/m2°C) | 2.40 | |||
| Renewables (photovoltaic) (kWp system) | – | 2.6 | 4 | 4 |
| Electric battery | For storage | |||
| Solar thermal hot water | 2 m2 | |||
| Primary heat source | New, A-rated gas combi boiler | New, A-rated gas combi boiler | MVHR with air-source heat pump | MVHR with air-source heat pump |
| Hot water | Via gas combi boiler | Via gas combi boiler | Electric immersion | Electric top up of solar hot water |
[i] Note: MVHR = mechanical ventilation with heat recovery.
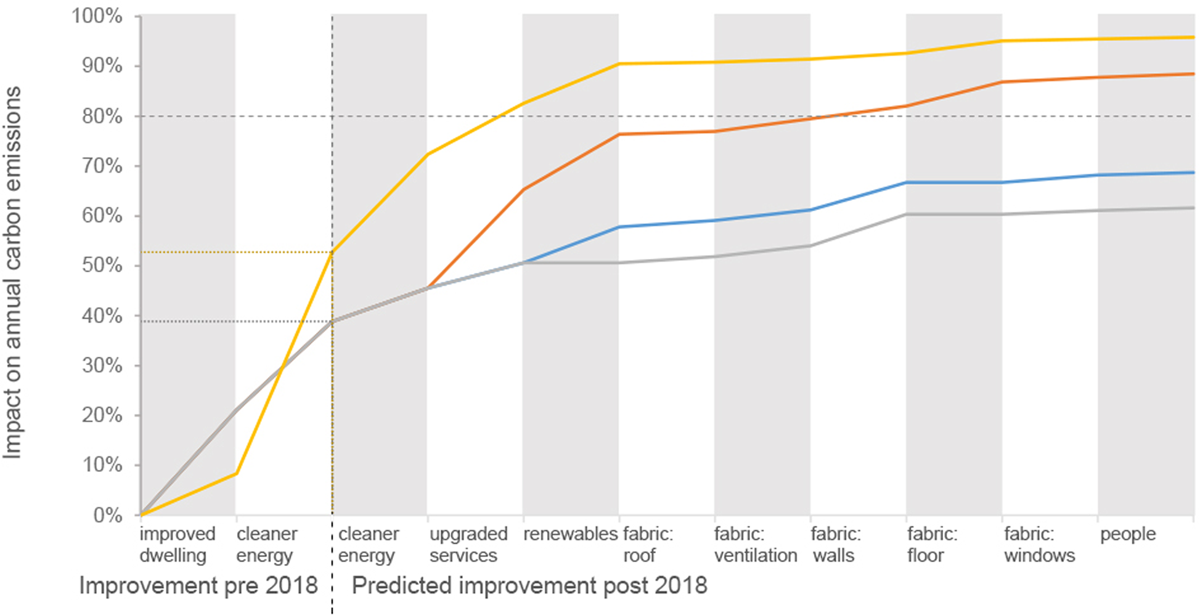
Figure 1
Impact of retrofit on greenhouse gas (GHG) emissions for archetype 2: pre-1919 mid-terraced property.
Note: yellow line = rural strategy, grey line = heritage strategy, red line = best practice strategy, blue line = good practice strategy.
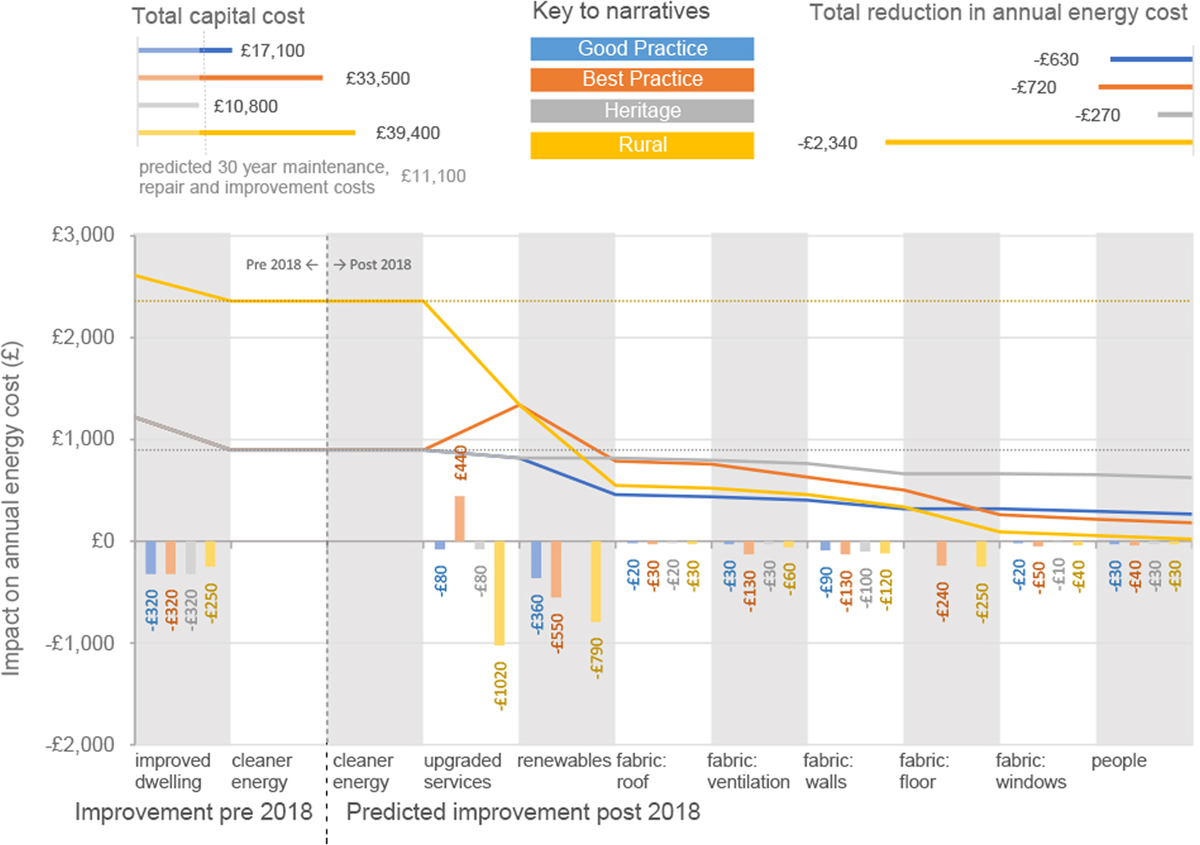
Figure 2
Impact of retrofit on annual energy costs for archetype 2: pre-1919 mid-terraced property. At top are the key to narratives and headline results (capital cost and energy costs).
Table 5
Emissions reductions achieved by all 14 dwelling archetypes (as a range) for four retrofit strategies and three energy supply scenarios.
| Retrofit strategy | Carbon reduction by energy supply scenario | ||
|---|---|---|---|
| Scenario 1: 40% clean energy | Scenario 2: 60% clean energy | Scenario 3: 80% clean energy | |
| Heritage | 58–66% | 78–83% | ≥100% |
| Good practice | 64–76% | 81–87% | ≥100% |
| Best practice | 83–89% | 92–95% | ≥100% |
| Rural | 86–96% | 93–98% | ≥100% |
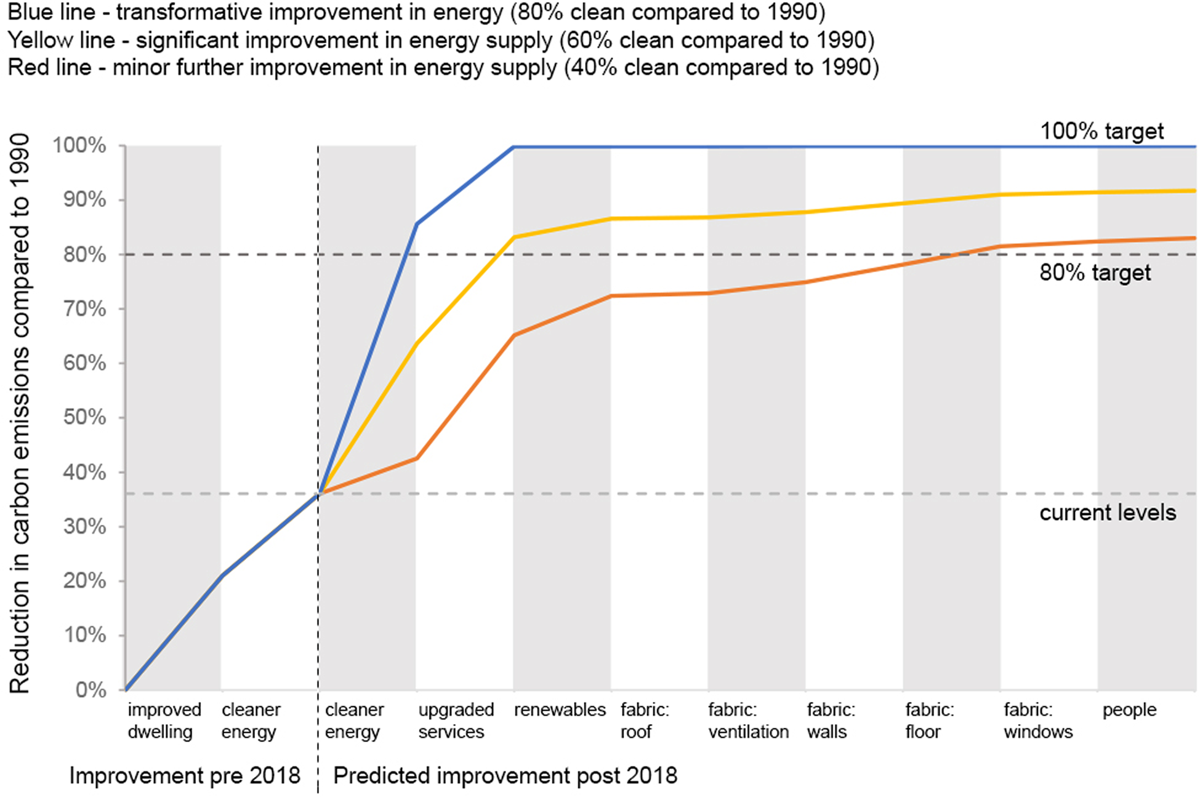
Figure 3
Simulated impact of retrofit on emissions, when adopted across the entire housing stock.
Table 6
Assumptions made regarding the adoption of retrofit strategies, by housing sector.
| Housing sector | % of stock | Strategy | Standard Assessment Procedure (SAP) equivalent |
|---|---|---|---|
| Older ‘historic’ homes | 15% | Heritage | 71 |
| Off-grid homes | 10% | Rural | 90 |
| Social housing plus private rented sector | 30% | Best practice | 90 |
| Fuel-poor households | 15% | Best practice | 90 |
| Remainder (owner occupied) | 30% | Best practice | 90 |