
Table 1
Victorian Energy Upgrade (VEU) programme categories and associated activities.
| Category (abbreviation) | Activity type |
|---|---|
| Water Heating (WH) | Replacement of an electric water heating system with more efficient systems, e.g. gas/liquefied petroleum gas (LPG) storage or gas/LPG instantaneous or electric-boosted solar or gas/LPG-boosted solar systems; solar retrofit kit for existing water heating system |
| Space Heating & Cooling (SHC) | High-efficiency ducted gas heating system replacing an inefficient gas-ducted heating system or a central electric heater; installation of ducted air heat pump, replacement of refrigerative air-conditioner with ducted evaporative cooler; gas ductwork replacement |
| Space Conditioning (SC) | Ceiling and underfloor insulation; window replacements or retrofits; draught proofing |
| Shower Rose (SR) | Replacement with a water-efficient shower rose |
| Refrigerator or Freezer (Fr) | Decommissioning of an inefficient and purchase of an efficient refrigerator or freezer |
| Lighting Replacement (Light) | Replacement of inefficient light bulbs with more efficient ones |
| Television (TV) | Installation of a highly efficient television |
| Clothes Dryer (CD) | Installation of a highly efficient clothes dryer |
| Pool Pumps (PP) | Installation of a highly efficient pool pump |
| SPCs (SPC) | Installation of stand-by power controllers |
| IHDs (IHD) | Installation of in-home display units |
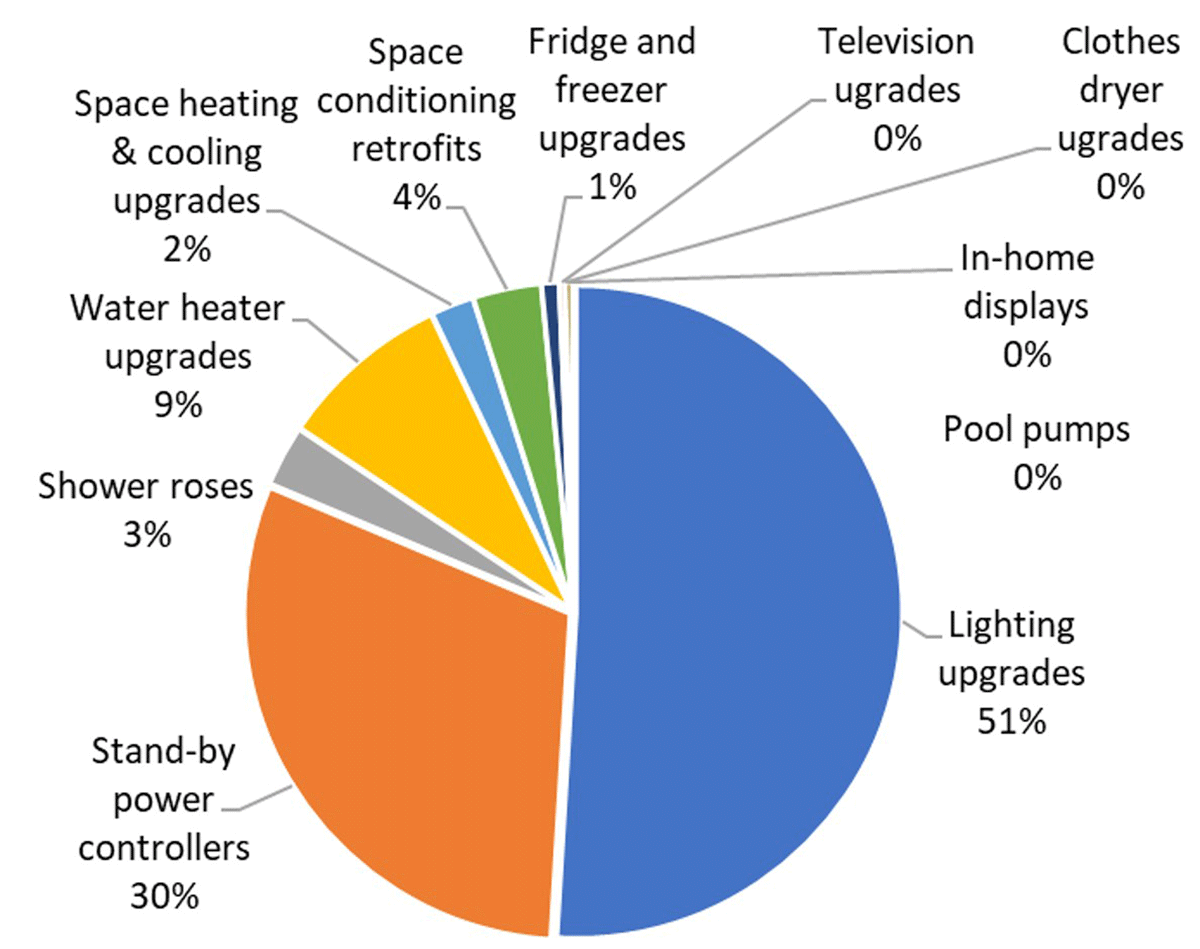
Figure 1
Distribution of Victorian Energy Efficiency Certificates (VEECs) by categories of activities.
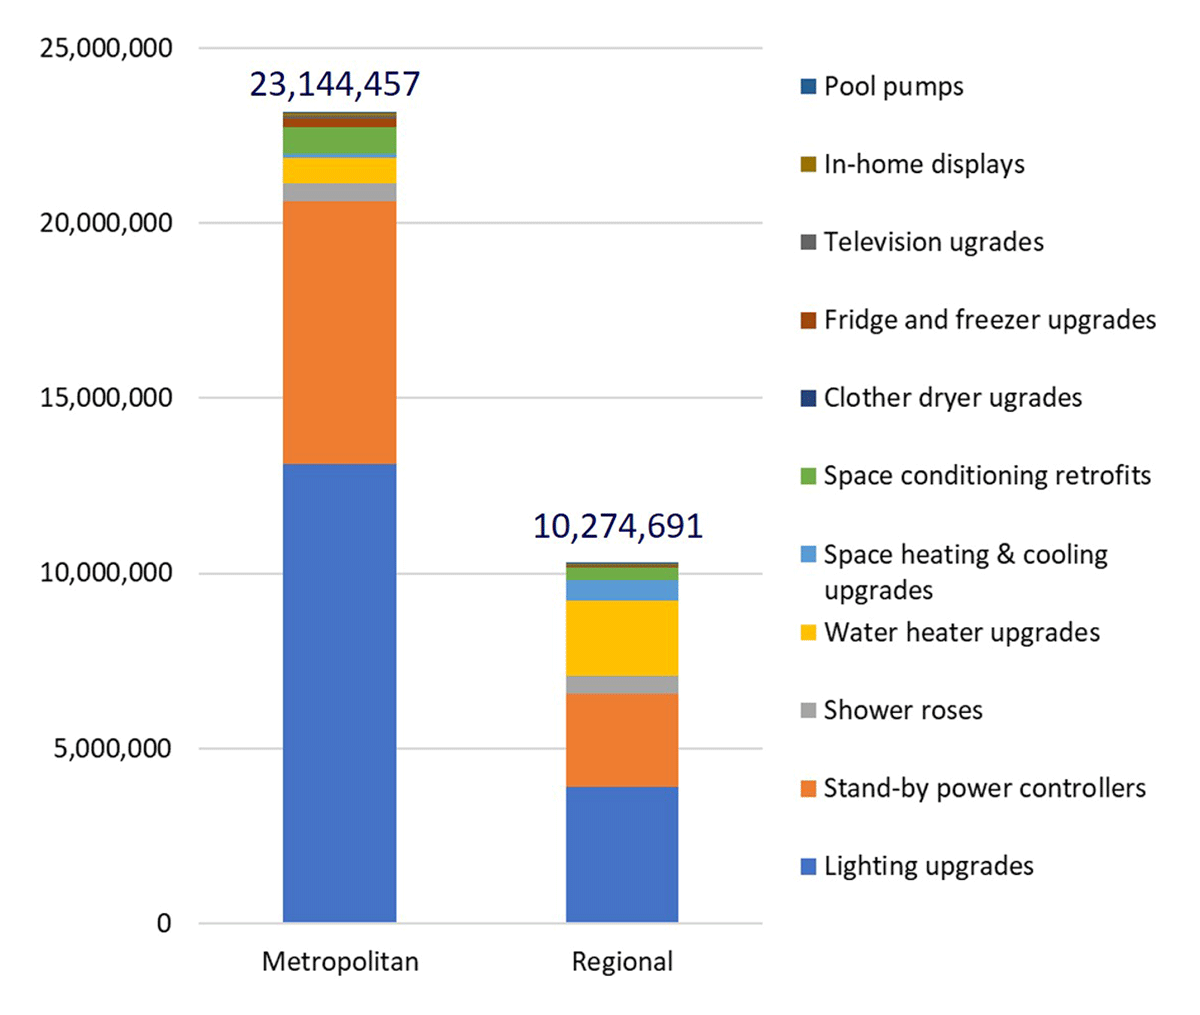
Figure 2
Comparison of the number of Victorian Energy Efficiency Certificates (VEECs) generated in metropolitan and regional areas.
Table 2
Descriptive statistics for Victorian Energy Efficiency Certificate (VEEC) generation: total number of VEECs.
| Variable | N | Mean | SD | Minimum | Maximum |
|---|---|---|---|---|---|
| All postcode areas | 689 | 48,503.84 | 70,746.93 | 4 | 555,326 |
| Metropolitan areas | 275 | 84,161.66 | 86,644.53 | 4 | 555,326 |
| Regional areas | 414 | 24,818.09 | 44,138.73 | 23 | 360,964 |
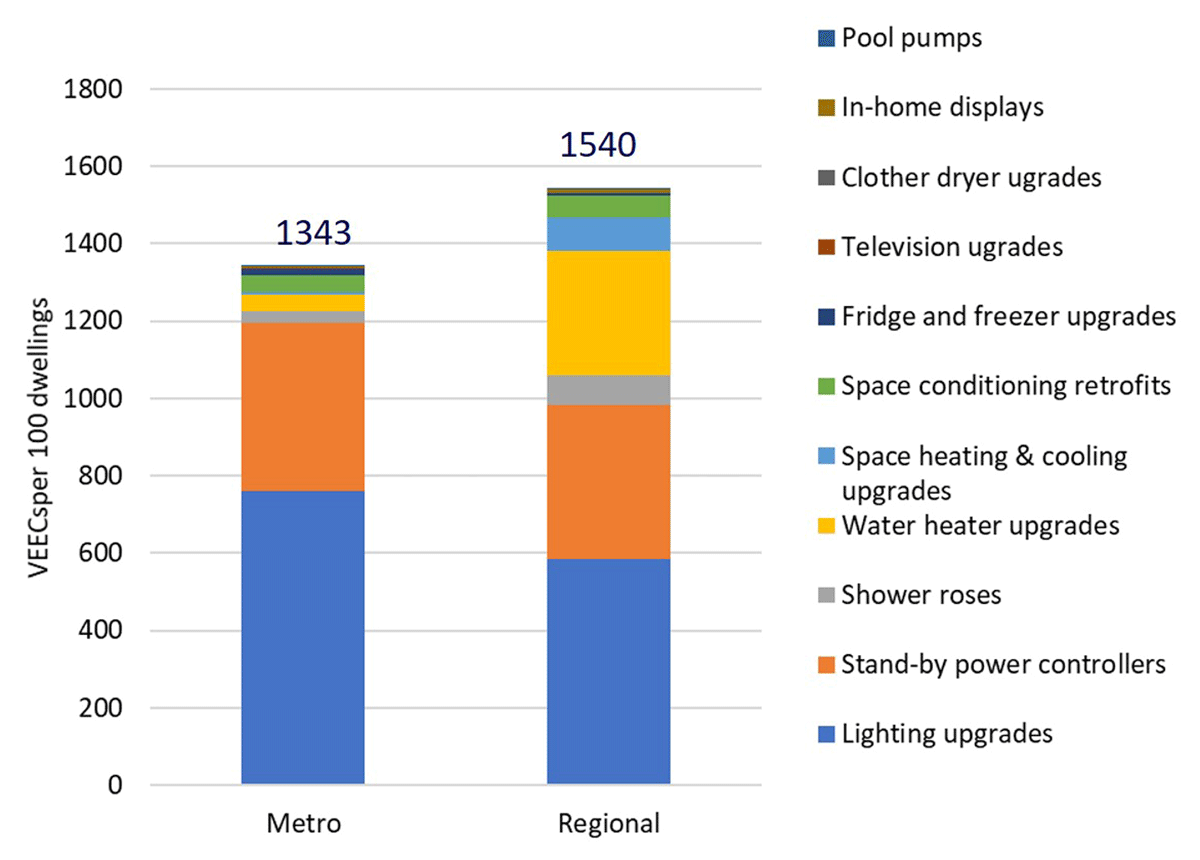
Figure 3
Comparison of Victorian Energy Efficiency Certificate (VEEC) generation intensity by categories in each location.
Table 3
Descriptive statistics for dwelling numbers and Victorian Energy Efficiency Certificate (VEEC) generation intensity.
| Variable | N | Mean | SD | Minimum | Maximum |
|---|---|---|---|---|---|
| Number of occupied and unoccupied private dwellings | |||||
| All postcode areas | 689 | 3468.86 | 4787.51 | 9 | 34,581 |
| Metropolitan areas | 275 | 6265.35 | 5600.43 | 12 | 34,581 |
| Regional areas | 414 | 1611.29 | 2950.79 | 9 | 25,403 |
| Total number of VEECs per 100 dwellings | |||||
| All postcode areas | 689 | 1505.92 | 489.59 | 4 | 3545 |
| Metropolitan areas | 275 | 1370.80 | 462.21 | 4 | 2630 |
| Regional areas | 414 | 1595.68 | 487.18 | 22 | 3545 |
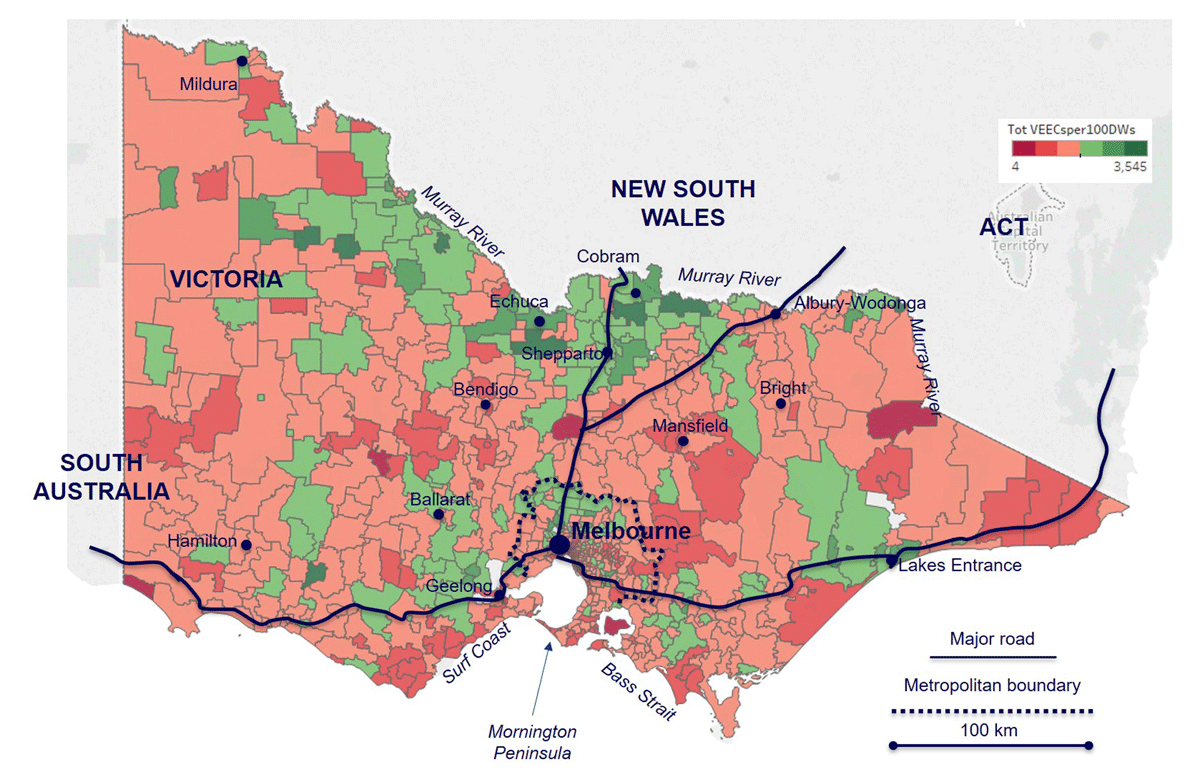
Figure 4
Spatial mapping of Victorian Energy Efficiency Certificate (VEEC) generation intensity per dwelling. Also shown are the major state highways and main towns.
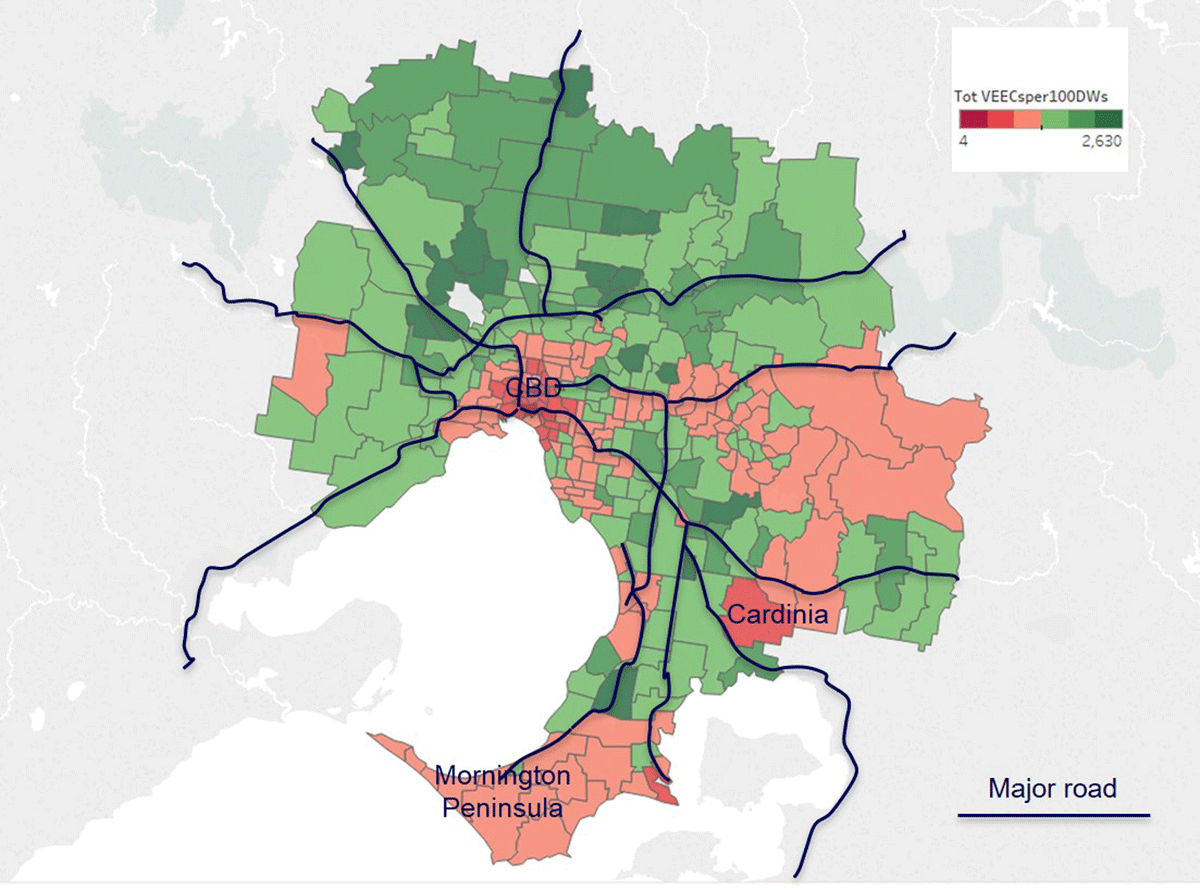
Figure 5
Spatial mapping of Victorian Energy Efficiency Certificate (VEEC) generation intensity per dwelling: all metropolitan postcode areas.
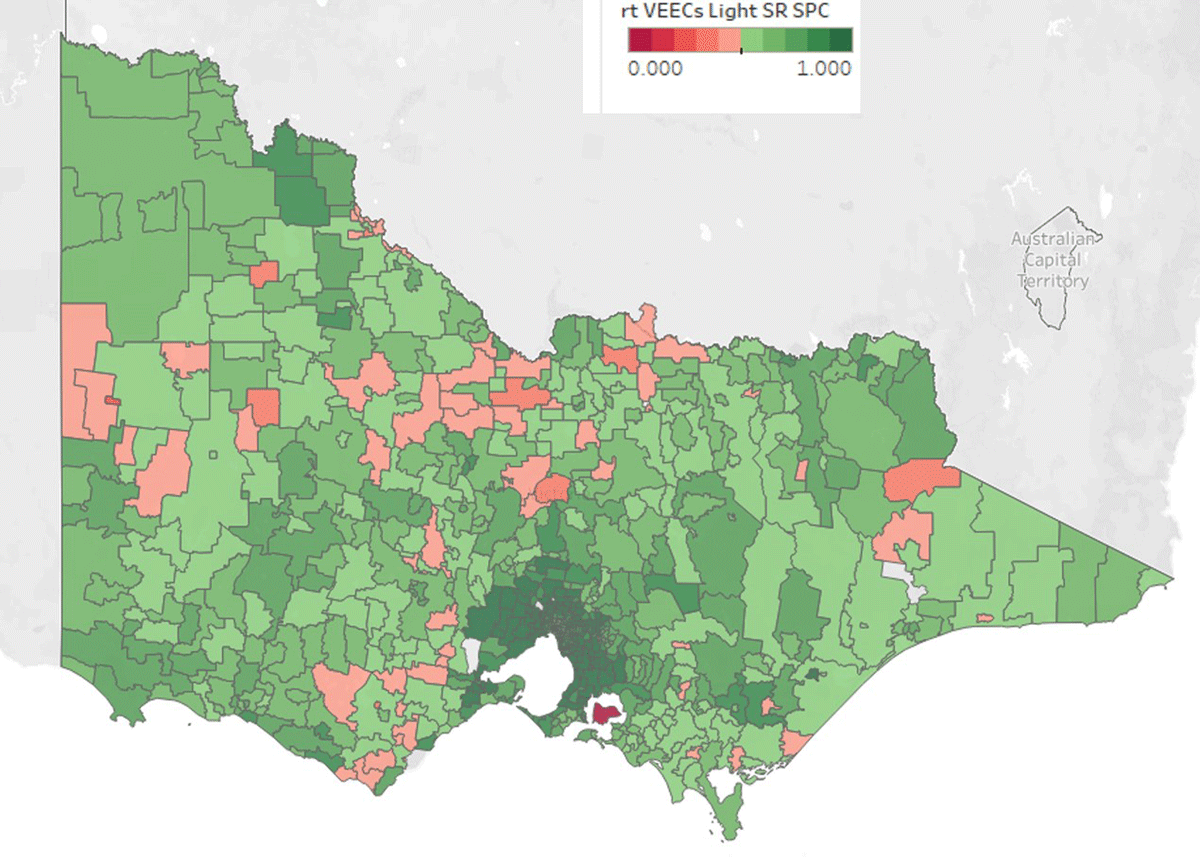
Figure 6
Spatial mapping of share of Victorian Energy Efficiency Certificates (VEECs) generated from the free activities of lighting upgrades, shower roses and stand-by power controllers.
Table 4
Independent samples t-test results of Victorian Energy Efficiency Certificate (VEEC) generation intensity by location.
| Variable | Group statistics | t-test for equality of means | Mean difference | ||||||
|---|---|---|---|---|---|---|---|---|---|
| N | Mean | SD | t | d.f. | p | ||||
| VEECs generation intensity | |||||||||
| Metropolitan areas | 275 | 1370.80 | 462.21 | –6.06 | 687 | 2.30E–09** | –224.89 | ||
| Regional areasa | 414 | 1595.68 | 487.18 | ||||||
| Share of VEECS from free activities (lighting upgrades, shower rose replacements, installation of stand-by power controllers) | |||||||||
| Metropolitan areasa | 275 | 0.87 | 0.09 | 31.43 | 681 | 1.10E–134** | 0.25 | ||
| Regional areasa | 414 | 0.62 | 0.12 | ||||||
| VEECs generation intensity of lighting upgrade activities | |||||||||
| Metropolitan areas | 275 | 748.78 | 330.78 | 9.24 | 409 | 1.42E–18** | 205.64 | ||
| Regional areasa | 414 | 543.14 | 201.40 | ||||||
| VEECs generation intensity of water heating upgrade activities | |||||||||
| Metropolitan areas | 275 | 89.41 | 115.98 | –25.50 | 611 | 3.05E–98** | –374.48 | ||
| Regional areasa | 414 | 463.90 | 262.78 | ||||||
[i] Notes: a Levene’s test of homogeneity of variance indicated that equal variance could not be assumed.
** Highly statistically significant at p < 0.001.
Table 5
Descriptive statistics for predictor variables with the results of an independent samples t-test to assess the difference in means between metropolitan and regional postcode areas.
| N | Mean | SD | Minimum | Maximum | t-test for equality of means | Mean difference | ||||
|---|---|---|---|---|---|---|---|---|---|---|
| t | d.f. | p | ||||||||
| SEIFA IER score, 2016 | ||||||||||
| All postcode areas | 672 | 1011.23 | 57.09 | 731.00 | 1168.00 | |||||
| Metropolitan areas | 269 | 1023.41 | 70.24 | 731.00 | 1168.00 | 4.21 | 411.51 | 3.10E–05** | 20.31a | |
| Regional areas | 403 | 1003.10 | 44.56 | 846.00 | 1112.00 | |||||
| SEIFA IRSAD score, 2016 | ||||||||||
| All postcode areas | 672 | 1006.57 | 59.69 | 783.00 | 1126.00 | |||||
| Metropolitan areas | 269 | 1036.89 | 62.57 | 783.00 | 1126.00 | 11.23 | 471.84 | 4.36E–26** | 50.57a | |
| Regional areas | 403 | 986.32 | 48.06 | 795.00 | 1097.00 | |||||
| Change in SEIFA IER score, 2011–16 | ||||||||||
| All postcode areas | 672 | 2.57 | 14.83 | –58.62 | 83.74 | |||||
| Metropolitan areas | 269 | 1.09 | 13.49 | –58.62 | 71.62 | –2.17 | 627.18 | .030* | –2.46a | |
| Regional areas | 403 | 3.55 | 15.61 | –39.33 | 83.74 | |||||
| Change in SEIFA IRSAD score, 2011–16 | ||||||||||
| All postcode areas | 672 | 8.64 | 19.03 | –62.88 | 110.51 | |||||
| Metropolitan areas | 269 | 3.29 | 18.51 | –62.88 | 110.51 | –6.12 | 670.00 | 1.57E–09* | –8.93 | |
| Regional areas | 403 | 12.22 | 18.54 | –61.01 | 96.20 | |||||
| Rate of rented, occupied dwellings, 2016 | ||||||||||
| All postcode areas | 689 | 0.22 | 0.13 | 0.00 | 1.00 | |||||
| Metropolitan areas | 275 | 0.27 | 0.16 | 0.03 | 1.00 | 7.83 | 372.21 | 5.14E–14** | 0.08a | |
| Regional areas | 414 | 0.18 | 0.08 | 0.00 | 0.98 | |||||
| Rate of unoccupied dwellings, 2016 | ||||||||||
| All postcode areas | 689 | 0.16 | 0.13 | 0.00 | 0.87 | |||||
| Metropolitan areas | 275 | 0.11 | 0.11 | 0.00 | 0.87 | –9.92 | 650.33 | 1.10E–21** | –0.09a | |
| Regional areas | 414 | 0.20 | 0.13 | 0.00 | 0.78 | |||||
[i] Notes: a Levene’s test of homogeneity of variance indicated that equal variance could not be assumed.
SEIFA IER = Socio-Economic Indexes for Areas Index of Economic Resources; and SEIFA IRSAD = Socio-Economic Indexes for Areas Index of Relative Socio-Economic Advantage and Disadvantage.
Table 6
Results of the linear regression model predicting the effect of the dependent variables on Victorian Energy Efficiency Certificate (VEEC) generation intensity, differentiated by location.
| Variable | r2 | ANOVA | Unstandardised coefficients | 95% confidence interval for β | |||||||
|---|---|---|---|---|---|---|---|---|---|---|---|
| d.f. | F | β | Constant | p | Lower bound | Upper bound | |||||
| SEIFA IER score, 2016 | |||||||||||
| All postcode areas | 0.069 | 671 | 49.586 | 2.178 | –684.930 | 4.72E–12** | 1.571 | 2.785 | |||
| Metropolitan areas | 0.313 | 268 | 121.600 | 3.478 | –2167.306 | 1.51E–23** | 2.857 | 4.099 | |||
| Regional areas | 0.010 | 402 | 3.953 | 1.063 | 534.822 | 0.047* | 0.012 | 2.114 | |||
| SEIFA IRSAD score, 2016 | |||||||||||
| All postcode areas | 0.007 | 671 | 4.558 | –0.625 | 2174.181 | 0.033 | –1.252 | –0.052 | |||
| Metropolitan areas | 0.000 | 268 | 0.076 | 0.118 | 1270.037 | 0.783 | –0.723 | 0.959 | |||
| Regional areas | 0.000 | 402 | 0.002 | 0.023 | 1578.924 | 0.964 | –0.957 | 1.002 | |||
| Change in SEIFA IER score, 2011–16 | |||||||||||
| All postcode areas | 0.003 | 671 | 2.152 | 1.807 | 1512.906 | 1.43E–01** | –0.612 | 4.225 | |||
| Metropolitan areas | 0.023 | 268 | 6.224 | 4.888 | 1386.939 | 0.013* | 1.030 | 8.745 | |||
| Regional areas | 0.000 | 402 | 0.131 | –0.555 | 1603.124 | 0.718 | –3.570 | 2.461 | |||
| Change in SEIFA IRSAD score, 2011–16 | |||||||||||
| All postcode areas | 0.011 | 671 | 7.466 | 2.613 | 1494.956 | 0.006* | 0.735 | 4.491 | |||
| Metropolitan areas | 0.004 | 268 | 1.195 | 1.574 | 1387.099 | 0.275 | –1.262 | 4.411 | |||
| Regional areas | 0.003 | 402 | 1.128 | 1.369 | 1584.425 | 0.289 | –1.165 | 3.904 | |||
| Rate of rented, occupied dwellings, 2016 | |||||||||||
| All postcode areas | 0.195 | 688 | 166.485 | –1679.980 | 1869.770 | 2.91E–34** | –1935.621 | –1424.340 | |||
| Metropolitan areas | 0.485 | 274 | 256.862 | –1971.650 | 1896.890 | 3.37E–41** | –2213.840 | –1729.459 | |||
| Regional areas | 0.009 | 413 | 3.919 | –560.201 | 1698.310 | 0.048* | –1116.500 | –3.903 | |||
| Rate of unoccupied dwellings, 2016 | |||||||||||
| All postcode areas | 0.056 | 688 | 40.558 | –907.548 | 1652.686 | 3.49E–10** | –1187.347 | –627.750 | |||
| Metropolitan areas | 0.051 | 274 | 14.596 | –972.691 | 1475.955 | 1.65E–04** | –1473.923 | –471.459 | |||
| Regional areas | 0.164 | 413 | 80.954 | –1549.247 | 1901.376 | 8.55E–18** | –1887.722 | 1210.771 | |||
[i] Notes: VEECs were generated to 30 June 2017; SEIFA IER = Socio-Economic Indexes for Areas Index of Economic Resources; SEIFA IRSAD = Socio-Economic Indexes for Areas Index of Relative Socio-Economic Advantage and Disadvantage.
* Statistically significant at p < 0.05; ** = highly statistically significant at p < 0.001; p-values were not adjusted for multiple testing.
Table 7
Results of the linear regression model predicting the effect of the dependent variables on the Victorian Energy Efficiency Certificate (VEEC) generation intensity of lighting upgrades, differentiated by location.
| Variable | r2 | ANOVA | Unstandardised coefficients | 95% confidence interval for β | |||||||
|---|---|---|---|---|---|---|---|---|---|---|---|
| d.f. | F | β | Constant | p | Lower bound | Upper bound | |||||
| SEIFA IER score, 2016 | |||||||||||
| All postcode areas | 0.194 | 671 | 161.361 | 2.102 | –1494.073 | 2.80E–30** | 1.777 | 2.427 | |||
| Metropolitan areas | 0.239 | 268 | 83.794 | 2.218 | –1506.667 | 1.47E–17** | 1.741 | 2.695 | |||
| Regional areas | 0.076 | 402 | 32.808 | 1.182 | –342.318 | 1.99E–08** | 0.776 | 1.588 | |||
| SEIFA IRSAD score, 2016 | |||||||||||
| All postcode areas | 0.082 | 671 | 60.214 | 1.310 | –687.597 | 3.18E–14** | 0.979 | 1.642 | |||
| Metropolitan areas | 0.006 | 268 | 1.742 | 0.410 | 338.039 | 0.188 | –0.202 | 1.022 | |||
| Regional areas | 0.060 | 402 | 25.708 | 0.978 | –421.339 | 6.08E–07** | 0.599 | 1.357 | |||
| Change in SEIFA IER score, 2011–16 | |||||||||||
| All postcode areas | 0.000 | 671 | 0.126 | –0.251 | 632.049 | 0.723 | –1.644 | 1.141 | |||
| Metropolitan areas | 0.000 | 268 | 0.062 | 0.360 | 762.882 | 0.803 | –2.488 | 3.208 | |||
| Regional areas | 0.001 | 402 | 0.294 | 0.332 | 542.204 | 0.588 | –0.872 | 1.536 | |||
| Change in SEIFA IRSAD score, 2011–16 | |||||||||||
| All postcode areas | 0.014 | 671 | 9.774 | –1.716 | 646.239 | 0.002* | –2.794 | –0.638 | |||
| Metropolitan areas | 0.006 | 268 | 1.525 | –1.297 | 767.538 | 0.218 | –3.366 | 0.771 | |||
| Regional areas | 0.000 | 402 | 0.071 | 0.138 | 541.701 | 0.790 | –0.876 | 1.151 | |||
| Rate of rented, occupied dwellings, 2016 | |||||||||||
| All postcode areas | 0.045 | 688 | 32.602 | –462.093 | 725.297 | 1.68E–08** | –620.991 | –303.195 | |||
| Metropolitan areas | 0.320 | 274 | 128.756 | –1147.262 | 1054.905 | 1.05E–24** | –1346.310 | –948.214 | |||
| Regional areas | 0.001 | 413 | 0.591 | 90.314 | 526.596 | 0.442 | –140.590 | 321.218 | |||
| Rate of unoccupied dwellings, 2016 | |||||||||||
| All postcode areas | 0.089 | 688 | 67.062 | –653.582 | 730.855 | 1.28E–15** | –810.284 | –496.880 | |||
| Metropolitan areas | 0.021 | 274 | 5.899 | –449.373 | 797.364 | 0.016* | –813.629 | –85.118 | |||
| Regional areas | 0.073 | 413 | 32.512 | –426.580 | 627.252 | 2.26E–08** | –573.644 | –279.516 | |||
[i] Notes: VEECs were generated until 30 June 2017 from lighting upgrade activities.
SEIFA IER = Socio-Economic Indexes for Areas Index of Economic Resources; SEIFA IRSAD = Socio-Economic Indexes for Areas Index of Relative Socio-Economic Advantage and Disadvantage.
* Statistically significant at p < 0.05; ** highly statistically significant at p < 0.001. p-values were adjusted for multiple testing.
Table 8
Results of the linear regression model predicting the effect of the dependent variables on the Victorian Energy Efficiency Certificate (VEEC) generation intensity of water heating upgrades, differentiated by location.
| Variable | r2 | ANOVA | Unstandardised coefficients | 95% confidence interval for β | |||||||
|---|---|---|---|---|---|---|---|---|---|---|---|
| d.f. | F | β | Constant | p | Lower bound | Upper bound | |||||
| SEIFA IER score, 2016 | |||||||||||
| All postcode areas | 0.001 | 671 | 0.406 | 0.122 | 192.870 | 0.524 | –0.254 | 0.499 | |||
| Metropolitan areas | 0.214 | 268 | 72.863 | 0.768 | –694.417 | 1.06E–15** | 0.591 | 945.000 | |||
| Regional areas | 0.011 | 402 | 4.275 | 0.603 | –138.440 | 0.039* | 0.030 | 1.177 | |||
| SEIFA IRSAD score, 2016 | |||||||||||
| All postcode areas | 0.051 | 671 | 36.270 | –1.076 | 1399.510 | 2.83E–09** | –1.427 | –0.725 | |||
| Metropolitan areas | 0.059 | 268 | 16.676 | 0.451 | –376.590 | 5.90E–05** | 0.234 | 0.669 | |||
| Regional areas | 0.000 | 402 | 0.004 | 0.017 | 449.903 | 0.950 | –0.518 | 0.552 | |||
| Change in SEIFA IER score, 2011–16 | |||||||||||
| All postcode areas | 0.008 | 671 | 5.473 | 1.720 | 312.056 | 0.020* | 0.276 | 3.163 | |||
| Metropolitan areas | 0.089 | 268 | 26.178 | 2.581 | 88.596 | 5.96E–07** | 1.588 | 3.574 | |||
| Regional areas | 0.000 | 402 | 0.064 | –0.211 | 467.440 | 0.801 | –1.857 | 1.435 | |||
| Change in SEIFA IRSAD score, 2011–16 | |||||||||||
| All postcode areas | 0.059 | 671 | 42.070 | 3.620 | 285.181 | 1.71E–10** | 2.524 | 4.716 | |||
| Metropolitan areas | 0.074 | 268 | 21.280 | 1.709 | 85.795 | 6.00E–06** | 0.980 | 2.439 | |||
| Regional areas | 0.009 | 402 | 3.510 | 1.315 | 450.626 | 0.062 | –0.065 | 2.694 | |||
| Rate of rented, occupied dwellings, 2016 | |||||||||||
| All postcode areas | 0.187 | 688 | 157.863 | –952.780 | 520.782 | 9.73E–33** | –1101.671 | –803.890 | |||
| Metropolitan areas | 0.271 | 274 | 101.705 | –370.185 | 188.194 | 1.55E–20** | –442.450 | –297.921 | |||
| Regional areas | 0.106 | 413 | 48.852 | –1013.554 | 649.577 | 1.11E–11** | –1298.611 | –728.497 | |||
| Rate of unoccupied dwellings, 2016 | |||||||||||
| All postcode areas | 0.021 | 688 | 14.561 | 320.566 | 262.619 | 1.48E–04** | 155.621 | 485.512 | |||
| Metropolitan areas | 0.032 | 274 | 9.091 | 194.487 | 68.392 | 3.00E–03* | 67.498 | 321.476 | |||
| Regional areas | 0.034 | 413 | 14.283 | –376.713 | 538.175 | 1.80E–04** | –572.651 | –180.774 | |||
[i] Notes: VEECs were generated until 30 June 2017 from water heating upgrade activities.
SEIFA IER = Socio-Economic Indexes for Areas Index of Economic Resources; SEIFA IRSAD = Socio-Economic Indexes for Areas Index of Relative Socio-Economic Advantage and Disadvantage.
* Statistically significant at p < 0.05; ** highly statistically significant at p < 0.001. p-values were not adjusted for multiple testing.
Table 9
Summary of multiple regression analysis for Victorian Energy Efficiency Certificate (VEEC) generation intensity across all postcode areas.
| Variable | Β | SEΒ | β | t | p |
|---|---|---|---|---|---|
| Intercept | 1874.915 | 32.647 | 57.429 | 2.95E–264 | |
| Rate of rented, occupied dwellings, 2016 | –0.09 | 0.03 | –0.11 | –3.029 | 0.003* |
| Rate of unoccupied dwellings, 2016 | –1536.34 | 137.848 | –0.404 | –11.145 | 1.25E–26** |
[i] Notes: Β = unstandardised regression coefficient; SEΒ = standard error of the coefficient; β = standardised coefficient.
* Statistically significant at p < 0.05; ** highly statistically significant at p < 0.001.
Table 10
Summary of multiple regression analysis for Victorian Energy Efficiency Certificate (VEEC) generation intensity across metropolitan postcode areas.
| Variable | Β | SEΒ | β | t | p | |
|---|---|---|---|---|---|---|
| Intercept | 1912.695 | 39.57 | 48.337 | 1.51E–135 | ||
| Rate of rented, occupied dwellings, 2016 | –0.051 | 0.031 | –0.073 | –1.619 | 0.107 | |
| Rate of unoccupied dwellings, 2016 | –1916.41 | 127.311 | –0.677 | –15.053 | 1.15E–37** | |
[i] Notes: Β = unstandardised regression coefficient; SEΒ = standard error of the coefficient; β = standardised coefficient.
** Highly statistically significant at p < 0.001.
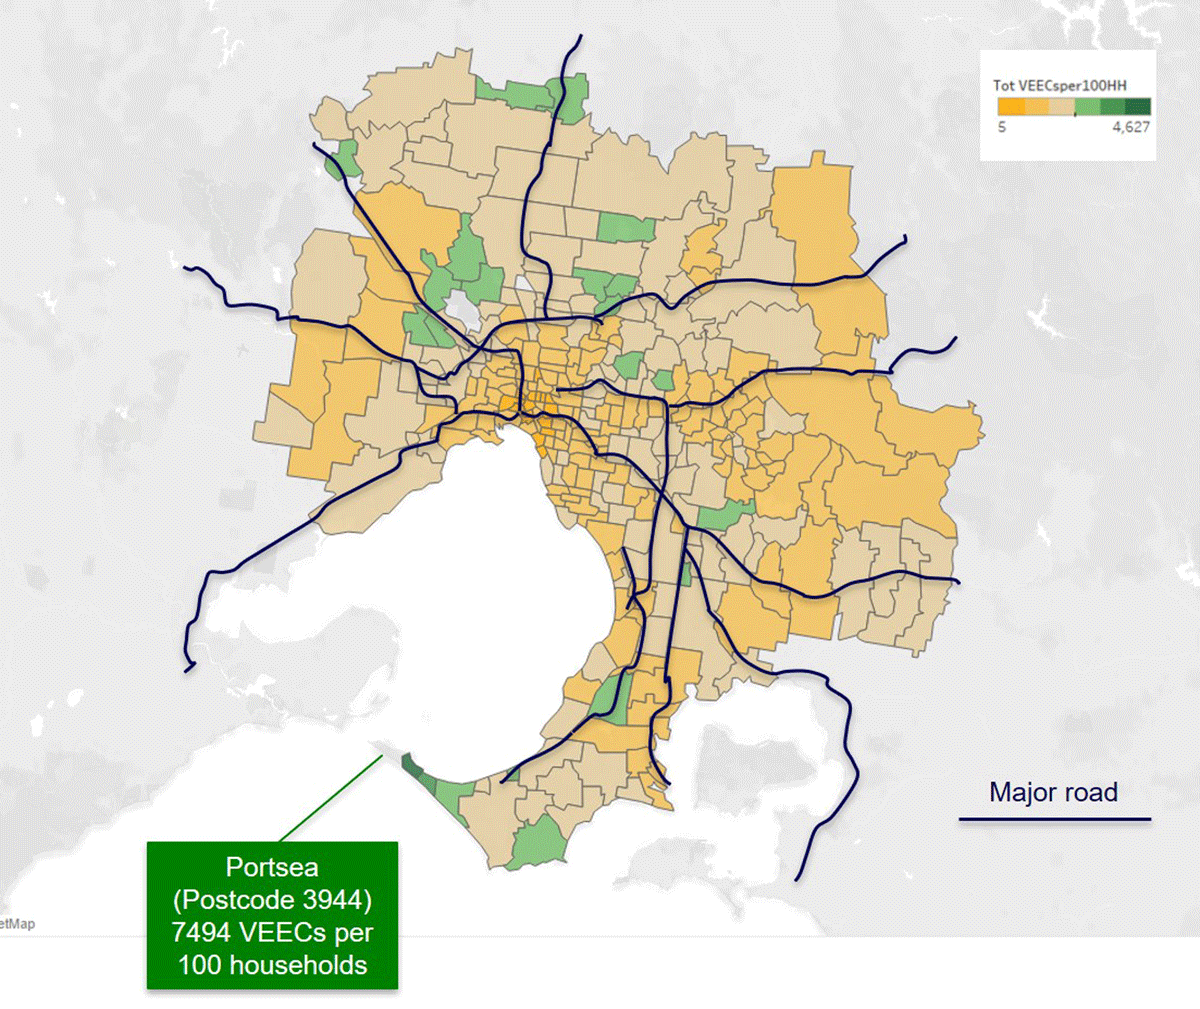
Figure 7
Spatial mapping of Victorian Energy Efficiency Certificate (VEEC) generation intensity per household, excluding postcode area 3944.
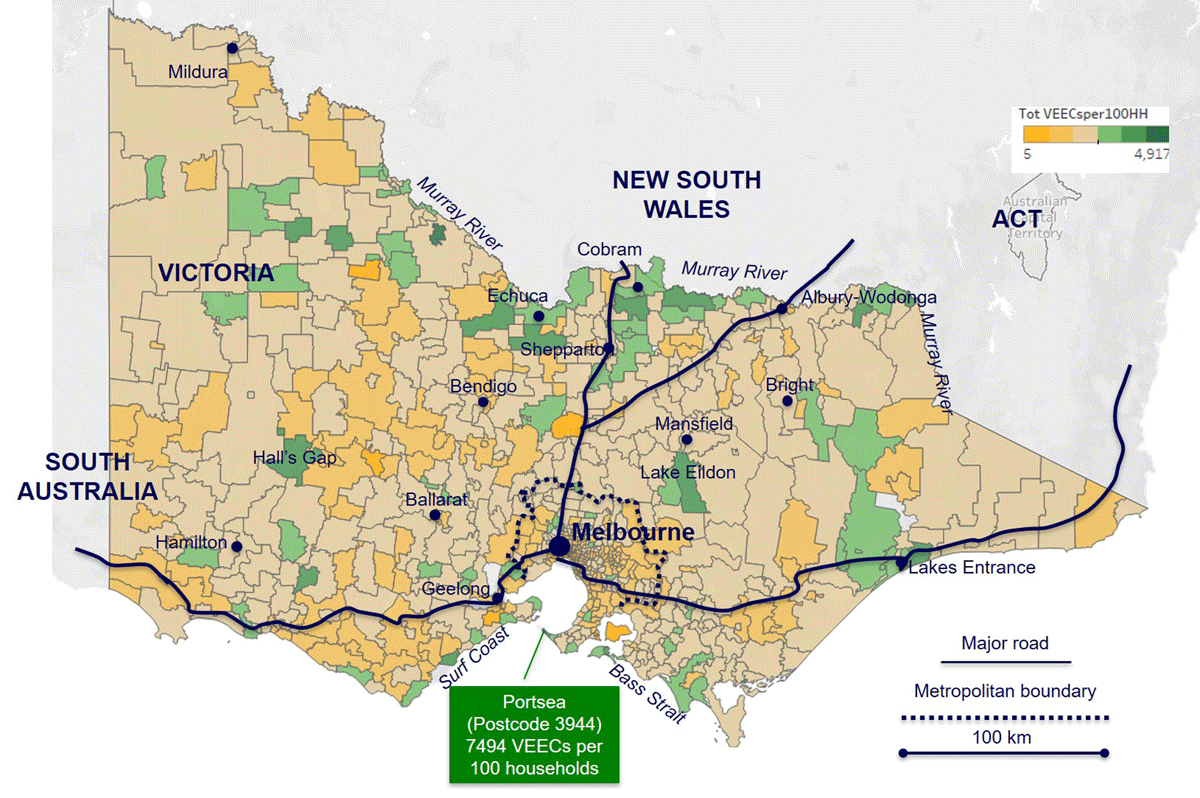
Figure 8
Spatial mapping of Victorian Energy Efficiency Certificate (VEEC) generation intensity per household, excluding postcode area 3944.
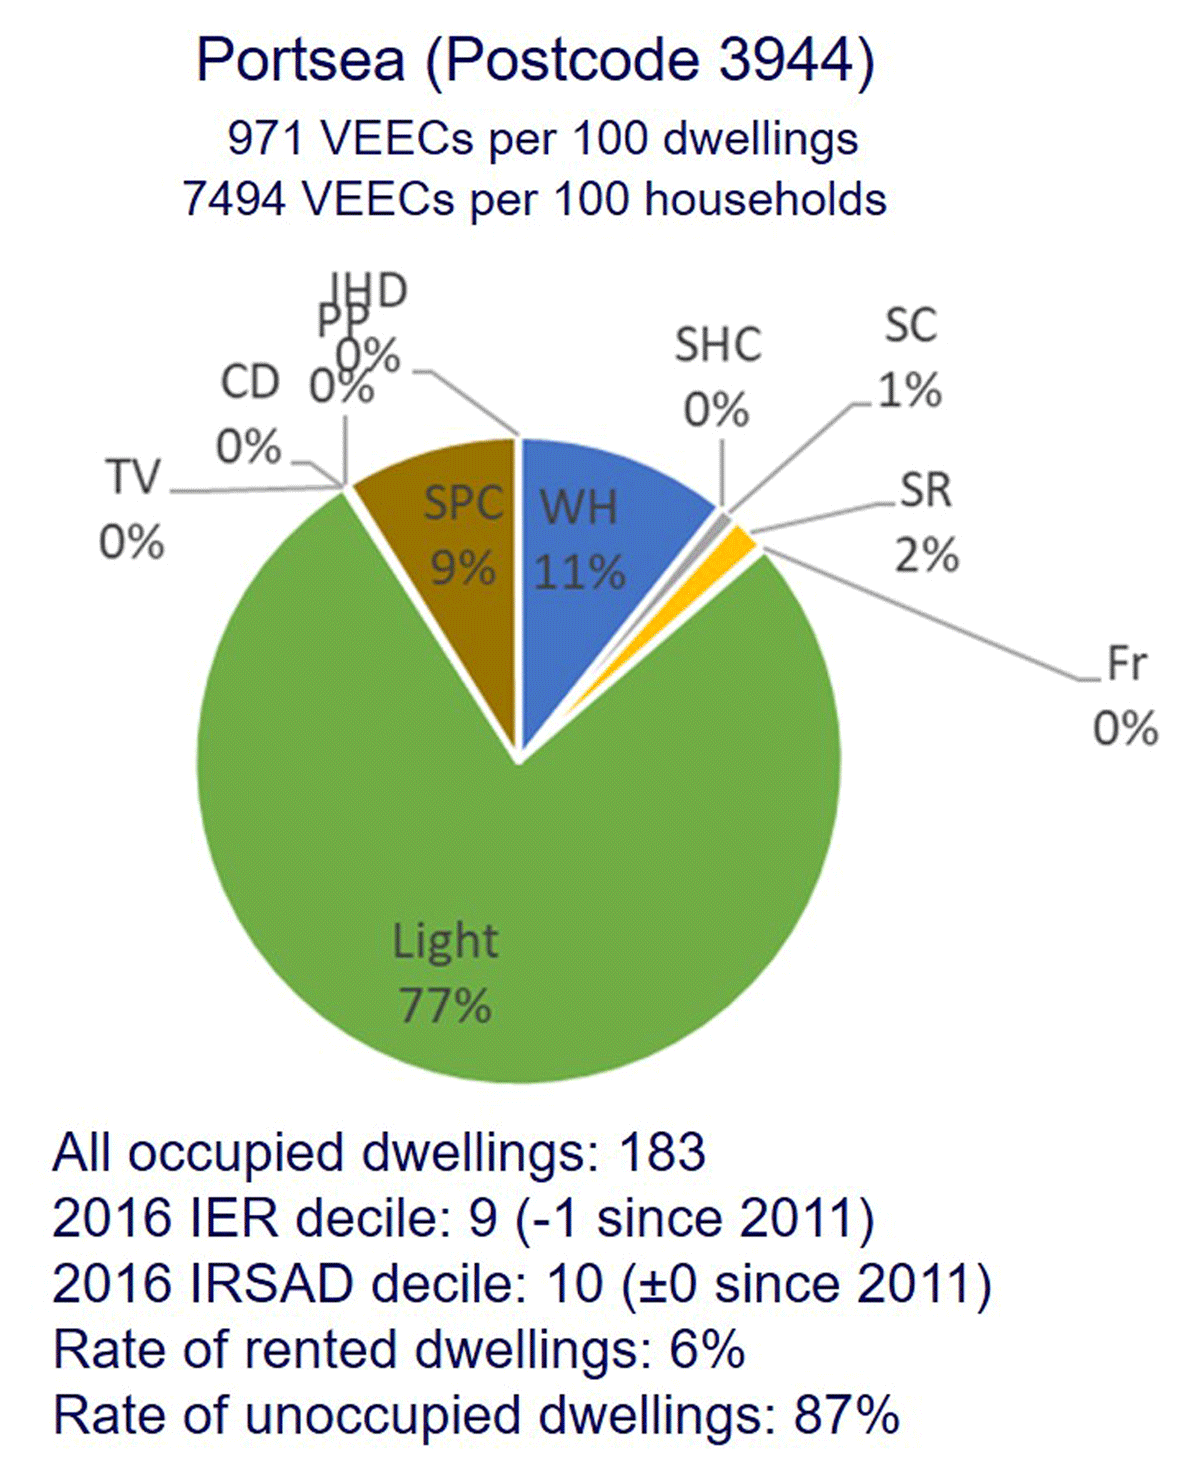
Figure 9
Summary of the Victorian Energy Efficiency Certificate (VEEC) generation and key socioeconomic indicators for the top outlier metropolitan postcode area 3944 (Portsea).