
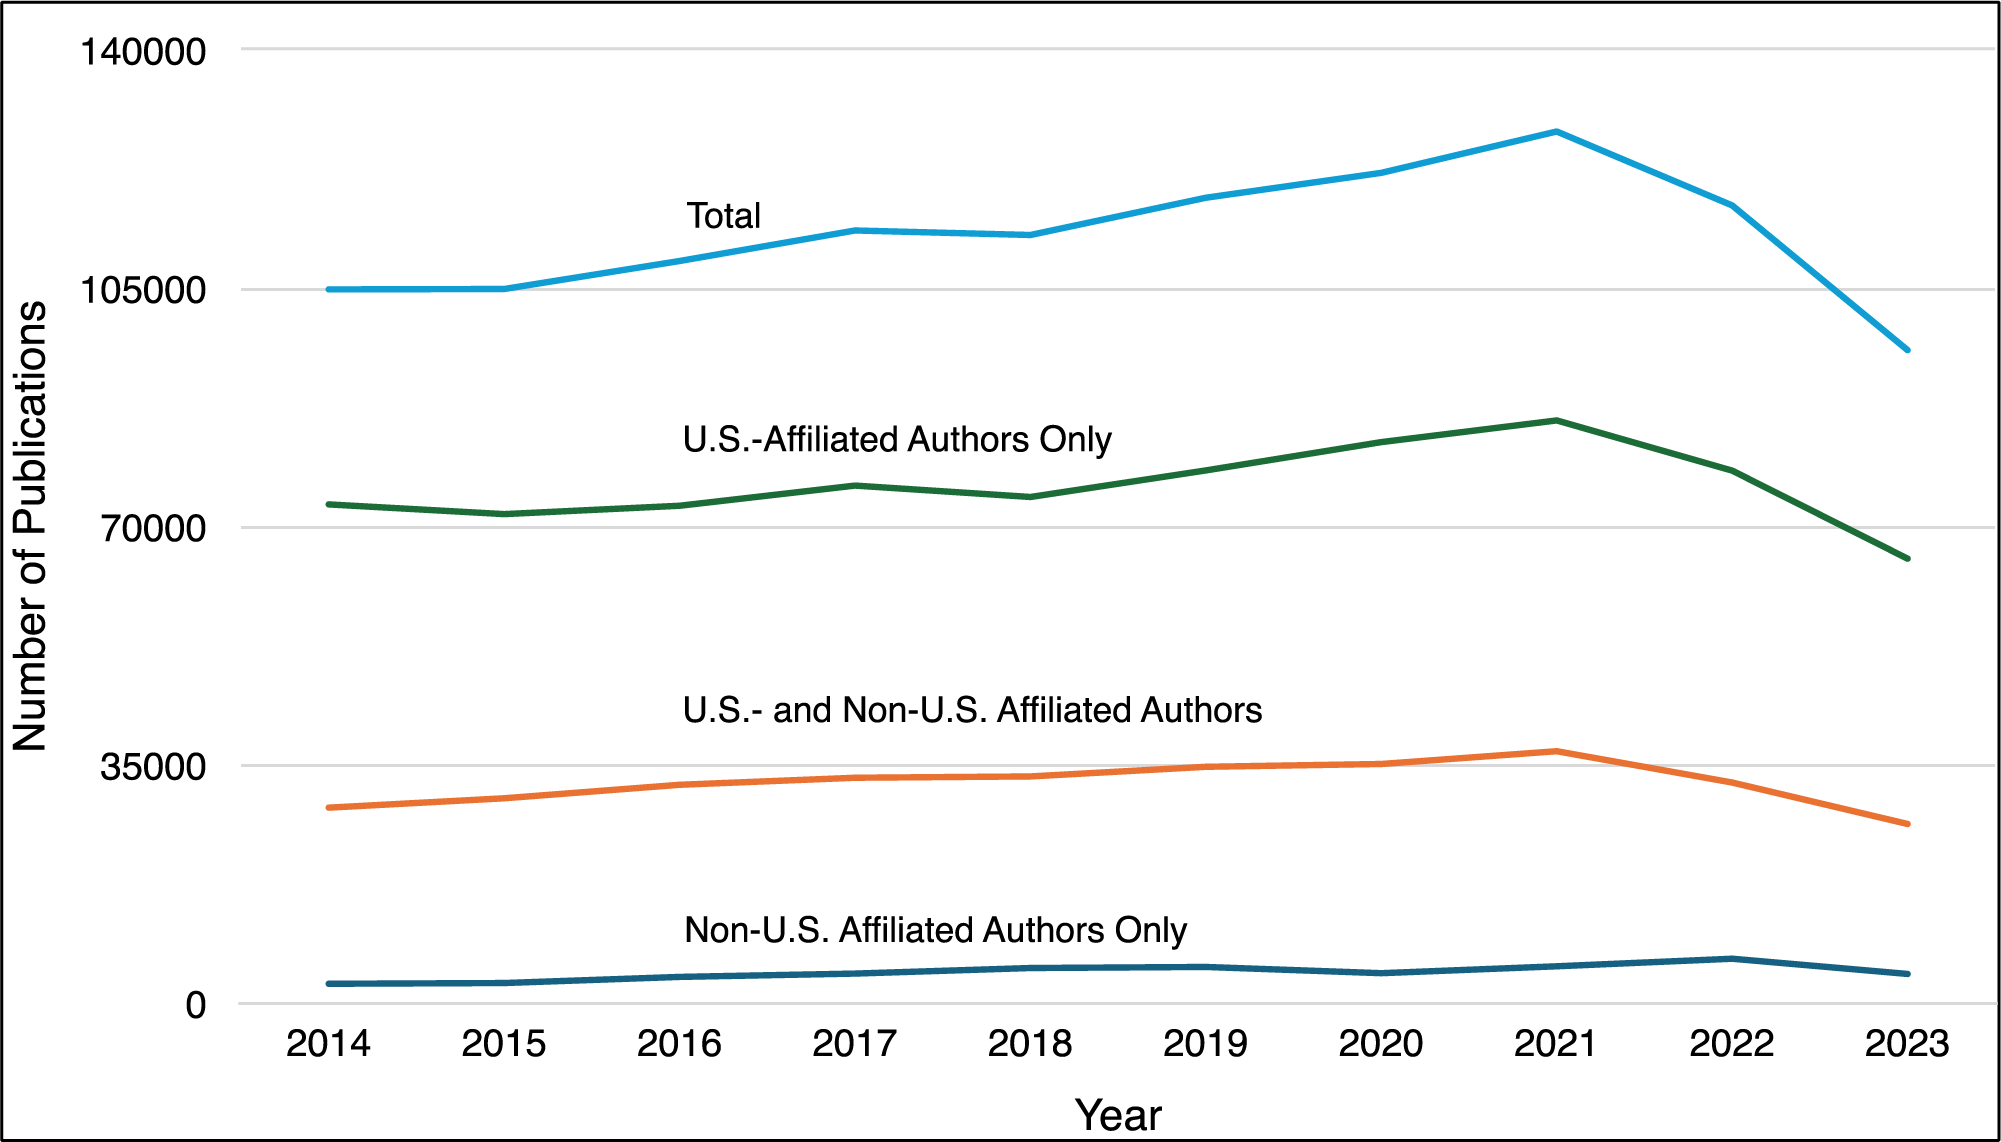
Figure 1
Number of publications funded by the U.S. National Institutes of Health by country of authors’ affiliations – 2014–23.
Table 1
Publication count, scientific impact (Mean Category Normalized Citation Impact [CNCI]), and author order by author country affiliation of publications funded by the National Institutes of Health – 2023.
| AUTHOR AFFILIATIONS | NUMBER OF PUBLICATIONS (% OF CATEGORY) | MEAN CATEGORY NORMALIZED CITATION IMPACT |
|---|---|---|
| All publications | 95,881 (100%) | 1.49 |
| U.S. only | 65,259 (68.1%) | 1.32 |
| U.S. and non‑U.S. | 26,324 (27.5%) | 1.48 |
| Non‑U.S. only | 4298 (4.5%) | 1.44 |
| Author affiliations by country income level | ||
| Non‑U.S. high‑income countries | 22,064 (67.1%) | 2.06 |
| Middle | 9956 (30.3%) | 1.82 |
| Low | 841 (2.6%) | 1.73 |
| Author Affiliations by WHO region | ||
| Africa | 2415 (6.6%) | 1.55 |
| Non‑U.S. Americas | 6704 (18.4%) | 2.20 |
| Eastern Mediterranean | 1310 (3.6%) | 2.22 |
| Europe | 14,948 (41.0%) | 2.21 |
| South‑East Asia | 1529 (4.2%) | 2.15 |
| Western Pacific | 9569 (26.2%) | 2.19 |
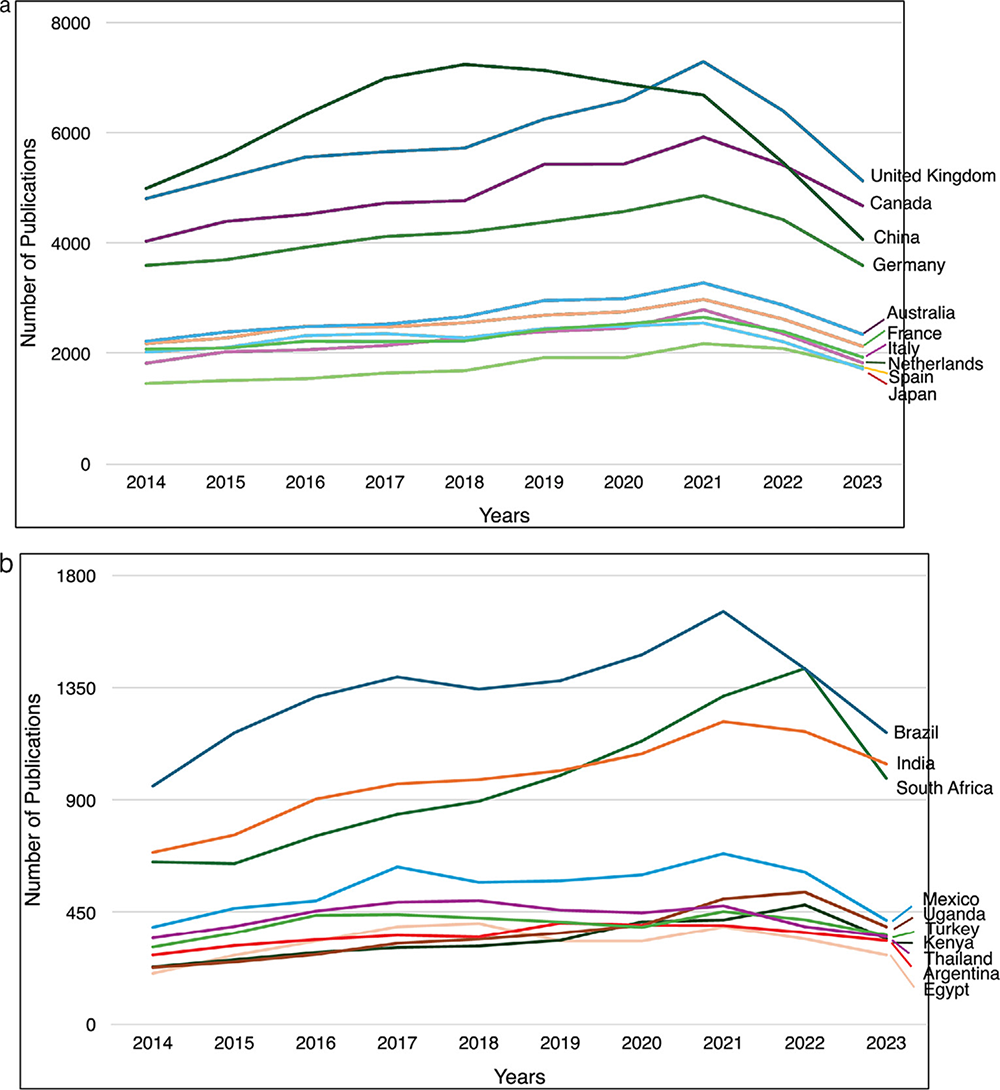
Figure 2
Number of Publications Funded by the U.S. National Institutes of Health by Foreign Country of Authors’ Affiliations – 2014–23. (a) Top 10 Countries; (b) Top 10 Low‑ and Middle‑Income Countries (Excluding China).
Table 2
Publication count, scientific impact (Mean Category Normalized Citation Impact [CNCI]), and author order by author country affiliation of publications funded by the National Institutes of Health, top 10 countries overall and top 10 low‑ and middle‑income countries (LMICs, other than China) by descending number of publications – 2023.
| AUTHOR AFFILIATIONS | NUMBER OF PUBLICATIONS | MEAN CATEGORY NORMALIZED CITATION IMPACT | FIRST AUTHOR FROM COUNTRY | LAST AUTHOR FROM COUNTRY |
|---|---|---|---|---|
| United Kingdom | 5129 | 2.81 | 28.8% | 27.5% |
| Canada | 4677 | 2.66 | 29.8% | 28.6% |
| China | 4066 | 2.31 | 48.3% | 26.2% |
| Germany | 3594 | 2.99 | 27.8% | 23.0% |
| Australia | 2344 | 2.97 | 29.7% | 29.6% |
| France | 2126 | 3.16 | 25.7% | 22.0% |
| Italy | 1929 | 3.39 | 29.7% | 22.6% |
| Netherlands | 1836 | 3.25 | 26.1% | 21.5% |
| Spain | 1750 | 3.32 | 27.5% | 21.0% |
| Japan | 1719 | 2.79 | 33.9% | 22.2% |
| Top 10 other LMICs | ||||
| Brazil | 1170 | 2.9 | 35.8% | 26.7% |
| India | 1045 | 2.45 | 36.9% | 24.5% |
| South Africa | 987 | 2.5 | 36.7% | 39.4% |
| Mexico | 418 | 3.77 | 26.1% | 18.7% |
| Uganda | 392 | 2.21 | 30.1% | 26.8% |
| Turkey | 358 | 4.03 | 30.7% | 15.9% |
| Thailand | 352 | 2.07 | 36.1% | 20.7% |
| Kenya | 343 | 2.27 | 21.3% | 16.3% |
| Saudi Arabia | 341 | 3.5 | 26.7% | 13.2% |
| Russia | 294 | 4.38 | 21.8% | 21.75% |
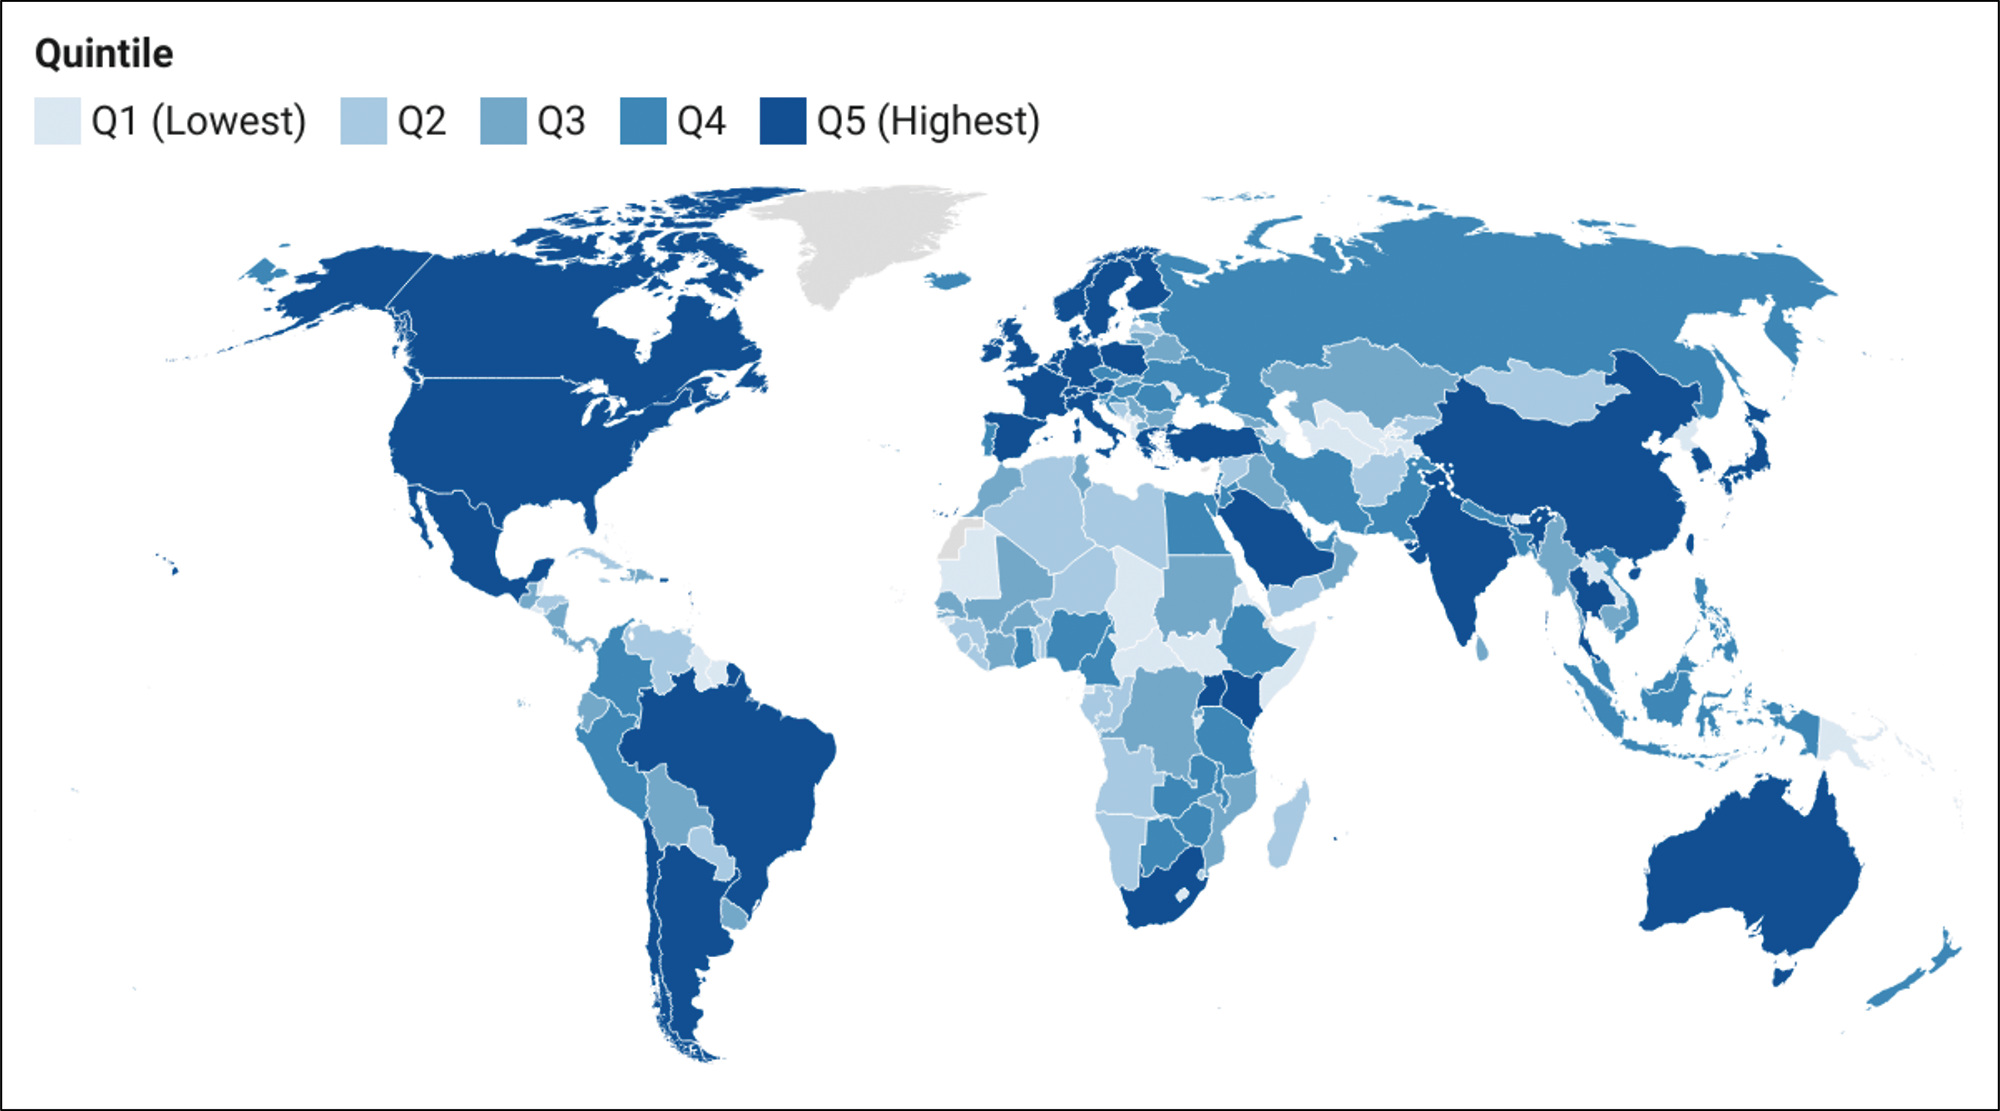
Figure 3
Quintiles of number of publications funded by the U.S. National Institutes of Health by country of authors’ affiliations – 2023.