
Table 1
Number of new cases and ASIR of multiple sclerosis in global and by SDI and WHO regions.
| LOCATION | NUMBER (95% CI) | ASIR PER 100,000 (95% CI) | ||||||||||
|---|---|---|---|---|---|---|---|---|---|---|---|---|
| SEX | SEX | |||||||||||
| BOTH | MALE | FEMALE | BOTH | MALE | FEMALE | |||||||
| 1990 | 2021 | 1990 | 2021 | 1990 | 2021 | 1990 | 2021 | 1990 | 2021 | 1990 | 2021 | |
| Global | 41,970 (36,605–48,234) | 62,920 (56,015–70,635) | 15,801 (13,755–18,219) | 23,728 (20,908–26,691) | 26,169 (22,883–29,999) | 39,192 (35,032–44,052) | 0.77 (0.68–0.86) | 0.75 (0.68–0.82) | 0.52 (0.47–0.58) | 0.50 (0.45–0.55) | 1.02 (0.90–1.13) | 1.01 (0.92–1.10) |
| SDI Regions | ||||||||||||
| Low | 1456 (1184–1792) | 3974 (3311–4754) | 555 (450–686) | 1468 (1209–1782) | 901 (735–1102) | 2506 (2086–2966) | 0.30 (0.25–0.34) | 0.29 (0.25–0.34) | 0.23 (0.19–0.26) | 0.22 (0.18–0.25) | 0.38 (0.31–0.43) | 0.37 (0.31–0.43) |
| Low‑middle | 4107 (3358–4995) | 9858 (8341–11,614) | 1625 (1331–1994) | 3702 (3060–4407) | 2483 (2039–3001) | 6156 (5205–7238) | 0.34 (0.29–0.39) | 0.34 (0.29–0.39) | 0.24 (0.20–0.27) | 0.23 (0.19–0.26) | 0.45 (0.38–0.52) | 0.45 (0.38–0.51) |
| Middle | 6146 (5141–7333) | 12,594 (10,823–14,531) | 2450 (2048–2936) | 5094 (4334–5844) | 3696 (3073–4407) | 7500 (6423–8701) | 0.30 (0.26–0.35) | 0.37 (0.31–0.42) | 0.20 (0.17–0.23) | 0.23 (0.19–0.26) | 0.41 (0.35–0.47) | 0.51 (0.43–0.59) |
| High‑middle | 9143 (8123–10,318) | 10,507 (9447–11,562) | 3812 (3366–4309) | 4475 (3998–4943) | 5331 (4746–5998) | 6032 (5443–6677) | 0.30 (0.26–0.34) | 0.39 (0.34–0.43) | 0.20 (0.17–0.23) | 0.25 (0.22–0.28) | 0.41 (0.35–0.46) | 0.53 (0.46–0.59) |
| High | 21,063 (18,609–23,755) | 25,926 (23,686–28,293) | 7337 (6481–8301) | 8966 (8180–9808) | 13,726 (12,198–15,549) | 16,961 (15,492–18,534) | 1.37 (1.23–1.52) | 1.66 (1.55–1.79) | 0.93 (0.83–1.02) | 1.07 (0.99–1.16) | 1.83 (1.63–2.02) | 2.30 (2.15–2.47) |
| WHO Regions | ||||||||||||
| AFRO | 1239 (1028–1458) | 3114 (2591–3628) | 449 (372–531) | 1094 (910–1282) | 790 (660–933) | 2020 (1682–2352) | 0.31 (0.26–0.35) | 0.31 (0.27–0.36) | 0.24 (0.20–0.27) | 0.24 (0.20–0.27) | 0.38 (0.31–0.43) | 0.39 (0.33–0.44) |
| AMRO | 11,005 (9636–12,383) | 16,905 (15,826–18,105) | 3399 (2999–3783) | 5457 (5052–5913) | 7606 (6667–8591) | 11,447 (10,757–12,258) | 1.53 (1.34–1.72) | 1.60 (1.50–1.71) | 0.99 (0.87–1.10) | 1.03 (0.96–1.11) | 2.05 (1.80–2.32) | 2.16 (2.03–2.31) |
| EMRO | 3193 (2714–3736) | 7712 (6704–8670) | 992 (841–1150) | 2447 (2123–2744) | 2201 (1875–2582) | 5265 (4568–5926) | 0.95 (0.81–1.08) | 1.04 (0.91–1.17) | 0.58 (0.50–0.66) | 0.64 (0.56–0.72) | 1.34 (1.13–1.53) | 1.49 (1.29–1.68) |
| EURO | 18,670 (16,851–20,566) | 24,534 (22,433–26,760) | 6508 (5832–7177) | 8401 (7619–9203) | 12,161 (11,003–13,361) | 16,133 (14,741–17,591) | 2.07 (1.88–2.27) | 2.57 (2.38–2.78) | 1.48 (1.33–1.62) | 1.74 (1.60–1.89) | 2.66 (2.42–2.92) | 3.41 (3.16–3.68) |
| SEARO | 2885 (2390–3407) | 5047 (4178–5844) | 1052 (865–1250) | 1800 (1487–2112) | 1833 (1525–2158) | 3247 (2703–3725) | 0.28 (0.23–0.32) | 0.27 (0.22–0.31) | 0.20 (0.16–0.23) | 0.19 (0.16–0.22) | 0.36 (0.30–0.42) | 0.35 (0.29–0.40) |
| WPRO | 2184 (1868–2496) | 3477 (2961–3946) | 701 (589–819) | 1158 (979–1332) | 1483 (1268–1687) | 2319 (2961–3946) | 0.13 (0.11–0.15) | 0.15 (0.13–0.17) | 0.08 (0.07–0.09) | 0.10 (0.08–0.11) | 0.18 (0.15–0.20) | 0.20 (0.18–0.23) |
[i] ASIR: Age‑standardized incidence rate (per 100,000 population); SDI: Socio‑demographic index; AFRO: African region; AMRO: Region of the Americas; SEARO: South‑East Asia region; EURO: European region; EMRO: Eastern Mediterranean region; WPRO: Western Pacific region.
Table 2
Temporal trend analysis in incidence rate of multiple sclerosis in global and by SDI and WHO regions (1990–2021).
| LOCATION | AAPC (%) 1990–2021 (95% CI) | SEGMENT(S) | APC (95% CI) | P‑VALUE | |
|---|---|---|---|---|---|
| NUMBER | YEAR | ||||
| Global | −0.08 (−0.09, −0.07) | 5 | 1990–1993 | −0.66 (−0.83, −0.55) | <0.001 |
| 1993–1996 | −0.32 (−0.40, 0.28) | 0.113 | |||
| 1996–2004 | 0.36 (0.33, 0.39) | 0.022 | |||
| 2004–2012 | −0.19 (−0.26, −0.16) | 0.003 | |||
| 2012–2021 | −0.08 (−0.11, −0.03) | 0.019 | |||
| Low SDI | −0.08 (−0.09, −0.07) | 3 | 1990–2005 | −0.36 (−0.38, −0.33) | <0.001 |
| 2005–2010 | −0.61 (−0.80, −0.52) | 0.001 | |||
| 2010–2021 | 0.55 (0.52, 0.59) | <0.001 | |||
| Low‑middle SDI | −0.04 (−0.04, −0.03) | 5 | 1990–2010 | −0.31 (−0.32, −0.30) | <0.001 |
| 2010–2013 | 0.47 (−0.31, 0.52) | 0.099 | |||
| 2013–2016 | 0.11 (0.04, 0.45) | 0.004 | |||
| 2016–2019 | 0.50 (0.15, 0.57) | <0.001 | |||
| 2019–2021 | 0.93 (0.77, 1.04) | <0.001 | |||
| Middle SDI | 0.63 (0.62, 0.63) | 6 | 1990–1993 | −0.55 (−0.60, −0.49) | <0.001 |
| 1993–1996 | 0.19 (0.14, 0.25) | 0.003 | |||
| 1996–2001 | 0.62 (0.57, 0.66) | <0.001 | |||
| 2001–2008 | 0.79 (0.75, 0.82) | <0.001 | |||
| 2008–2019 | 0.89 (0.85, 0.90) | <0.001 | |||
| 2019–2021 | 1.04 (0.91, 1.10) | <0.001 | |||
| Middle‑high SDI | 0.82 (0.81, 0.83) | 4 | 1990–1995 | −0.49 (−0.56, −0.42) | <0.001 |
| 1995–2003 | 1.44 (1.40, 1.51) | 0.002 | |||
| 2003–2009 | 1.20 (1.06, 1.29) | <0.001 | |||
| 2009–2021 | 0.76 (0.73, 0.78) | <0.001 | |||
| High SDI | −0.03 (−0.04, −0.03) | 6 | 1990–1992 | −0.84 (−0.94, −0.74) | <0.001 |
| 1992–1995 | −0.50 (−0.56, −0.44) | 0.005 | |||
| 1995–1999 | 0.31 (0.27, 0.37) | <0.001 | |||
| 1999–2004 | 0.15 (0.10, 0.19) | 0.015 | |||
| 2004–2007 | −0.08 (−0.12, 0.00) | 0.060 | |||
| 2007–2021 | 0.03 (0.02, 0.05) | 0.011 | |||
| AFRO | 0.06 (0.05, 0.07) | 2 | 1990–2004 | −0.03 (−0.04, −0.02) | <0.001 |
| 2004–2021 | 0.13 (0.12, 0.14) | <0.001 | |||
| AMRO | 0.16 (0.15, 0.17) | 6 | 1990–1992 | 1.14 (1.03, 1.25) | <0.001 |
| 1992–1995 | 0.37 (0.30, 0.43) | <0.001 | |||
| 1995–2000 | −0.17 (−0.22, −0.13) | <0.001 | |||
| 2000–2004 | 0.24 (0.18, 0.31) | <0.001 | |||
| 2004–2011 | −0.13 (−0.18, −0.11) | <0.001 | |||
| 2011–2015 | 0.07 (−0.02, 0.18) | 0.106 | |||
| 2015–2021 | 0.34 (0.30, 0.39) | <0.001 | |||
| EMRO | 0.31 (0.30, 0.33) | 4 | 1990–1992 | −1.77 (−2.04, −1.38) | <0.001 |
| 1992–1995 | −1.12 (−1.22, 0.88) | 0.073 | |||
| 1995–2010 | 0.88 (0.84, 0.90) | <0.001 | |||
| 2010–2021 | 0.32 (0.29, 0.36) | 0.001 | |||
| EURO | 0.70 (0.69, 0.71) | 7 | 1990–1993 | −0.07 (−0.28, 0.03) | 0.142 |
| 1993–1996 | 0.55 (0.45, 0.64) | <0.001 | |||
| 1996–1999 | 2.18 (2.08, 2.26) | <0.001 | |||
| 1999–2004 | 1.42 (1.37, 1.47) | <0.001 | |||
| 2004–2008 | 0.60 (0.53, 0.81) | <0.001 | |||
| 2008–2014 | 0.44 (0.32, 0.49) | <0.001 | |||
| 2014–2021 | 0.21 (0.15, 0.25) | 0.004 | |||
| SEARO | −0.12 (−0.14, −0.12) | 4 | 1990–2005 | −0.58 (−0.59, −0.56) | <0.001 |
| 2005–2010 | −0.90 (−0.97, −0.83) | <0.001 | |||
| 2010–2019 | 0.76 (0.72, 0.78) | <0.001 | |||
| 2019–2021 | 1.27 (1.02, 1.42) | <0.001 | |||
| WPRO | 0.50 (0.48, 0.51) | 5 | 1990–1995 | −0.27 (−0.48, −0.15) | 0.001 |
| 1995–2001 | 0.80 (0.59, 0.94) | <0.001 | |||
| 2001–2005 | 1.45 (1.28, 1.69) | 0.001 | |||
| 2005–2010 | −0.43 (−0.57, −0.33) | 0.001 | |||
| 2010–2021 | 0.76 (0.72, 0.80) | <0.001 | |||
[i] APC: Annual percent change; AAPC: Average annual percent change; SDI: Socio‑demographic index; AFRO: African region; AMRO: Region of the Americas; SEARO: South‑East Asia region; EURO: European region; EMRO: Eastern Mediterranean region; WPRO: Western Pacific region.
Table 3
Projected age‑standardized incidence rate (ASIR) of multiple sclerosis in 2030 with absolute and relative changes by region.
| REGION | ASIR 2021 | APC (%) (LAST SEGMENT) | APC PROJECTION 2030 | ABSOLUTE CHANGE (APC)* | RELATIVE CHANGE (APC)** | AAPC (%) (1990–2021) | AAPC PROJECTION 2030 | ABSOLUTE CHANGE (AAPC)* | RELATIVE CHANGE (AAPC)** |
|---|---|---|---|---|---|---|---|---|---|
| Global | 0.753 | −0.08 | 0.747 | −0.006 | −0.8 | −0.08 | 0.747 | −0.006 | −0.8 |
| SDI Regions | |||||||||
| Low | 0.294 | +0.55 | 0.308 | +0.014 | +4.8 | −0.08 | 0.293 | −0.001 | −0.3 |
| Low‑middle | 0.339 | +0.93 | 0.368 | +0.029 | +8.6 | −0.04 | 0.338 | −0.001 | −0.3 |
| Middle | 0.369 | +1.04 | 0.405 | +0.036 | +9.8 | +0.63 | 0.390 | +0.021 | +5.7 |
| High‑middle | 0.386 | +0.76 | 0.413 | +0.027 | +7.0 | +0.82 | 0.415 | +0.029 | +7.5 |
| High | 2.370 | +0.03 | 2.376 | +0.006 | +0.3 | −0.03 | 2.364 | −0.006 | −0.3 |
| WHO Regions | |||||||||
| AFRO | 0.314 | +0.13 | 0.318 | +0.004 | +1.3 | +0.06 | 0.316 | +0.002 | +0.6 |
| AMRO | 1.602 | +0.34 | 1.652 | +0.050 | +3.1 | +0.16 | 1.625 | +0.023 | +1.4 |
| EMRO | 1.044 | +0.32 | 1.074 | +0.030 | +2.9 | +0.31 | 1.074 | +0.030 | +2.9 |
| EURO | 2.568 | +0.21 | 2.617 | +0.049 | +1.9 | +0.70 | 2.735 | +0.167 | +6.5 |
| SEARO | 0.268 | +1.27 | 0.301 | +0.033 | +12.3 | −0.12 | 0.265 | −0.003 | −1.1 |
| WPRO | 0.149 | +0.76 | 0.160 | +0.011 | +7.4 | +0.50 | 0.156 | +0.007 | +4.7 |
[i] APC: Annual percentage change; AAPC: Average annual percentage change; SDI: Socio‑demographic index; WHO: World Health Organization; AFRO: African region; AMRO: Region of the Americas; EMRO: Eastern Mediterranean region; EURO: European region; SEARO: South‑East Asia region; WPRO: Western Pacific region.
[ii] *Absolute Change = Projected ASIR 2030 − ASIR 2021 (per 100,000 population); **Relative Change (%) = [(Projected ASIR 2030 − ASIR 2021) / ASIR 2021] × 100.
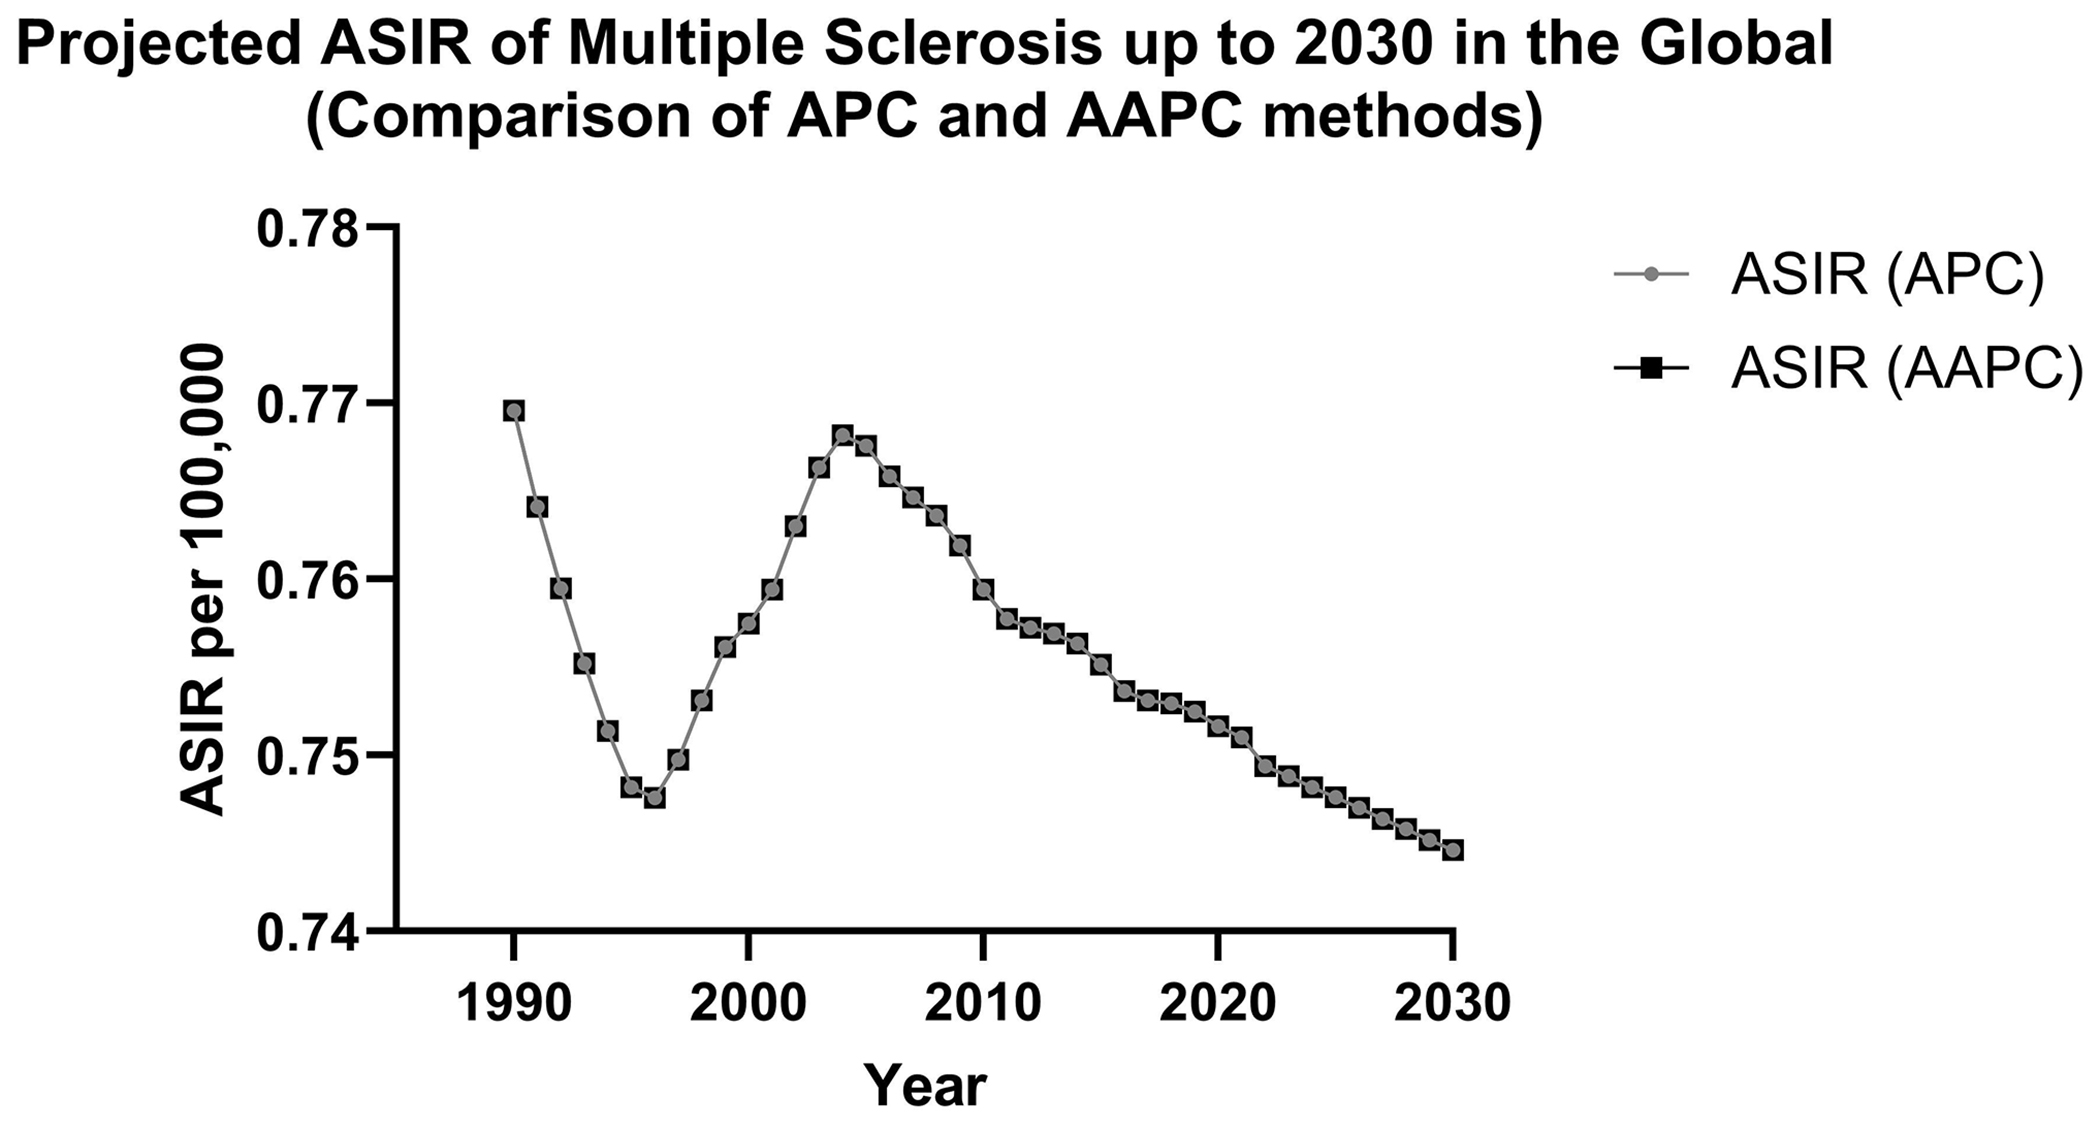
Figure 1
Projected global age‑standardized incidence rate (ASIR) of multiple sclerosis up to 2030 using APC and AAPC methods.
Table 4
Back‑testing results comparing predictive accuracy of short‑term (APC) versus long‑term (AAPC) trend methods for multiple sclerosis age‑standardized incidence rates.
| REGION | FINAL APC (1990–2015) | AAPC (1990–2015) | ASIR 2021 (ACTUAL) | APC PROJECTION 2021 | AAPC PROJECTION 2021 | MAPE (APC) | MAPE (AAPC) | PREFERRED METHOD |
|---|---|---|---|---|---|---|---|---|
| Global | −0.16% | −0.08% | 0.753 | 0.748 | 0.752 | 0.30% | 0.09% | AAPC |
| SDI Regions | ||||||||
| Low | +0.58% | −0.23% | 0.294 | 0.294 | 0.280 | 0.33% | 3.04% | APC |
| Low‑middle | +0.12% | −0.19% | 0.339 | 0.329 | 0.324 | 0.47% | 3.37% | APC |
| Middle | +0.89% | +0.55% | 0.369 | 0.368 | 0.360 | 0.11% | 1.53% | APC |
| High‑middle | +0.78% | +0.83% | 0.386 | 0.387 | 0.389 | 0.13% | 0.59% | APC |
| High | 0.00% | −0.05% | 2.370 | 2.367 | 2.361 | 0.11% | 0.27% | APC |
| WHO Regions | ||||||||
| AFRO | +0.14% | +0.05% | 0.314 | 0.314 | 0.311 | 0.05% | 0.34% | APC |
| AMRO | +0.08% | +0.10% | 1.602 | 1.579 | 1.581 | 0.14% | 0.60% | APC |
| EMRO | +0.29% | +0.31% | 1.044 | 1.038 | 1.040 | 0.23% | 1.77% | APC |
| EURO | +0.49% | +0.83% | 2.568 | 2.553 | 2.570 | 0.29% | 0.18% | AAPC |
| SEARO | +0.77% | −0.38% | 0.268 | 0.264 | 0.249 | 0.36% | 5.45% | APC |
| WPRO | +0.80% | +0.44% | 0.149 | 0.148 | 0.147 | 0.19% | 1.31% | APC |
[i] APC: Annual percentage change; AAPC: Average annual percentage change; MAPE: Mean absolute percentage error; RMSE: Root mean square error; SDI: Socio‑demographic index; WHO: World Health Organization; AFRO: African region; AMRO: Region of the Americas; EMRO: Eastern Mediterranean region; EURO: European region; SEARO: South‑East Asia region; WPRO: Western Pacific region.
Table 5
Primary and alternative scenarios for multiple sclerosis ASIR in 2030 based on back‑testing validation.
| REGION | ASIR 2021 | PRIMARY SCENARIO | PRIMARY PROJECTION 2030 | ALTERNATIVE PROJECTION 2030 | SENSITIVITY INDEX* | RELATIVE CHANGE (%)** | TREND REVERSAL*** |
|---|---|---|---|---|---|---|---|
| Global | 0.753 | AAPC | 0.747 | 0.747 | 0.000 | 0.0 | No |
| SDI Regions | |||||||
| Low | 0.294 | APC | 0.308 | 0.293 | 0.015 | 4.9 | Yes |
| Low‑middle | 0.339 | APC | 0.368 | 0.338 | 0.030 | 8.2 | Yes |
| Middle | 0.369 | APC | 0.405 | 0.390 | 0.015 | 3.7 | No |
| High‑middle | 0.386 | APC | 0.413 | 0.415 | 0.002 | 0.5 | No |
| High | 2.370 | APC | 2.376 | 2.364 | 0.012 | 0.5 | No |
| WHO Regions | |||||||
| AFRO | 0.314 | APC | 0.318 | 0.316 | 0.002 | 0.6 | No |
| AMRO | 1.602 | APC | 1.652 | 1.625 | 0.027 | 1.6 | No |
| EMRO | 1.044 | AAPC | 1.074 | 1.074 | 0.000 | 0.0 | No |
| EURO | 2.568 | AAPC | 2.735 | 2.617 | 0.118 | 4.3 | No |
| SEARO | 0.268 | APC | 0.301 | 0.265 | 0.036 | 12.0 | Yes |
| WPRO | 0.149 | APC | 0.160 | 0.156 | 0.004 | 2.5 | No |
[i] APC: Annual percentage change; AAPC: Average annual percentage change; SDI: Socio‑demographic index; WHO: World Health Organization; AFRO: African region; AMRO: Region of the Americas; EMRO: Eastern Mediterranean region; EURO: European region; SEARO: South‑East Asia region; WPRO: Western Pacific region.