
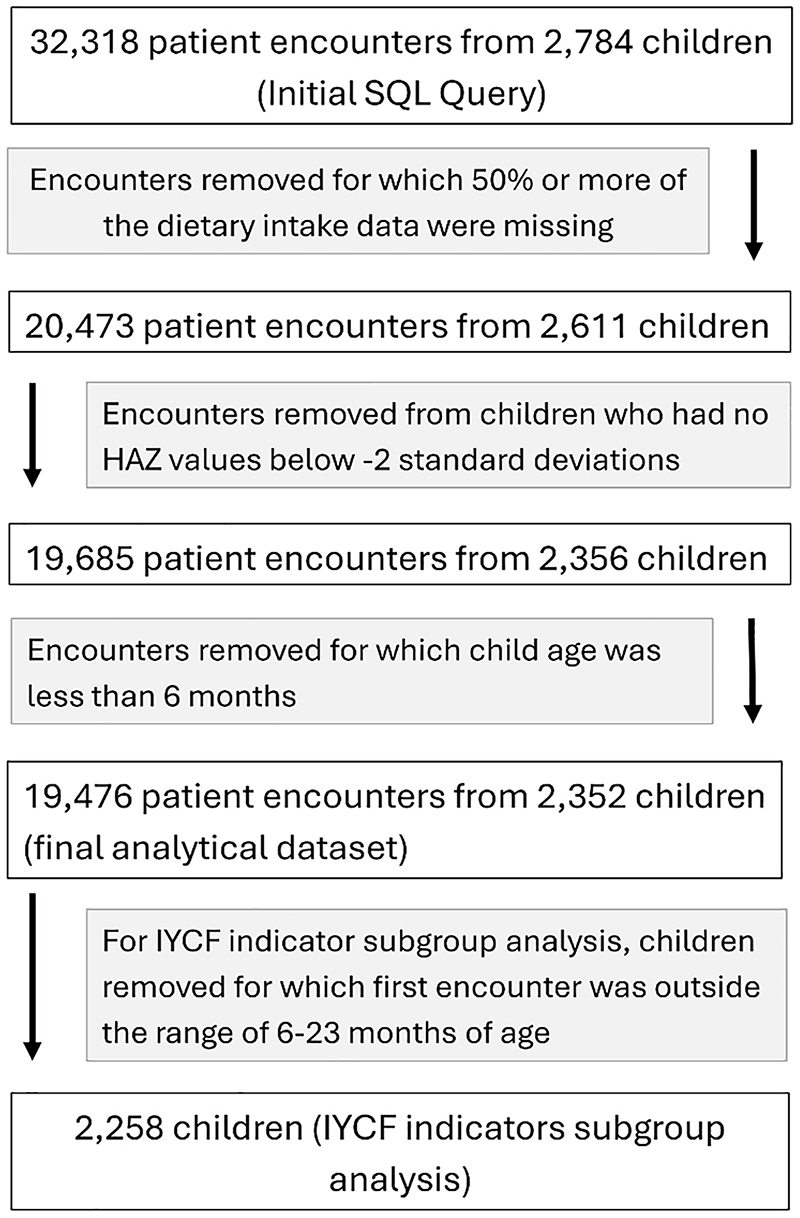
Figure 1
Flowchart of arrival at final analytical dataset.
Table 1
Description upon program enrollment of a clinical cohort of children with stunting in Guatemala, overall and by department.
| CHARACTERISTIC | CHIMALTENANGO N = 9421 | SOLOLá N = 4061 | SUCHITEPéQUEZ N = 4451 | QUETZALTENANGO N = 5581 | TOTAL N = 2,3521 |
|---|---|---|---|---|---|
| Age (months) | 12.9 (8.8, 17.0) | 13.2 (8.6, 18.6) | 13.7 (9.1, 18.3) | 15.5 (12.2, 19.2) | 13.8 (9.6, 18.1) |
| Female | 433 (46%) | 199 (49%) | 225 (51%) | 265 (47%) | 1,123 (48%) |
| Indigenous | 598 (98%) | 143 (99%) | 161 (88%) | 483 (88%) | 1,385 (93%) |
| Mayan language | 551 (74%) | 226 (73%) | 0 (0%) | 467 (84%) | 1,244 (69%) |
| Food insecurity | |||||
| Low | 238 (27%) | 75 (20%) | 103 (28%) | 162 (29%) | 579 (26%) |
| Moderate | 275 (31%) | 140 (36%) | 58 (16%) | 132 (24%) | 605 (28%) |
| High | 376 (42%) | 169 (44%) | 209 (56%) | 262 (47%) | 1,016 (46%) |
| Birthweight (kg) | 2.82 (2.70, 3.18) | 2.91 (2.70, 3.18) | 3.00 (2.73, 3.20) | 3.00 (2.70, 3.20) | 2.95 (2.70, 3.18) |
| Number of siblings | 2.00 (1.00, 4.00) | 2.00 (1.00, 3.00) | 2.00 (1.00, 3.00) | 2.00 (1.00, 3.00) | 2.00 (1.00, 3.00) |
| Homeowner | 453 (51%) | 203 (52%) | 69 (19%) | 366 (66%) | 1,092 (50%) |
| Height‑for‑age z‑score (HAZ) | –2.87 (–3.43, −2.43) | –2.88 (–3.55, −2.36) | –2.69 (–3.18, −2.31) | –2.94 (–3.62, −2.44) | –2.86 (–3.46, −2.39) |
| Height‑for‑age difference (HAD) | –7.27 (–8.84, −6.10) | –7.45 (–9.39, −5.98) | –7.06 (–8.74, −5.69) | –7.95 (–9.63, −6.51) | –7.43 (–9.19, −6.14) |
| Moderate acute malnutrition | 26 (2.8%) | 16 (3.9%) | 29 (6.6%) | 9 (1.6%) | 80 (3.4%) |
| Severe acute malnutrition | 13 (1.4%) | 9 (2.2%) | 7 (1.6%) | 3 (0.5%) | 32 (1.4%) |
[i] 1Median (Q1, Q3); n (%)
[ii] The clinical cohort includes 1 child belonging to a department which is not included in the table. Percentages are calculated among non‑missing observations.
Table 2
WHO Infant and Young Child Feeding Indicators from a clinical cohort of children with stunting in Guatemala, overall and by department.
| WHO INDICATOR | CHIMALTENANGO N = 9221 | SOLOLá N = 3861 | SUCHITEPéQUEZ N = 3931 | QUETZALTENANGO N = 5561 | TOTAL N = 2,2581 |
|---|---|---|---|---|---|
| Minimum dietary diversity | 438 (48%) | 134 (35%) | 99 (26%) | 236 (43%) | 907 (41%) |
| Minimum meal frequency | 687 (77%) | 314 (84%) | 222 (63%) | 486 (89%) | 1,710 (79%) |
| Minimum acceptable diet | 389 (43%) | 125 (33%) | 68 (18%) | 232 (42%) | 814 (36%) |
| Zero fruit or vegetable consumption | 214 (23%) | 73 (19%) | 173 (44%) | 122 (22%) | 583 (26%) |
| Egg and/or flesh food consumption | 579 (63%) | 195 (51%) | 174 (44%) | 347 (62%) | 1,295 (57%) |
| Sweet beverage consumption | 476 (52%) | 176 (46%) | 241 (61%) | 207 (37%) | 1,101 (49%) |
| Unhealthy food consumption | 345 (37%) | 120 (31%) | 98 (25%) | 281 (51%) | 844 (37%) |
[i] 1n (%). Only children for whom the first encounter was within the age range of 6–23 months are included. Indicators are based on data from the first visit after 6 months of age.
[ii] Of the 2,258 children, 1 child is from a department not included in the table.
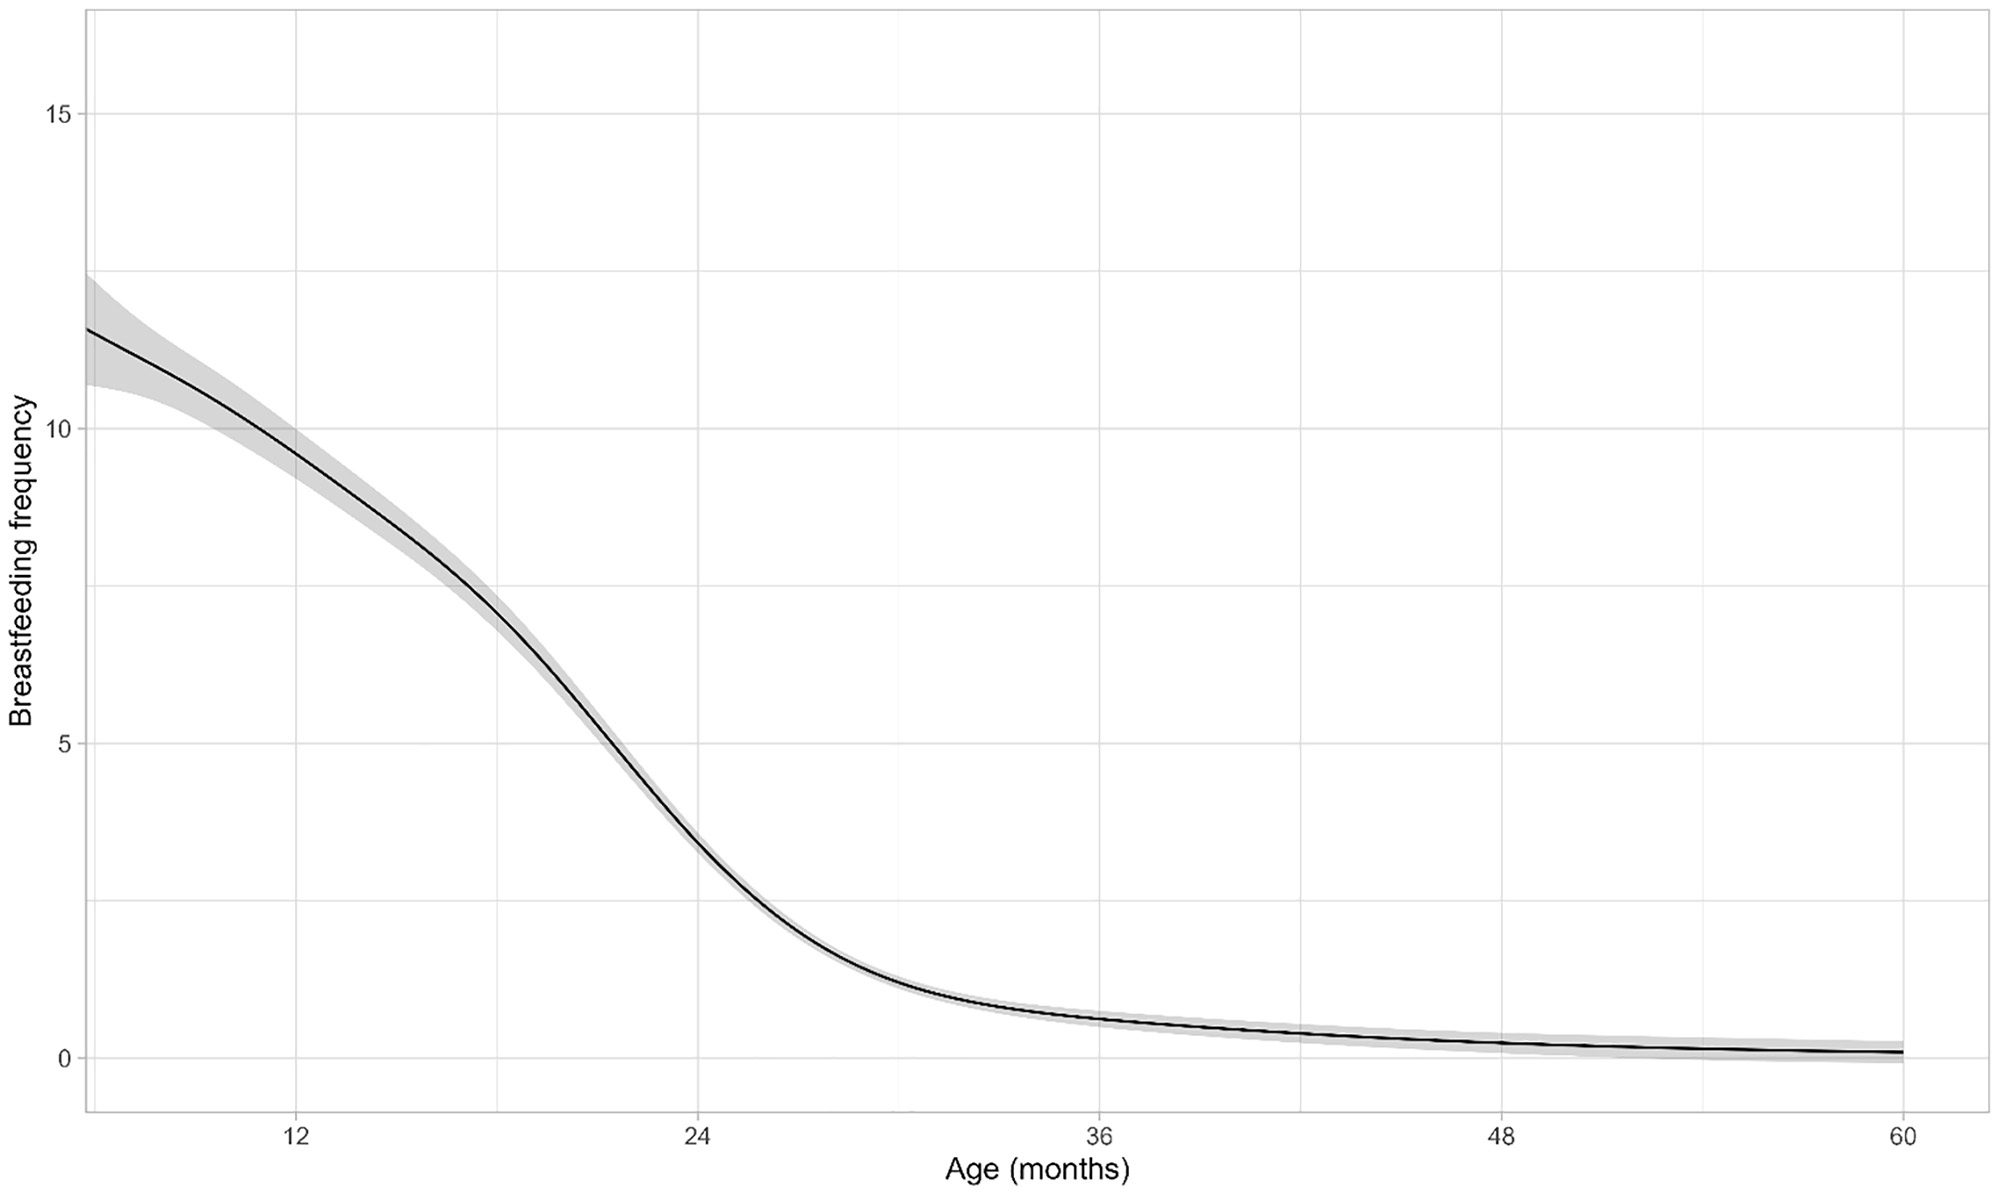
Figure 2
Prediction of breastfeeding frequency from 6–60 months in a clinical cohort of children with stunting in Guatemala using generalized additive mixed modeling (GAMM).
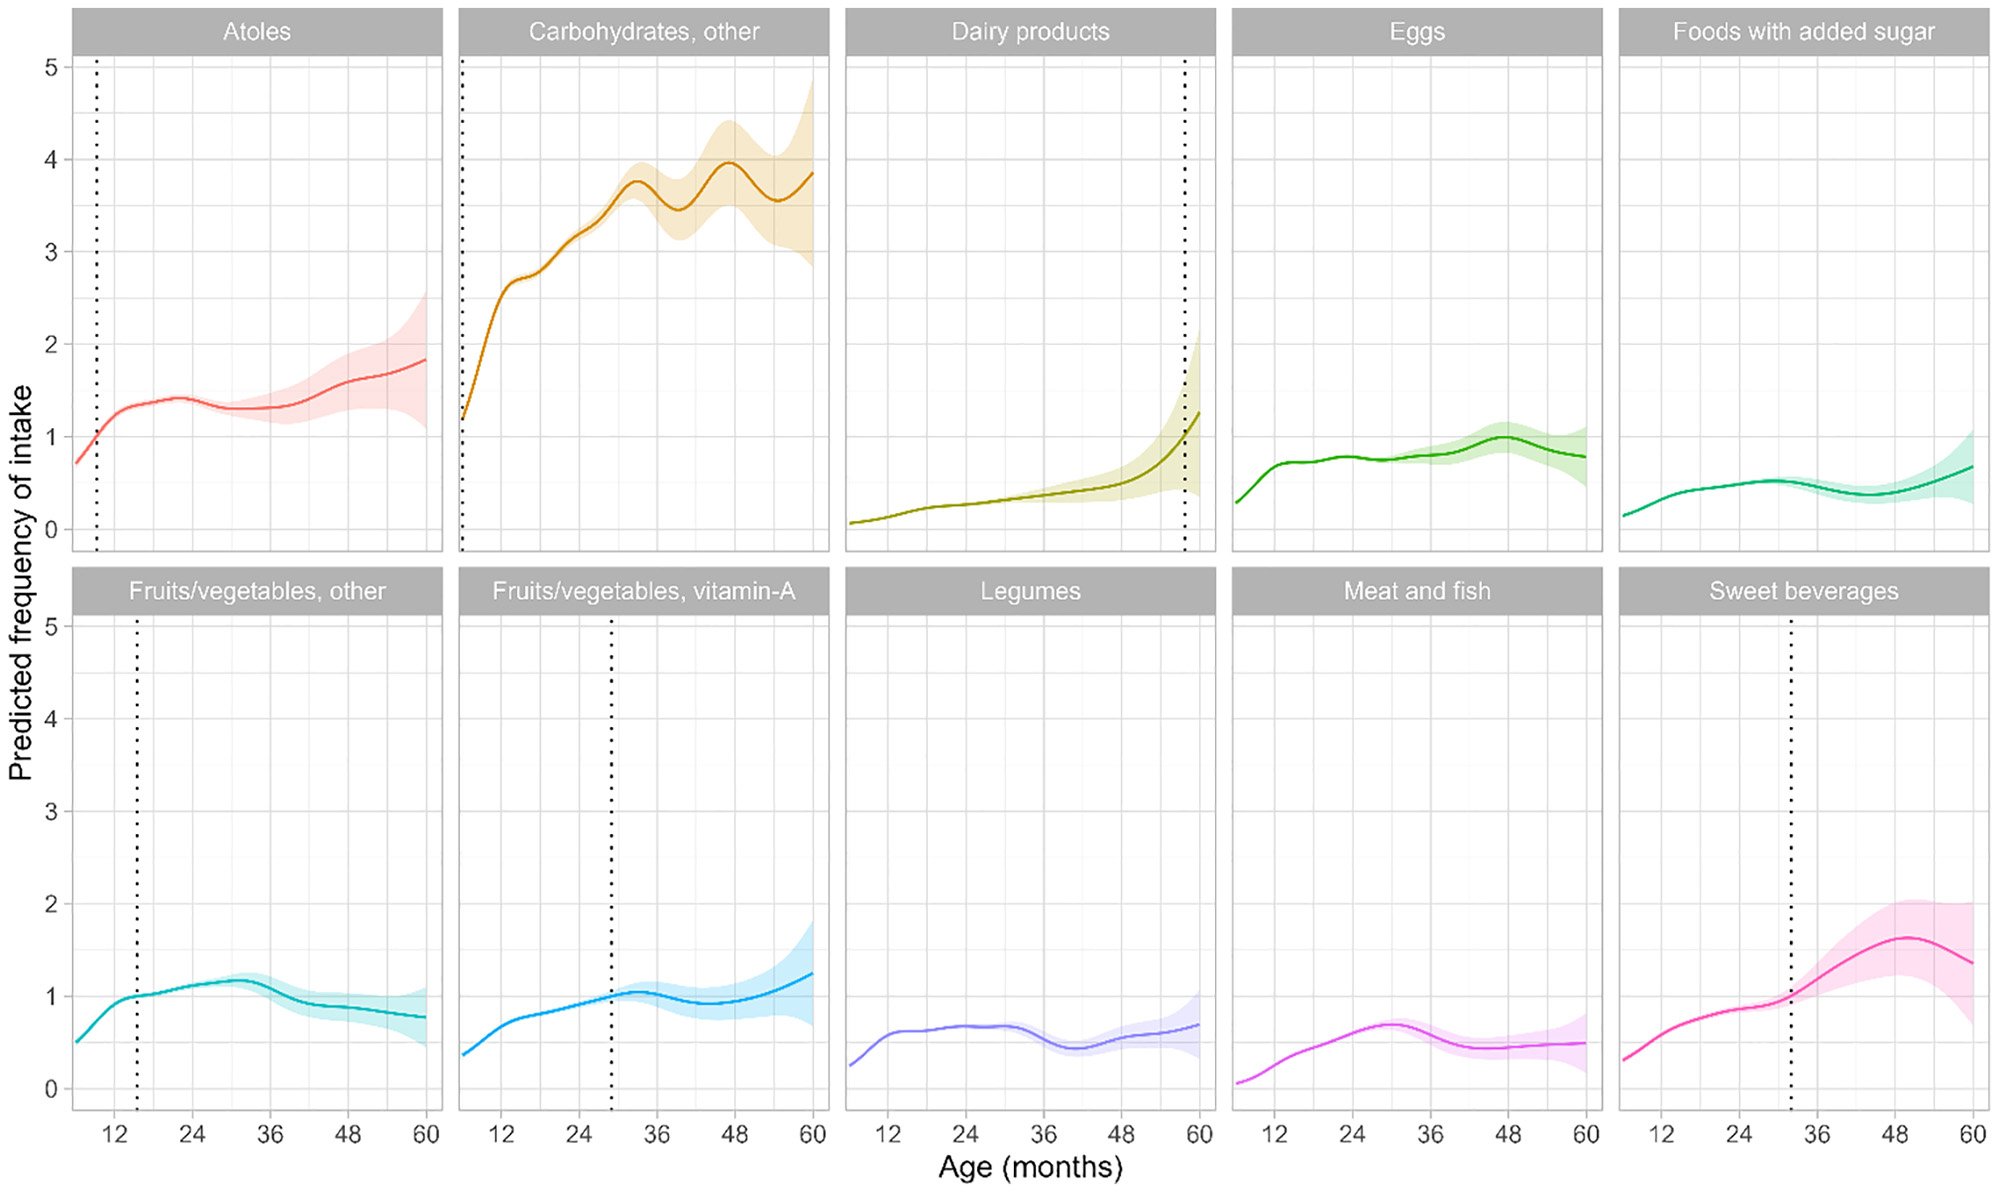
Figure 3
Prediction of intake frequency of different food groups from 6–60 months in a clinical cohort of children with stunting in Guatemala using generalized additive mixed modeling (GAMM).
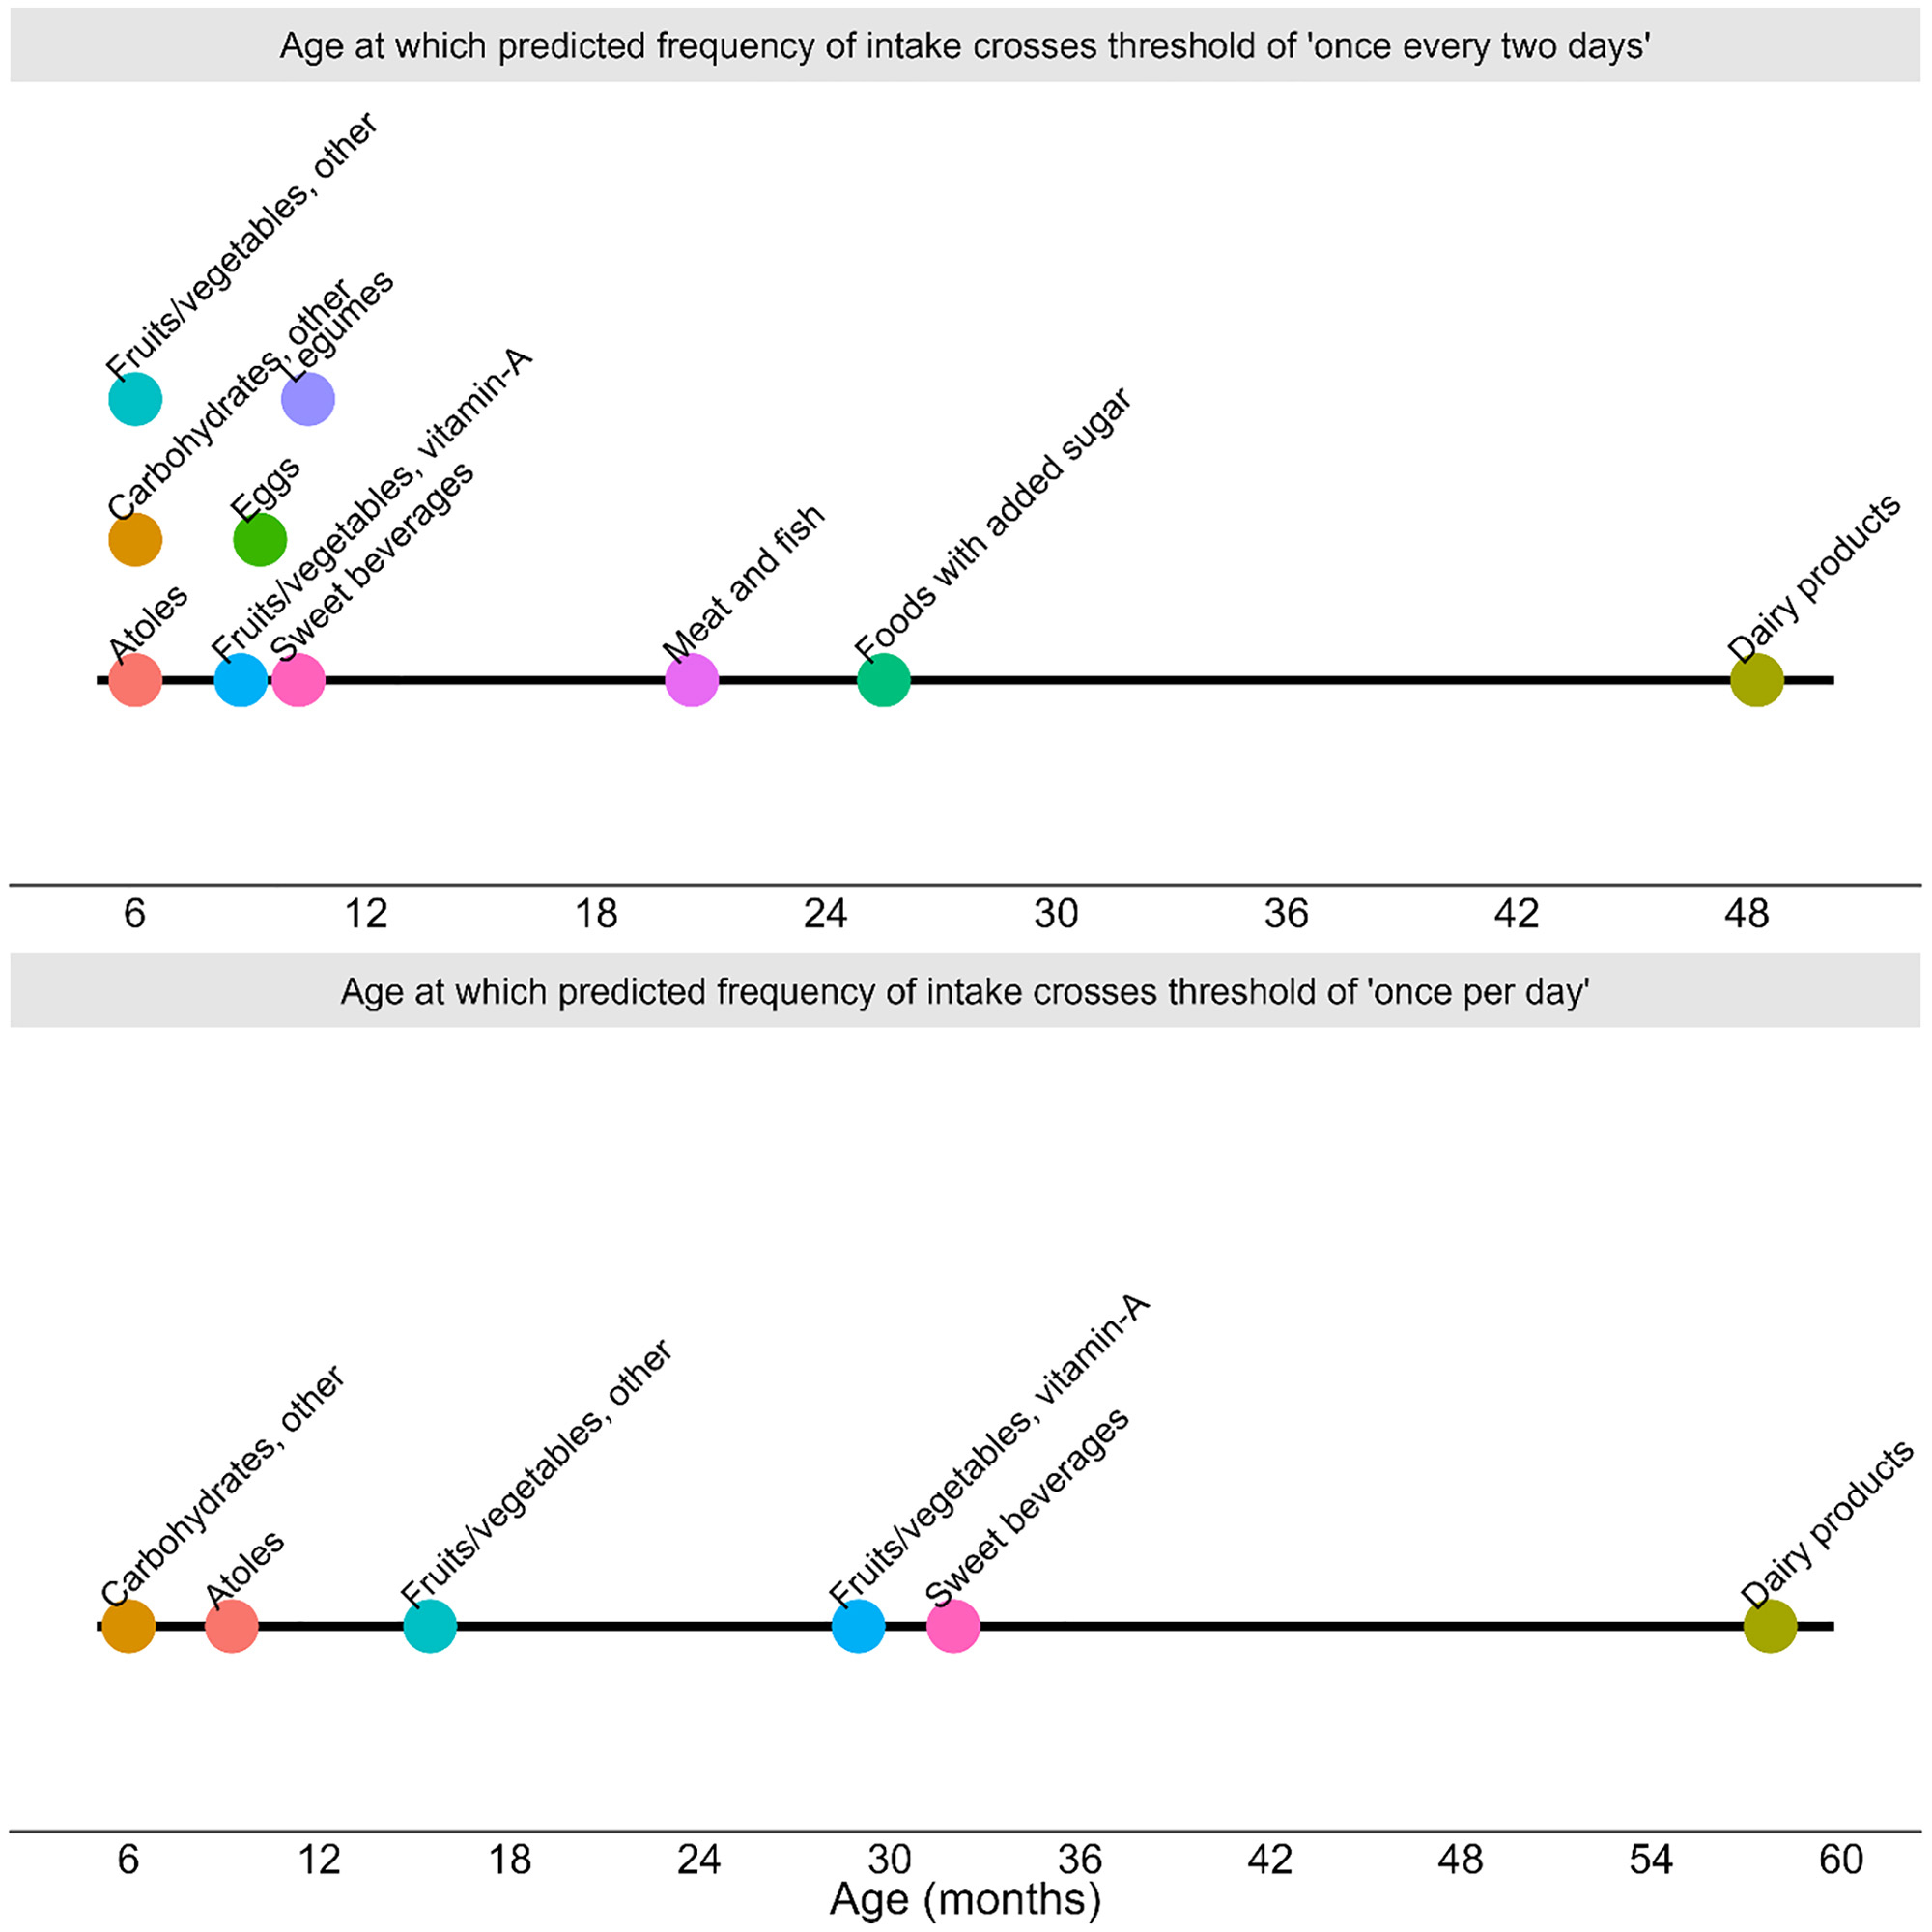
Figure 4
Age at which predicted frequency of intake of different food groups crossed thresholds of once every two days and once per day in a clinical cohort of children with stunting in Guatemala.
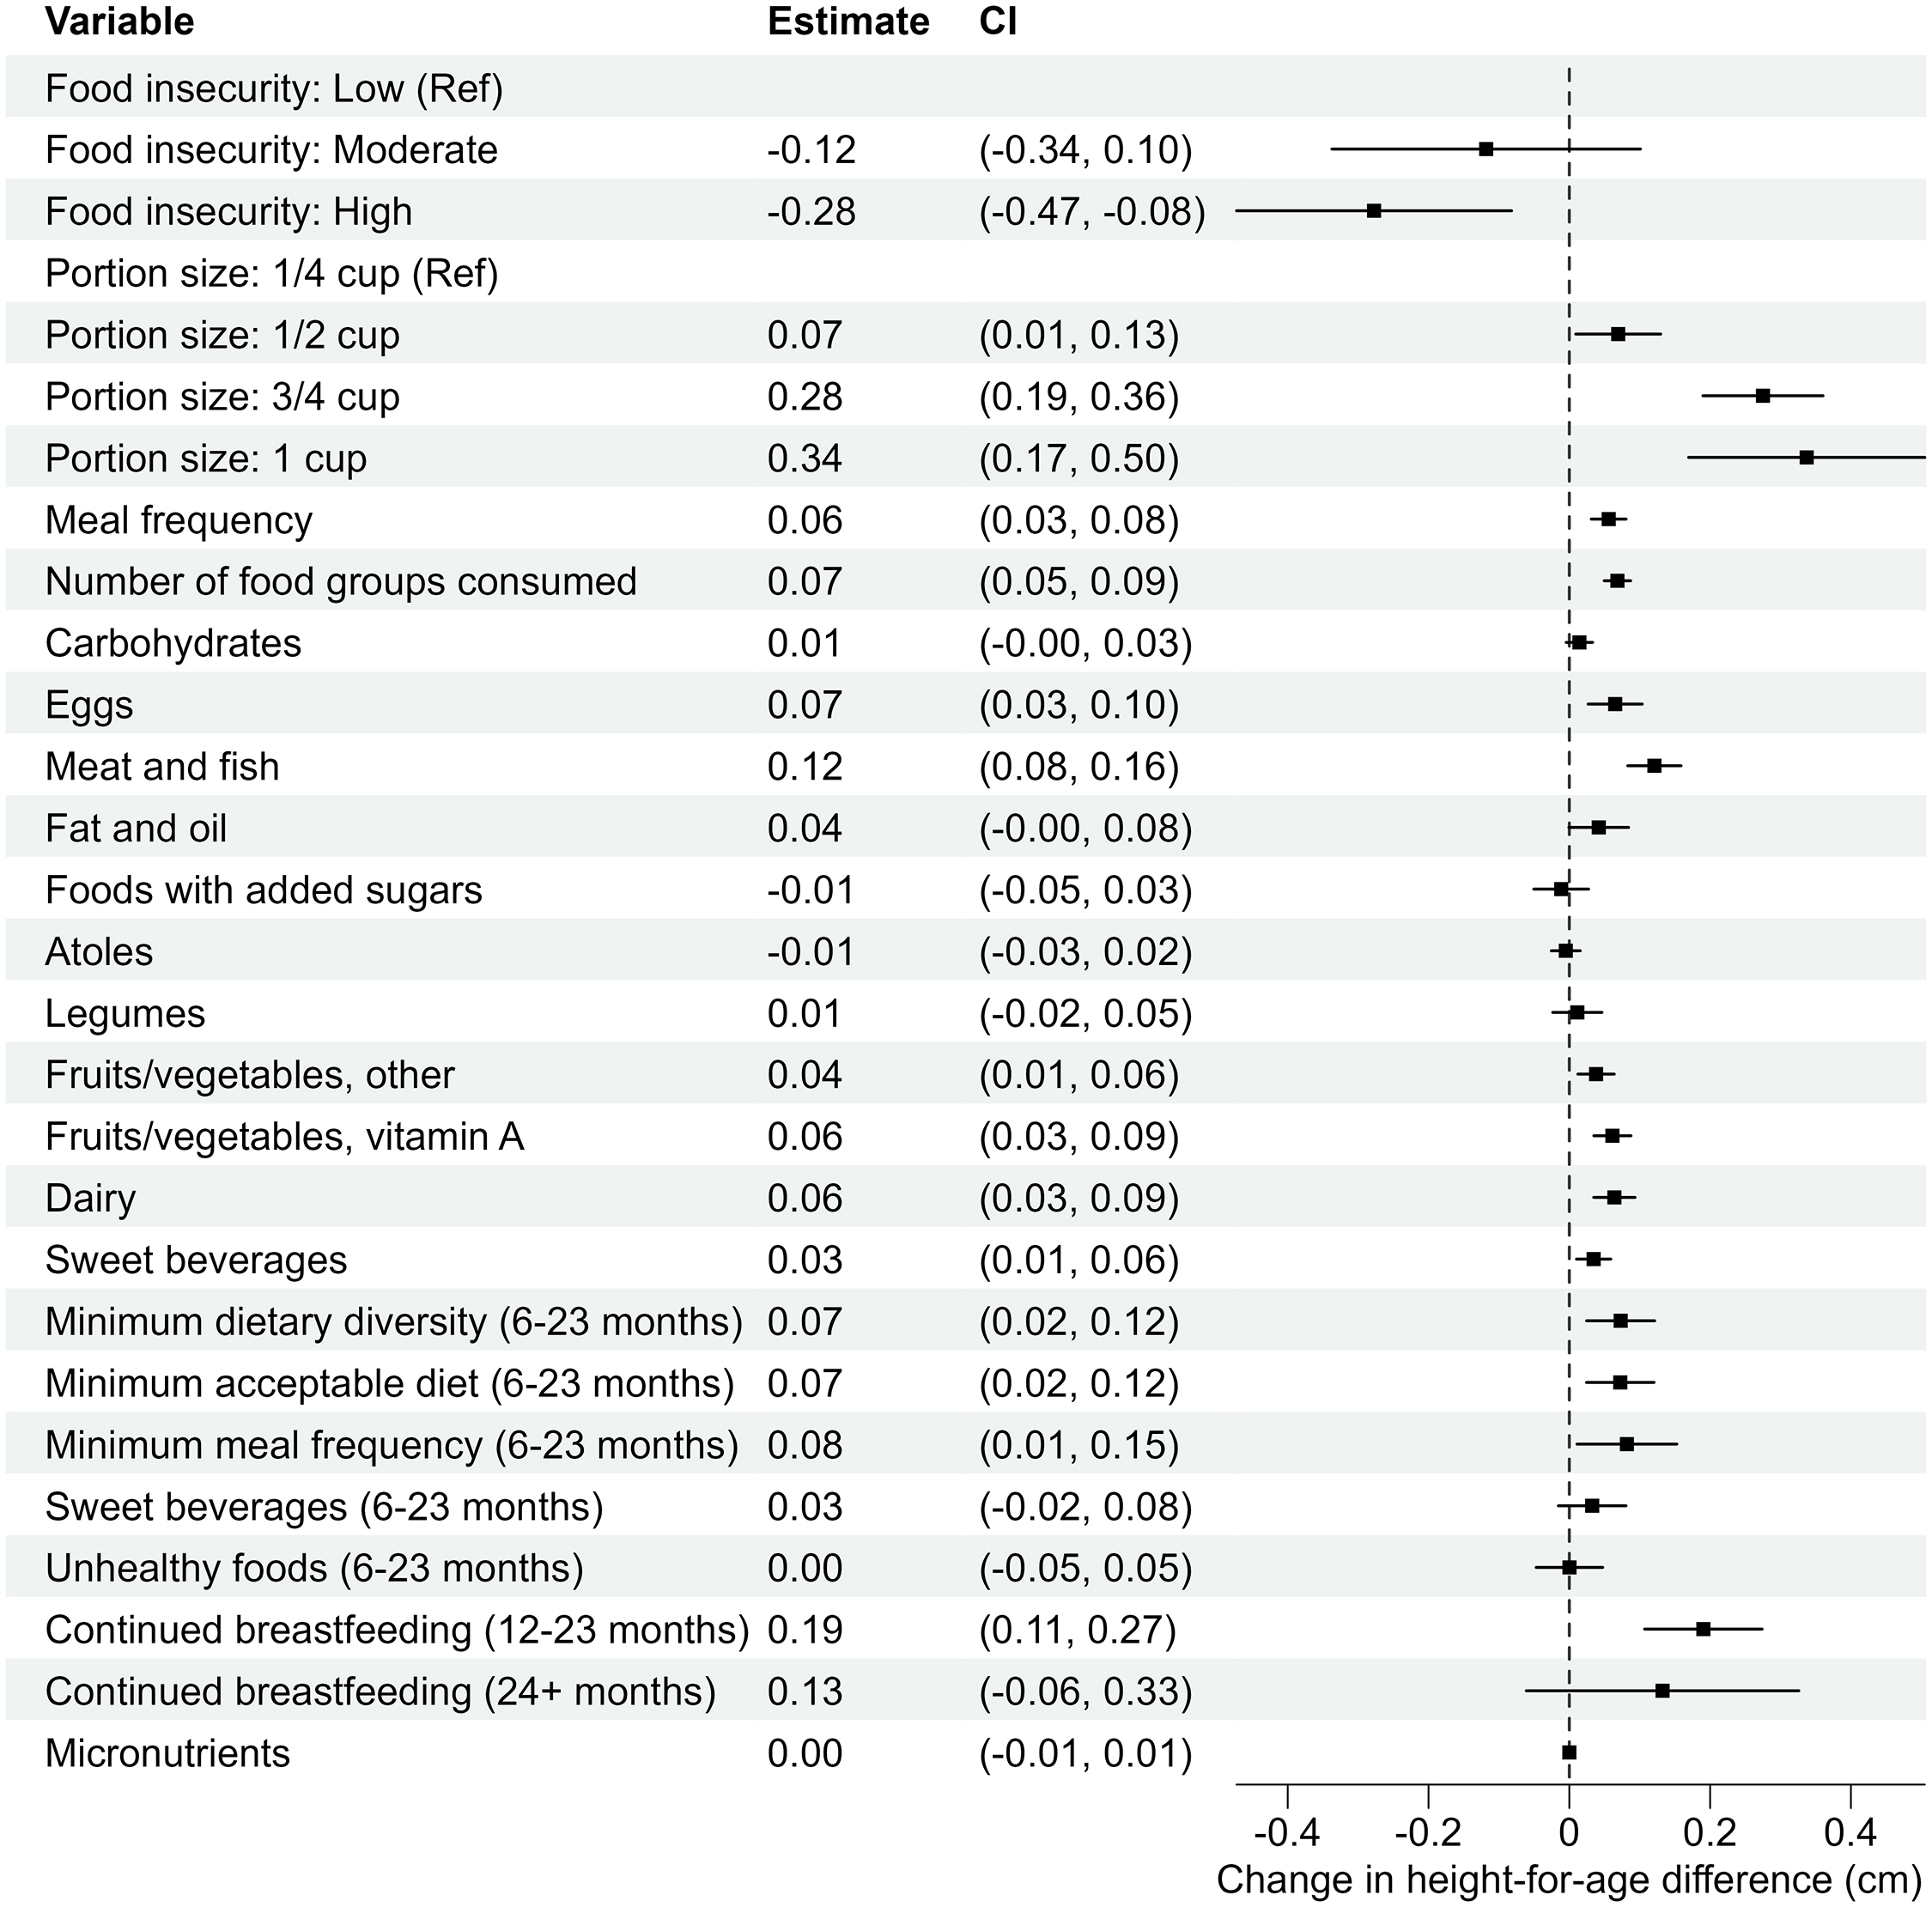
Figure 5
Associations between dietary and breastfeeding factors and linear growth (cm) in a clinical cohort of children with stunting in Guatemala using linear mixed effects modeling and controlling for age, sex, and birthweight.