
Table 1
Modified MIF socio‑economic status (SES) questionnaire.
This SES questionnaire is structured to use nine brief, context‑specific questions to further classify patients into low, middle, or high socio‑economic groups within the rural Nigerian communities of this study’s focus. The aim of the questionnaire is to assess multiple domains that reflect various aspects of daily living conditions among these individuals.
| MODIFIED MIF SOCIO‑ECONOMIC STATUS (SES) QUESTIONNAIRE | |
|---|---|
| Question | Response Options (Score) |
| University (4) Post‑secondary education/technical college/polytechnic (3) Secondary education (2) Primary education (1) Pre‑primary education (0) Never enrolled in school (–1) |
| Own cement home (with stairs) (4) Own cement home (bungalow) (3) Own thatched/mud home (2) Rent a home or apartment (1) Shared family home (apartment/flat) (0) Homeless (shelter/open streets) (–1) |
| Radio (1) TV (1) Cell phone (1) Generator (1) Cable or Satellite (1) |
| 1 per bed (4) 2 per bed (3) 3 per bed (2) 1–3 per mat/mattress on the floor/hard floor (1) >3 people per bed (0) |
| Vendor, bottled water, or personal bore hole (4) Pipe, tap water, or shared bore hole (3) Well water (2) River, lake, or stream (1) Rainwater (0) |
| Own toilet (manual/self‑flushing) (4) Own toilet (flush with bucket) (3) Shared toilet (<3 families) (2) Own pit/latrine (1) Public facilities (0) None/bush (–1) |
| Do you eat in a restaurant once or more a week? (4) Do you shop at a supermarket once a week or more? (3) None of the below (2) Charity or food program (1) Street aid and/or begging (0) |
| Every day (4) More than 3 times a week (3) Less than 3 times a week (2) Once a week (1) A few times a month (0) |
| By car (with air conditioning) (4) By car (no air conditioning) (3) On motorcycle (2) On bicycle (1) Public transport (0) On foot (–1) |
| Socio‑economic status (SES) score: −4 to 11 Low; 12 to 23 Middle; 24 to 36 High | |
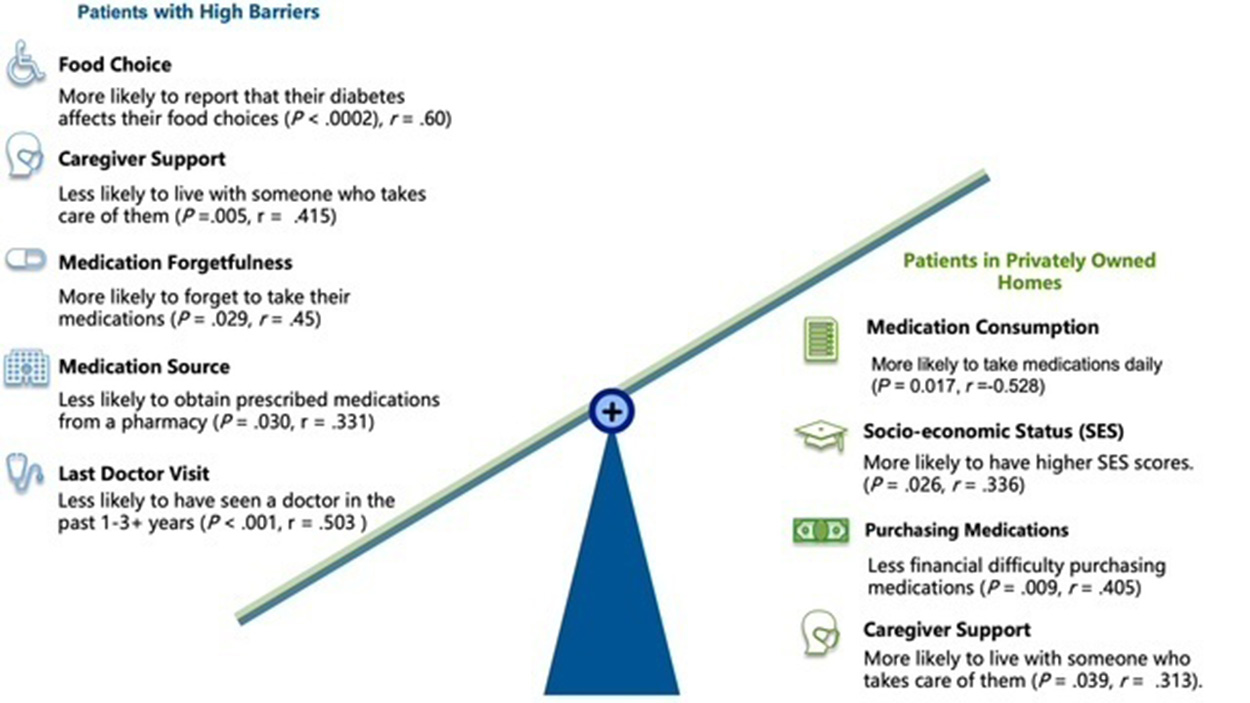
Figure 1
Direct associations with barriers to diabetes treatment scores.
This figure represents an infographic of significant direct associations between barriers to care and key socio‑economic factors among cataract patients. Patients with more barriers often faced financial difficulty and limited access to health needs, while those in private homes were associated with fewer barriers to care scores, and frequent medication consumption. Note: Significance denotes P values < 0.05.
Table 2
Diabetes burden questionnaire.
The diabetes burden questionnaire depicts a six‑question system to classify patients’ diabetes severity or risk as Low, Moderate, or High based on treatment adherence, prescribed therapy, and symptom burden.
| DIABETES BURDEN QUESTIONNAIRE | |
|---|---|
| Question | Response Options (Score) |
| Injections (1) Tablets (1) Both injections and tablets (−1) None (0) |
| My doctor has not prescribed any diabetes medication (1) Only on some days per week (1) Once a week or monthly (0) Daily, after every meal (–1) |
| Once a week or monthly (1) Few times a week (0) Daily or after every meal (–1) |
| None (1) Tingling/numbness of legs and fingers (0) Blurry vision or dizziness (–1) Ulcers or non‑healing wounds (–1) |
| Few times a week (1) Once a week or monthly (0) Daily, after every meal (–1) |
| No (0) Yes (–1) |
| Diabetes Burden Score: −6 to –3 High; −2 to 1 Moderate; 2 to 5 Low | |
Table 3
Barriers‑to‑care questionnaire.
The barriers‑to‑care questionnaire aims to measure the impact of various practical, cultural, and health system barriers and subsequent interference with self‑management of diabetes among patients within rural Nigeria.
| BARRIERS‑TO‑CARE QUESTIONNAIRE | |
|---|---|
| Question | Response Options (Score) |
| No (1) Sometimes (0) Yes (−1) |
| Yes (1) Sometimes (0) No (−1) |
| No (1) Sometimes (0) Yes (−1) |
| No (1) I do not, but a family member I live with does (0) Yes (−1) |
| Do not have any issues walking or driving to the pharmacy (1) Can walk, but live too far from the closest clinic/pharmacy (0) Use a wheelchair or walking stick and no car (−1) |
| <1 time per week (0) Less than 3–4 times per week (1) ≥3–4 times per week (−1) |
| Yes, specify (1) No (0) |
| Never or once in a day (1) 2 or more times a week (0) Stopped taking them (−1) |
| ≥1 time per week (1) Monthly (0) <1 time per week (−1) |
| Every day (1) About 3–4 times per week (0) <2 times per week (−1) |
| Open response (no score) |
| <2 months (4) 3–6 months (3) 6–12 months (2) 1–3 years (1) >3 years (0) |
| From a pharmacy/chemist with a prescription (3) From a pharmacy/chemist without a prescription (2) From a friend or relative (1) Other, specify (0) |
| Barriers‑to‑care score: −9 to 0 High; 1 to 10 Moderate; 11 to 17 Low | |
Table 4
Post‑assessment clinical information.
The MIF original post‑assessment clinical information survey was used by clinicians to document systemic comorbidities and corresponding severity among patients within the study in a single standardized format to allow for comparison.
| POST‑ASSESSMENT CLINICAL INFORMATION | ||
|---|---|---|
| SECTION | ITEM | DESCRIPTION/OPTIONS |
| Medications | Current medications being taken | Open response |
| Laboratory/vitals | Hemoglobin (Hgb) | ______ mg/dL |
| Blood pressure | ______ mmHg | |
| Blood glucose | ______ mg/dL | |
| Intraocular pressure (IOP) OD | ______ mmHg | |
| Intraocular pressure (IOP) OS | ______ mmHg | |
| Other findings | Other | Open response |
| Cataracts staging | Cataracts OD | ______ (mild: trace, 1+, 1–2+; mature: 3+ and higher; coding for dataset: mild = 0, mature = 1) |
| Cataracts OS | ______ (mild: trace, 1+, 1–2+; mature: 3+ and higher; coding for dataset: mild = 0, mature = 1) | |
| Medical diagnosis (check all that apply) | Diabetes | |
| Anemia | ||
| Cataracts | ||
| Glaucoma | ||
| Hypertension | ||
| Other | ______________________________ | |
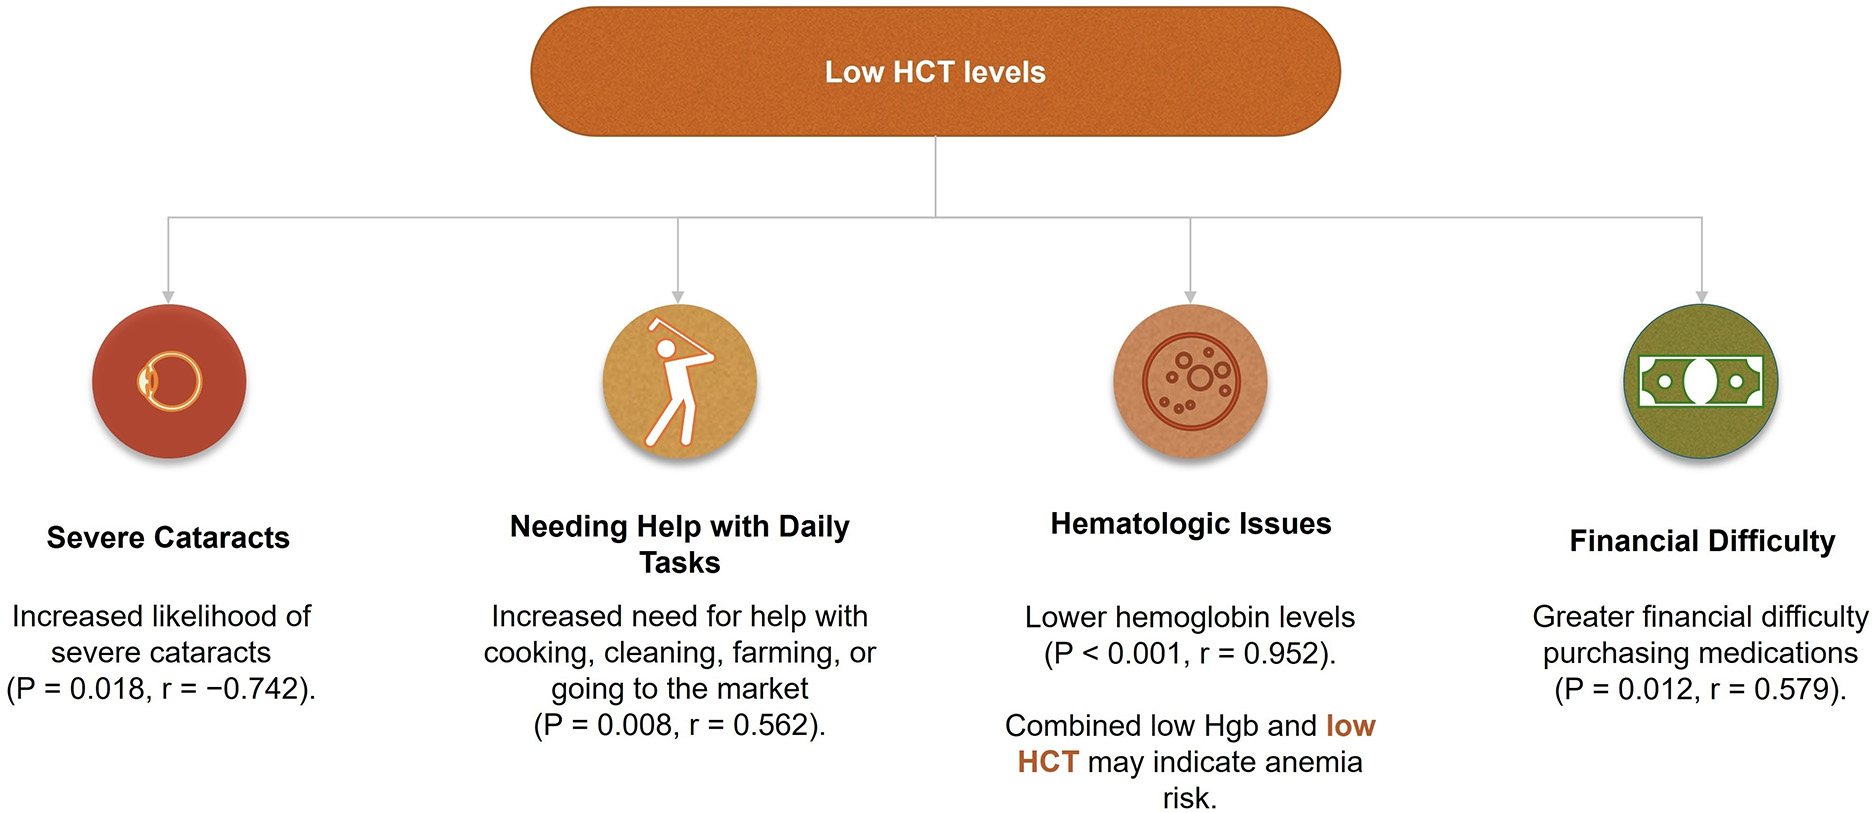
Figure 2
Low hematocrit (HCT) levels and associated factors.
In this figure, an infographic summarizing key factors associated with lower HCT levels is shown. There was an association between low HCT and herb use (p = 0.041). Patients with low HCT were also more likely to have severe cataracts (p = 0.018), need help with daily tasks (p = 0.008), have lower hemoglobin levels (p < 0.001), and experience greater financial difficulty purchasing medications (p = 0.012). These findings suggest that anemia risk may be compounded by both clinical, behavioral, and socio‑economic challenges in this population.
Note: HCT denotes Hematocrit
Table 5
Drinking water source correlations.
This table examined correlations between drinking water source and any other significantly associated variables. Water source was scored ordinally, where higher scores indicate a private water source (with a score of 3 = pipe/tap/shared borehole; while 4 = vendor/bottled/personal borehole). The highest IOP’s 95% CI for Spearman’s r was computed using the DescTools package in R. Sample size (n) varied across the rows due to missing data for some individual variables. A p‑value of less than 0.05 was considered statistically significant. Highest IOP was defined as the greater value between IOP measured in the right eye (OD) and left eye (OS).
| DRINKING WATER SOURCE CORRELATIONS | |||||
|---|---|---|---|---|---|
| EXPOSURE | ASSOCIATED VARIABLE | N | SPEARMAN R | 95% CI | P‑VALUE |
| Private sources of drinking water | Higher SES score | 45 | 0.532 | 0.274–0.718 | <0.0002 |
| More personal electronics owned | 44 | 0.460 | 0.180–0.671 | 0.002 | |
| Improved toilet facilities | 45 | 0.406 | 0.119–0.630 | 0.006 | |
| Less frequent or no diabetes medications prescribed by their doctor | 23 | 0.503 | 0.102–0.764 | 0.014 | |
| Highest IOP | 22 | 0.514 | 0.117–0.769 | 0.015 | |
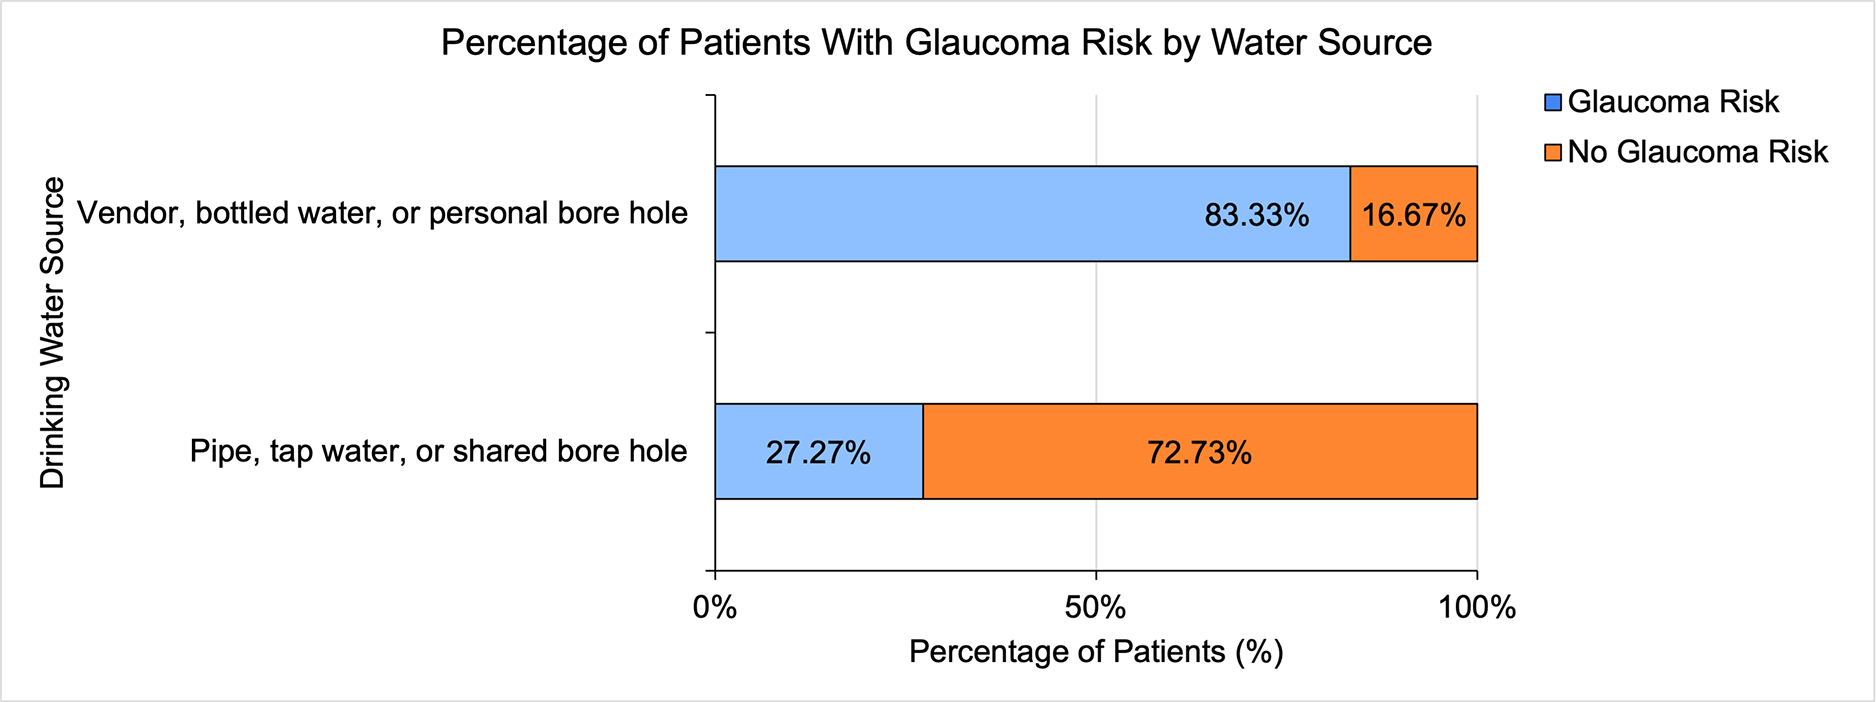
Figure 3
Drinking water source and risk for glaucoma.
This figure depicts the association between drinking water source and the risk for glaucoma. Each bar shows the percentage of patients within a drinking‑water source category who are at risk for glaucoma, IOP greater than 21 mmHg in either eye. Patients using “Vendor, Bottled, or Personal Bore Hole” water had the highest glaucoma risk (83.33%), while Pipe/Tap or Shared Bore Hole users had the lowest observed glaucoma risk (27.27%). Bars are grouped by drinking‑water source, with glaucoma risk status indicated by color (blue for risk and orange for no risk). Note: IOP denotes intraocular pressure. Glaucoma risk is defined by IOP > 21 mmHg, while No Glaucoma risk is defined by IOP ≤ 21 mmHg.
Table 6
Partial correlation sensitivity analysis of the association between drinking water source and highest IOP after controlling for diabetes related confounders.
To determine whether the association between drinking water source and highest IOP could be explained by diabetes‑related factors or nutrition, partial Spearman correlations were run controlling for four covariates individually: prescribed medication use, medication adherence, measured blood glucose, and hemoglobin. The unadjusted correlation between water source and highest IOP was r = 0.51, p = 0.015, n = 22. After controlling for each covariate one at a time, the association remained statistically significant across all four models. Subsample sizes varied due to missing covariate data. The medication adherence model was based on a smaller subsample (n = 10), so a leave‑one‑out sensitivity analysis confirmed this result was not driven by any single case, with r ranging from 0.73 to 0.91 across all iterations. Highest IOP denotes greatest IOP taken from OS and OD; r = Spearman rank correlation coefficient.
| CONFOUNDER CONTROLLED | UNADJUSTED R | UNADJUSTED P | ADJUSTED R | ADJUSTED P | CHANGE IN R | N | INTERPRETATION |
|---|---|---|---|---|---|---|---|
| Prescribed diabetes medication | 0.51 | 0.015 | 0.48 | 0.040 | −0.03 | 20 | Water source association to IOP remains significant after controlling for prescribed diabetes medications |
| Medication adherence | 0.51 | 0.015 | 0.78 | 0.013 | +0.27 | 10 | Water source association with IOP remain significant after controlling for medication adherence. This was based on a small subsample (n = 10); so a leave‑one‑out sensitivity analysis confirmed stability (r ranged 0.73–0.91). |
| Measured blood glucose (mg/dL) | 0.51 | 0.015 | 0.47 | 0.043 | −0.04 | 20 | Water source association with IOP remains significant after controlling for measured blood glucose. |
| Hemoglobin levels (g/dL) | 0.51 | 0.015 | 0.48 | 0.039 | −0.03 | 20 | Water source association with IOP remains significant after controlling for hemoglobin as a proxy for nutrition. |
Table 7
Statistical analyses assessing correlations between diabetes burden score and individual barriers to care after adjusting for social determinant risks as confounders.
| BARRIER‑TO‑CARE VARIABLE | β | P‑VALUE | INTERPRETATION |
|---|---|---|---|
| Do you have financial difficulty purchasing your diabetes medications?a | 0.686 | 0.032* | Having no financial difficulty purchasing medications was associated with a 0.686‑unit improvement in diabetes burden score, indicating lower diabetes burden. |
| Are there people who live with you and take care of you at home?b | 0.592 | 0.055† | Having in‑home caregivers was associated with a 0.592‑unit improvement in diabetes burden score, indicating lower diabetes burden, but to be interpreted with caution. |
| Do you need help to cook, clean, farm/go to the market on your own? | 0.338 | 0.322 | No statistically significant association detected in this sample. |
| Do you smoke? | 0.338 | 0.658 | No statistically significant association detected in this sample. |
| What barriers do you encounter when traveling to clinic/pharmacy? | 0.500 | 0.258 | No statistically significant association detected in this sample. |
| How many times did you drink soda or take sweets in the last week? | 0.161 | 0.798 | No statistically significant association detected in this sample. |
| Use of herbs or natural remedies | 0.392 | 0.491 | No statistically significant association detected in this sample. |
| Frequency of forgetting diabetes medications | −0.470 | 0.374 | No statistically significant association detected in this sample. |
| Frequency of blood glucose self‑monitoring | −0.424 | 0.519 | Not statistically significant. Patients at higher risk may monitor more frequently, which could explain the change in direction. |
| How often do you exercise? | 0.583 | 0.081† | More frequent exercise was associated with a 0.583‑unit improvement in diabetes burden score, but did not reach statistical significance. |
| Time since last doctor visit | 0.139 | 0.447 | No statistically significant association detected. |
| Where do you obtain medication? | −0.568 | 0.118 | No statistically significant association detected. Patients with more severe diabetes burden may use formal/prescribed sources more, which could explain the direction. |
[i] a For financial difficulty, “No” = +1 coding; a positive β reflects that those without financial difficulty had a more positive diabetes burden score, which means lower burden.
[ii] b For in‑home caregivers, “Yes” = +1 coding, so a positive β reflects that those with caregivers had a more positive diabetes burden score, which means lower burden.
[iii] Linear regression models examined the association between each barrier‑to‑care variable and diabetes burden score after adjusting for type of home, main source of drinking water, and main source of transportation. This analysis tells us which specific barriers to care are associated with worse diabetes burden in this population after removing the influence of socio‑economic differences between patients, so that any association found reflects a consistent barrier itself rather than manifestations of the patient’s overall poverty level. Diabetes burden score grading and barriers‑to‑care response coding are reported in Tables 2 and 3, respectively. *Asterisk indicates statistically significant results (p < 0.05); †Daggers indicate results that approached but did not reach the α = 0.05 threshold. Non‑significant results may reflect limited statistical power due to sample size rather than a true absence of association. Note: β denotes the unstandardized regression coefficient.
Table 8
Conclusion table on key findings ranked by significance.
This table presents key findings from this study ranked by statistical strength and clinical significance, with the conclusion column addressing their relevance to diabetes burden and cataract outcomes among patients in Imo State, Nigeria. Where multiple associations contribute to a single finding, the strongest p‑value was used for ranking. The caregiver finding (Rank 3) did not reach conventional statistical significance for diabetes severity (p = 0.055) but is included given its borderline significance and two additional significant outcomes.
| RANK | KEY FINDING | STATISTICAL EVIDENCE | CONCLUSION |
|---|---|---|---|
| 1 | Private drinking water source is associated with elevated IOP, independent of medication behavior, glycemic status, hemoglobin levels, and overall SES. |
| Private drinking water was consistently associated with elevated IOP, making it the most novel finding in this study. The association held after controlling for medication behavior, glycemic status, hemoglobin, and overall SES, showing that water source has an independent association with IOP that cannot be explained by how well or poorly patients manage their diabetes or by general wealth. Water source and blood glucose were not significantly associated with each other (r = 0.13, p = 0.491, n = 32), and blood glucose was not significantly associated with IOP (r = −0.44, p = 0.089, n = 16), suggesting that glycemic status alone doesn’t explain the link between water source and IOP. Therefore, water source may represent a genuinely independent environmental concern for glaucoma risk in this population that warrants further investigation. |
| 2 | Financial difficulty purchasing medications associated with worse diabetes burden. |
| Financial difficulty was the strongest and only statistically significant predictor of diabetes burden in SES‑adjusted analyses. When patients cannot afford medications, their blood glucose stays elevated, which speeds up damage to the blood vessels supplying the lens and retina. This barrier also compounded others; patients with financial difficulty were less likely to have caregivers at home and more likely to need help with daily tasks. |
| 3 | Caregiver presence associated with better diabetes burden, lower barriers to care, and higher hemoglobin simultaneously. |
| Caregiver presence was the only factor in this study linked to better outcomes across all three domains at once. Patients with caregivers had better diabetes management, fewer barriers to care, and healthier Hgb. Each of these pathways connects back to cataract risk since better diabetes management slows cataract lens clouding, fewer barriers means more consistent care, and improved hemoglobin reduces the compounding effect of anemia on blood vessels already damaged by diabetes. |
| 4 | Low hematocrit directly associated with more advanced cataracts. |
| Low hematocrit was directly linked to more advanced cataracts in this sample. When a diabetic patient also has anemia, the blood carries less oxygen to the already compromised vessels supplying the lens and retina. This double burden of diabetic vascular damage and reduced oxygen delivery accelerates lens clouding. Addressing anemia through supplements and locally available nutritional interventions is one of the most modifiable clinical actions in this study. |
| 5 | Need for daily task help associated with advanced cataracts; transportation limitations linked to lower SES and greater struggles farming, cooking, cleaning, and traveling for food. |
| Patients who needed help with daily tasks had more advanced cataracts despite having seen a doctor recently. The issue may not be solely primary care access, but access to an eye specialist. Patients with limited transportation were also more likely to struggle with daily tasks, and those daily task limitations were linked to worse cataract outcomes. Bringing specialist eye care closer to the community is the most direct way to address this. |
| 6 | Herb use associated with lower hematocrit (HCT). |
| Herb users were more likely to have lower HCT, which is directly linked to worse cataract outcomes in this sample. Herb use likely reflects socio‑economic living conditions. Since the use of herbs with metformin and sulfonylureas are not currently monitored in this setting, there is a risk of undetected effects on blood glucose and HCT that should be addressed during doctor visits. |
| 7 | Patients in privately owned homes reported more daily medication use. Patients on more frequent medications had worse diabetes burden, but diabetes burden itself did not differ by socio‑economic status, suggesting that medication use reflects disease severity rather than socio‑economic advantage. |
| Patients in privately owned homes took diabetes medications more consistently than those in rented or shared homes. However, diabetes burden did not differ significantly between the two home ownership groups, nor by water source or overall SES score, meaning higher SES patients were not significantly less burdened by their diabetes. Across the full sample, patients who took medication most frequently and consistently had the worst diabetes burden, not the best, and this pattern held regardless of socio‑economic status. So, while better housing was linked to more consistent medication use, it was not linked to less severe diabetes, suggesting that adherence in this sample may simply reflect the need to manage more severe disease rather than leading to better control. |
Table 9
Modifiable aspects of this healthcare system to improve comorbidity burden and cataract outcomes.
The modifiable domains included in this table aim to improve cataract outcomes with respect to diabetes burden, anemia risk, and glaucoma risk among patients in Imo State, southeastern Nigeria. The recommended interventions are based on study findings and tailored to the local healthcare infrastructure and community practices for feasibility. Domains 1 through 5 address the barriers most prevalent among lower SES patients, where access and resource limitations contribute most to diabetes burden. Domains 6 through 9 address the factors most relevant to higher SES patients, where diabetes management behaviors and glaucoma risk are the main concerns.
| MODIFIABLE ASPECTS OF THIS HEALTHCARE SYSTEM TO IMPROVE COMORBIDITY BURDEN AND CATARACT OUTCOMES | ||||
|---|---|---|---|---|
| MODIFIABLE DOMAIN | STUDY FINDING | RECOMMENDED INTERVENTION | ANTICIPATED BENEFIT | INTERVENTION LEVEL |
| Lower SES Patients: Diabetes Burden and Resource Barriers impacting Cataract Outcomes | ||||
| 1. Medication access | ||||
| Financial difficulty (Purchasing diabetes medications) | Significant predictor of diabetes severity (β = 0.686, p = 0.032). Also linked to lower caregiver support and more need for daily task help. |
|
| Clinical system /Policy/Hospitals and pharmacies |
| 2. Nutrition and anemia | ||||
| Limited animal protein intake; low hemoglobin and hematocrit levels | Low Hgb and HCT were co‑associated. HCT associated with more advanced cataracts and greater difficulty with daily tasks. When a diabetic patient also has anemia, the damage diabetes causes to blood vessels gets worse, and the eyes and lens are directly affected. |
|
| Community/Policy |
| 3. Caregiver and social support | ||||
| Absence of in‑home caregiver support | Caregiver presence linked to better diabetes severity score (p = 0.055), lower barriers to care score (r = 0.415, p = 0.005), and higher hemoglobin (r = 0.46, p = 0.003) simultaneously. |
|
| Community/System/Policy |
| 4. Transportation and healthcare access | ||||
| Limited transportation options | Patients with transportation limitations had advanced cataracts despite recent doctor visits, suggesting the issue may be access to an eye care specialist rather than primary care. |
|
| System Community |
| 5. Culturally sensitive clinical care | ||||
| Regulated herb use; anemia screening | Patients managing their diabetes with “onugbu” were more likely to have lower hematocrit. Herb and drug interactions are not currently monitored in this setting. |
|
| Clinical system |
| 6. Higher SES patients: glaucoma risk and management of comorbidities impacting cataract outcomes | ||||
| Private drinking water source associated with elevated IOP | Private water access associated with higher SES yet higher IOP in both eyes (r = 0.51, p = 0.015). Novel finding suggesting environmental exposure may contribute to glaucoma risk beyond traditional clinical factors. |
|
| Community/Policy |
| 7. Exercise and lifestyle | ||||
| Low exercise frequency among medicated patients | Higher SES patients prescribed daily medications were less likely to exercise weekly (r = 0.47, p = 0.029), suggesting medication alone is not translating into healthier behaviors. |
|
| Clinical/Community |
| 8. Diabetes management quality | ||||
| High diabetes severity despite daily medication use | Patients on medications still had high diabetes burden scores, more chronic diseases, and frequent symptoms including blurry vision, dizziness, ulcers, and non‑healing wounds (r = 0.64, p < 0.00003). |
|
| Clinical system |
| 9. Blood glucose self‑monitoring | ||||
| Infrequent blood glucose self‑monitoring | 81% of patients (n = 29/36) reported monitoring less than once per week. No significant association was found between monitoring frequency and IOP, r = −0.25, p = 0.297, or any other clinical variable in this dataset. |
|
| Clinical/Community |