
Table 1
Distribution of continuous variables of the study population.
| VARIABLE | NUMBER (N) | MEAN (95% CI) | MEDIAN | MIN‑MAX | P‑VALUE |
|---|---|---|---|---|---|
| Age (years) | Total n = 326 | 48.1 (46.7–49.6) | 47.5 | 18–80 | |
| “Women (n = 35) | 39.0 (35.5–42.4) | 40.0 | 20–69 | <0.001 | |
| Men (n = 291) | 49.2 (47.7–50.8) | 49.0 | 18–80 | ||
| *With OD (n = 138) | 46.2 (43.8–48.6) | 44.0 | 19–76 | 0.007 | |
| Without OD (n = 168) | 50.4 (48.5–52.3) | 51.0 | 23–80 | ||
| Work Duration (years) | Total n = 326 | 24.1 (22.6–25.6) | 25.0 | 1–60 | |
| “Women (n = 35) | 9.1 (6.8–11.5) | 7.0 | 1–26 | <0.001 | |
| Men (n = 291) | 25.9 (24.4–27.4) | 27.0 | 1–60 | ||
| With OD (n = 138) | 20.3 (18.0–22.6) | 18.0 | 1–60 | <0.001 | |
| Without OD (n = 168) | 27.8 (25.9–29.7) | 30.0 | 1–57 | ||
| **Smoking (pack‑years) | Total n = 227 | 26.8 (24.0–29.4) | 22.0 | 1–100 | |
| With OD (n = 98) | 23.2 (19.4–27.0) | 20.0 | 1–100 | 0.031 | |
| Without OD (n = 119) | 29.1 (25.3–32.9) | 25.0 | 1–100 | ||
| Body Mass Index (kg/m²) | Total n = 326 | 26.8 (26.4–27.3) | 26.6 | 17.5–41.5 | |
| “Women (n = 35) | 26.8 (25.1–28.4) | 26.0 | 20–37 | 0.941 | |
| Men (n = 291) | 26.9 (26.4–27.3) | 26.7 | 17.5–41.5 | ||
| With OD (n = 138) | 26.5 (25.8–27.1) | 26.6 | 18.1–37.7 | 0.124 | |
| Without OD (n = 168) | 27.2 (26.5–27.9) | 26.7 | 17.5–41.5 | ||
| ***Post‑Retirement Duration (years) | Total n = 80 | 10.2 (8.4–12.1) | 9.0 | 1–36 | |
| “With OD (n = 30) | 12.1 (8.4–15.7) | 10.0 | 1–36 | 0.151 | |
| “Without OD (n = 47) | 9.3 (7.2–11.4) | 8.0 | 1–32 | ||
| Age at Workforce Entry (years) | Total n = 326 | 18.3 (17.7–18.8) | 18.0 | 8–50 | |
| “Women (n = 35) | 26.2 (23.3–29.1) | 25.0 | 15–50 | <0.001 | |
| Men (n = 291) | 17.3 (16.9–17.8) | 17.0 | 8–39 | ||
| With OD (n = 138) | 18.8 (17.8–19.9) | 18.0 | 8–50 | 0.076 | |
| Without OD (n = 168) | 17.7 (17.1–18.4) | 18.0 | 10–39 |
[i] *OD: Occupational Disease. Patients who did not complete the OD evaluation process (n = 20) were excluded from the analysis. Analyses were conducted only between patients diagnosed with an OD and those not diagnosed.
[ii] **Total number of current and former smokers: 227. After excluding patients who discontinued the diagnostic process, the total number of smokers in the groups with and without OD diagnosis was 217 (with OD/without OD = 98/119).
[iii] ***The number of patients presenting after retirement was 80, all male. No further analysis was conducted. The total number of individuals with and without an OD diagnosis was 77 (three patients discontinued the diagnostic process). The distribution was 30 with and 47 without an OD diagnosis.
[iv] “Estimates for very small subgroups (n < 50) should be interpreted with caution due to limited sample size.
Table 2
Odds ratios of factors associated with occupational disease risk according to multivariable logistic regression analysis.
| INDEPENDENT VARIABLE | B | S.E. | WALD χ² | OR [%95 CI] | P‑VALUE | |
|---|---|---|---|---|---|---|
| Work Duration (years) | 0.06 | 0.02 | 12.51 | 1.06 [1.03–1.09] | <0.001 | |
| Smoking (pack‑years) | 0.01 | 0.01 | 1.07 | 1.01 [0.99–1.03] | 0.300 | |
| BMI (kg/m²) | 0.00 | 0.04 | 0.00 | 1.00 [0.93–1.07] | 0.990 | |
| Age at Workforce Entry (years) | 0.02 | 0.04 | 0.27 | 1.02 [0.95–1.10] | 0.599 | |
| Gender (Female/Male) | −1.36 | 0.88 | 2.43 | 0.26 [0.05–1.42] | 0.119 | |
| Workplace Size | 5.67 | 0.129 | ||||
| Reference Category: Self‑Employed | 2–10 Workers | 1.15 | 0.73 | 2.46 | 3.15 [0.75–13.17] | 0.117 |
| 11–50 Workers | 0.74 | 0.38 | 3.68 | 2.09 [0.99–4.43] | 0.055 | |
| > 50 Workers | 0.72 | 0.41 | 2.97 | 2.04 [0.91–4.60] | 0.084 | |
| Income Level | 6.00 | 0.050 | ||||
| Reference Category: Minimum Wage | Above Minimum Wage | 0.93 | 0.47 | 3.83 | 2.52 [1.00–6.37] | 0.050 |
| Below Minimum Wage | 1.03 | 0.43 | 5.65 | 2.79 [1.20–6.49] | 0.017 | |
| Education Level | 1.76 | 0.623 | ||||
| Reference Category: Primary School* | Middle School | 0.23 | 0.82 | 0.07 | 1.26 [0.25–6.28] | 0.779 |
| High School | −0.34 | 0.93 | 0.14 | 0.71 [0.11–4.39] | 0.708 | |
| University | −0.09 | 0.82 | 0.01 | 0.91 [0.18–4.56] | 0.905 | |
| Marital Status (Married/Single) | −1.88 | 0.68 | 7.59 | 0.16 [0.04–0.58] | 0.006 | |
[i] B: Beta coefficient, S.E.: Standard Error, Wald: Wald statistic (tests each variable’s contribution to the model), OR: Odds Ratio, CI: Confidence Interval.
[ii] Note: The overall model significance was determined by the Omnibus Test (p < 0.001) and the Hosmer–Lemeshow Test (p = 0.241).
[iii] *Primary school was selected as the reference category. The group with no formal education (n = 6) was not used as a reference due to the small sample size.
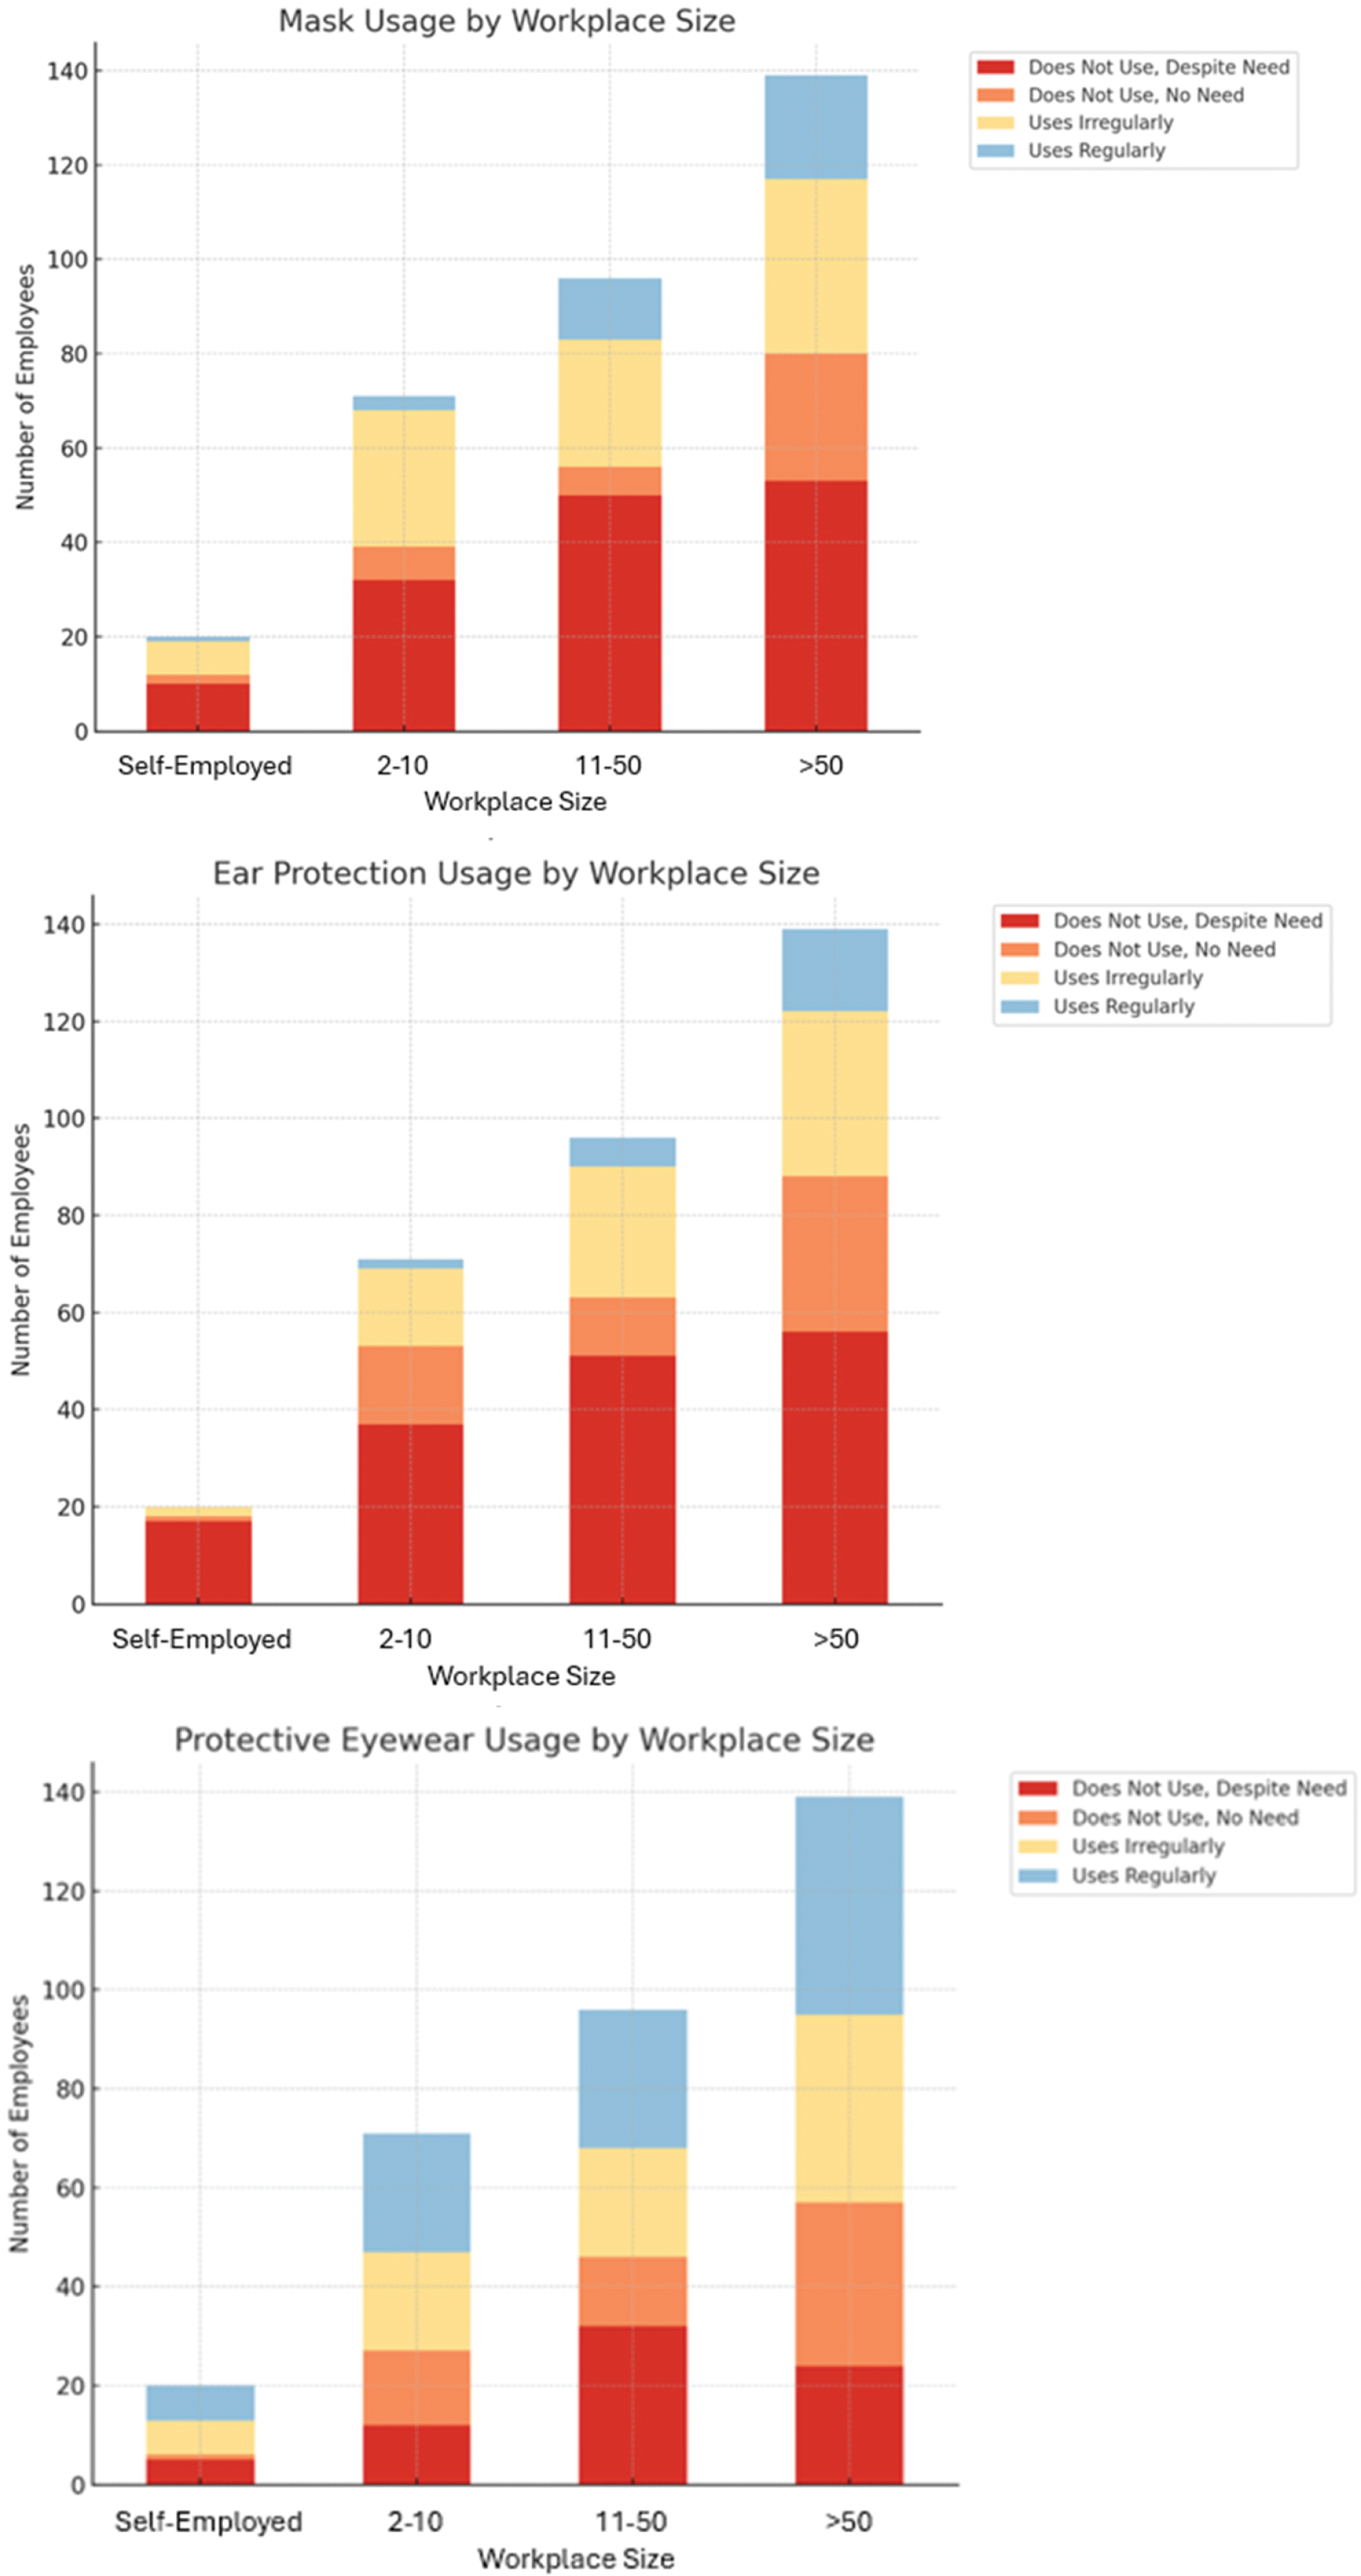
Figure 1
Distribution of mask usage status, ear protection usage status, and protective eyewear usage status by workplace size.