
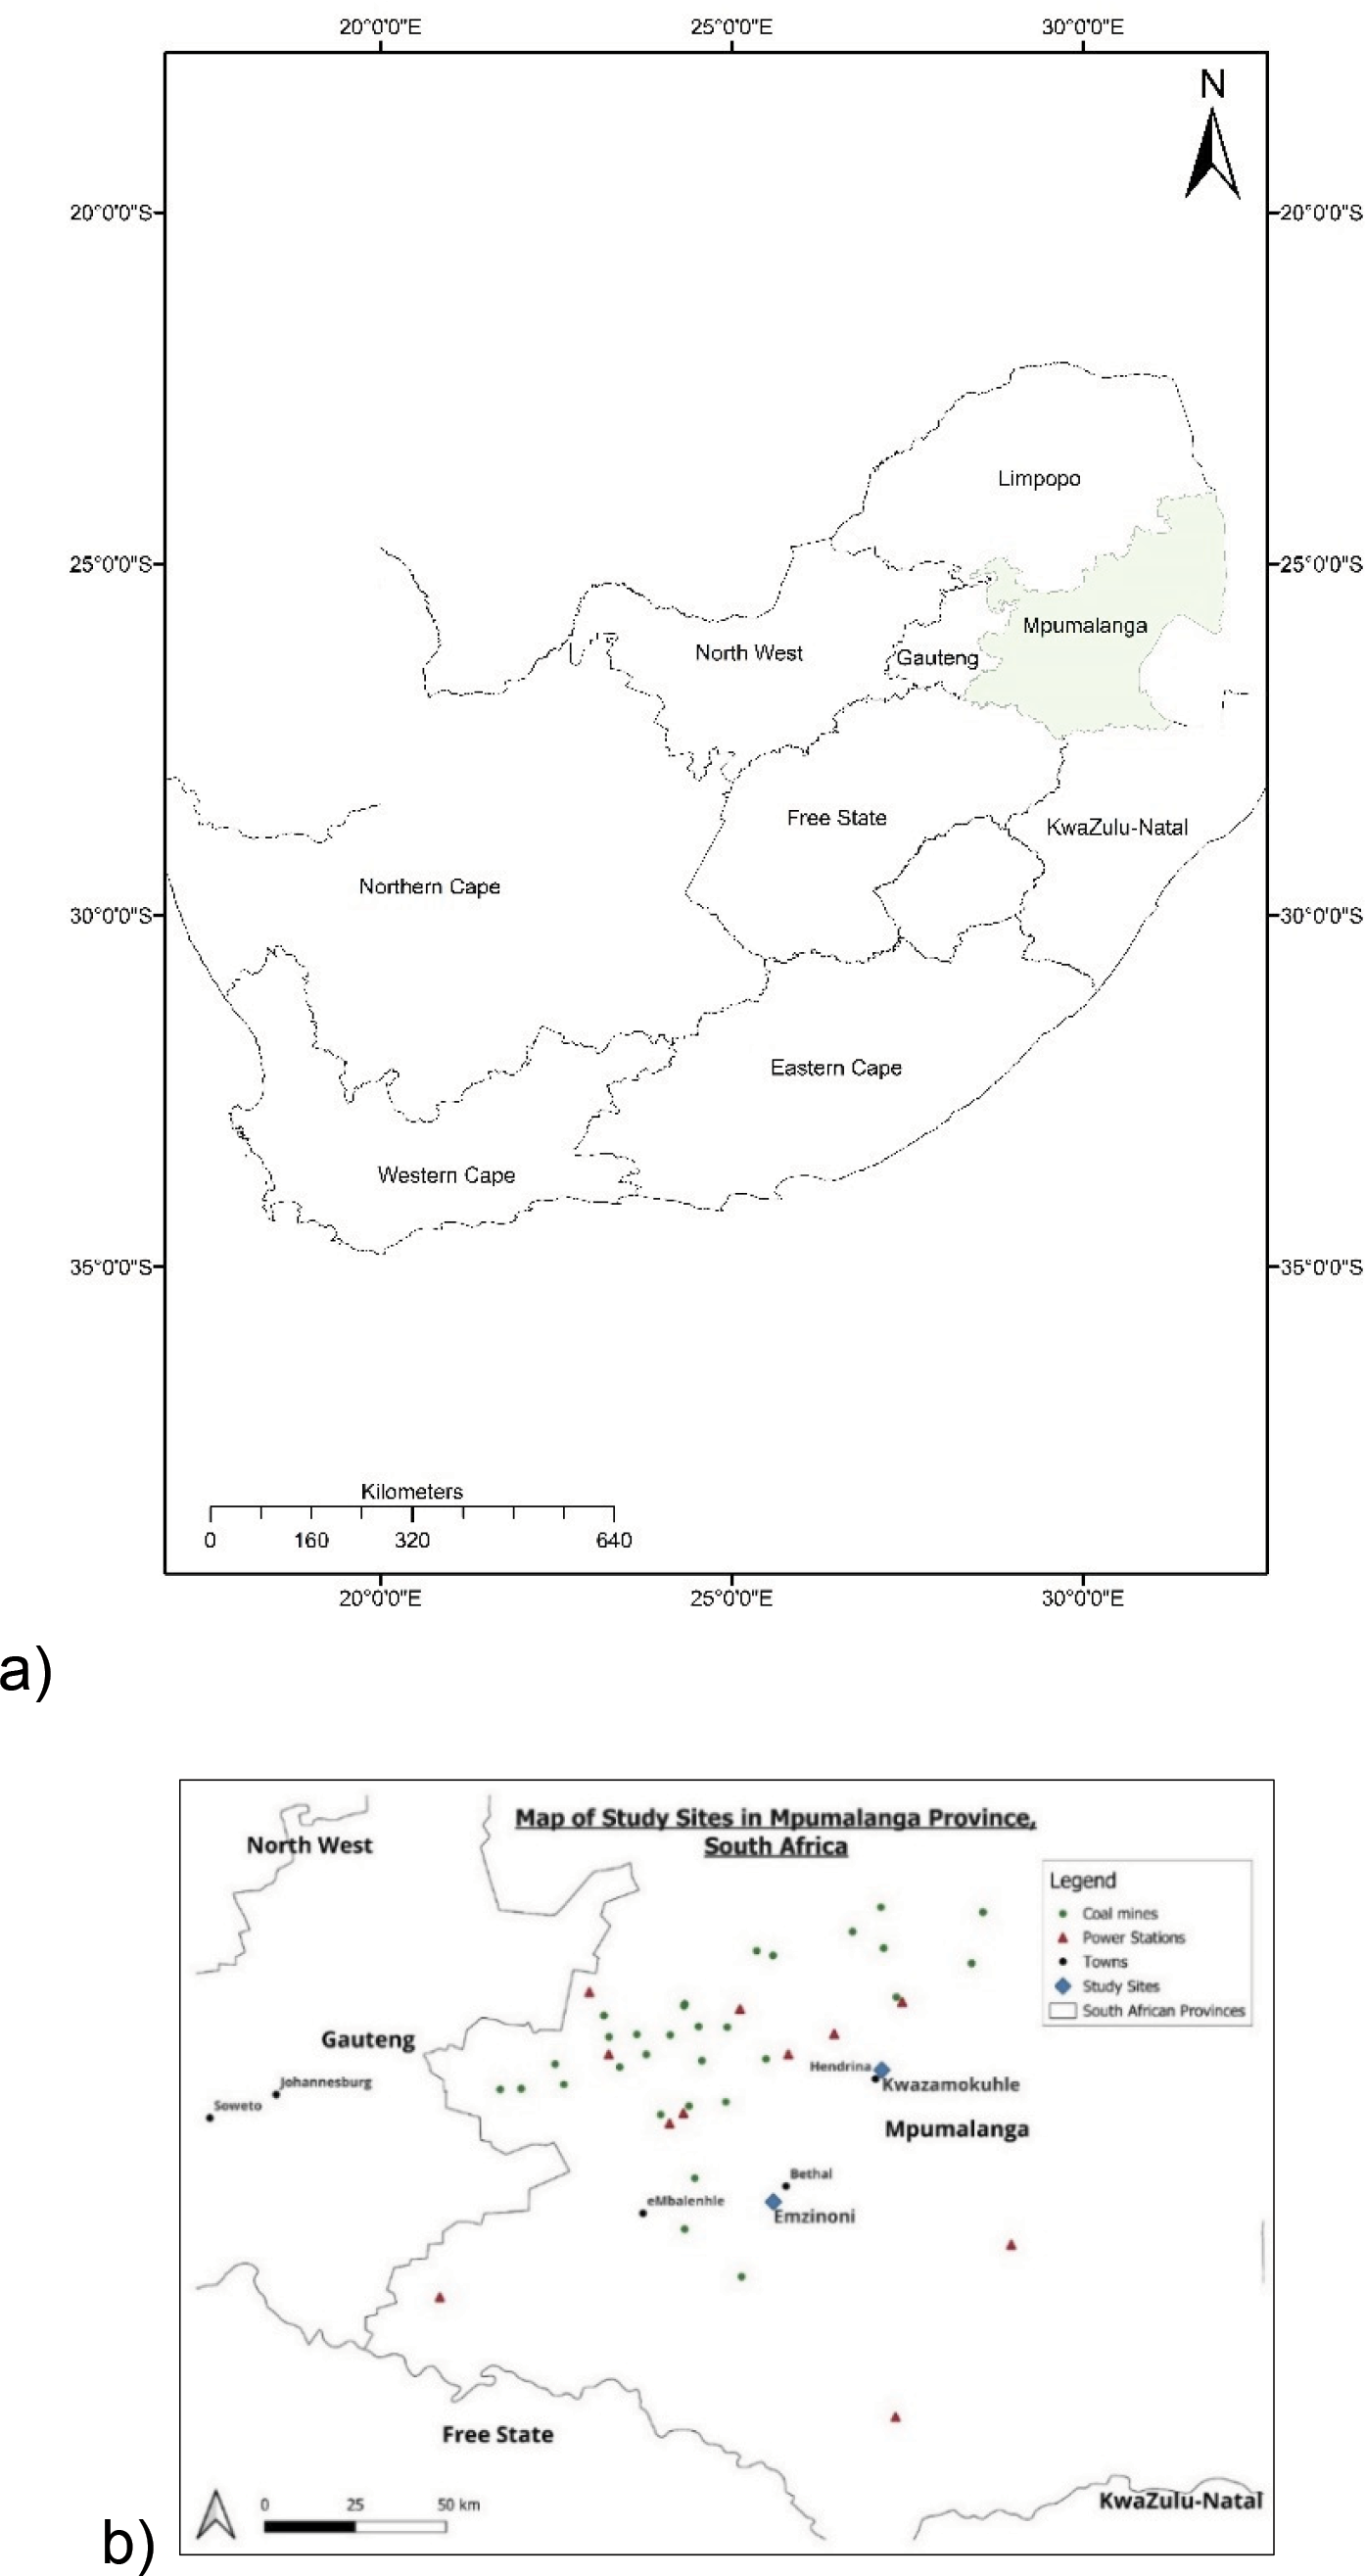
Figure 1
Location of (a) Mpumalanga Province in South Africa and (b) KwaZamokuhle and eMzinoni in Mpumalanga Province.

Figure 2
Overview of the surveys, tests and data monitoring conducted in and around participating households.
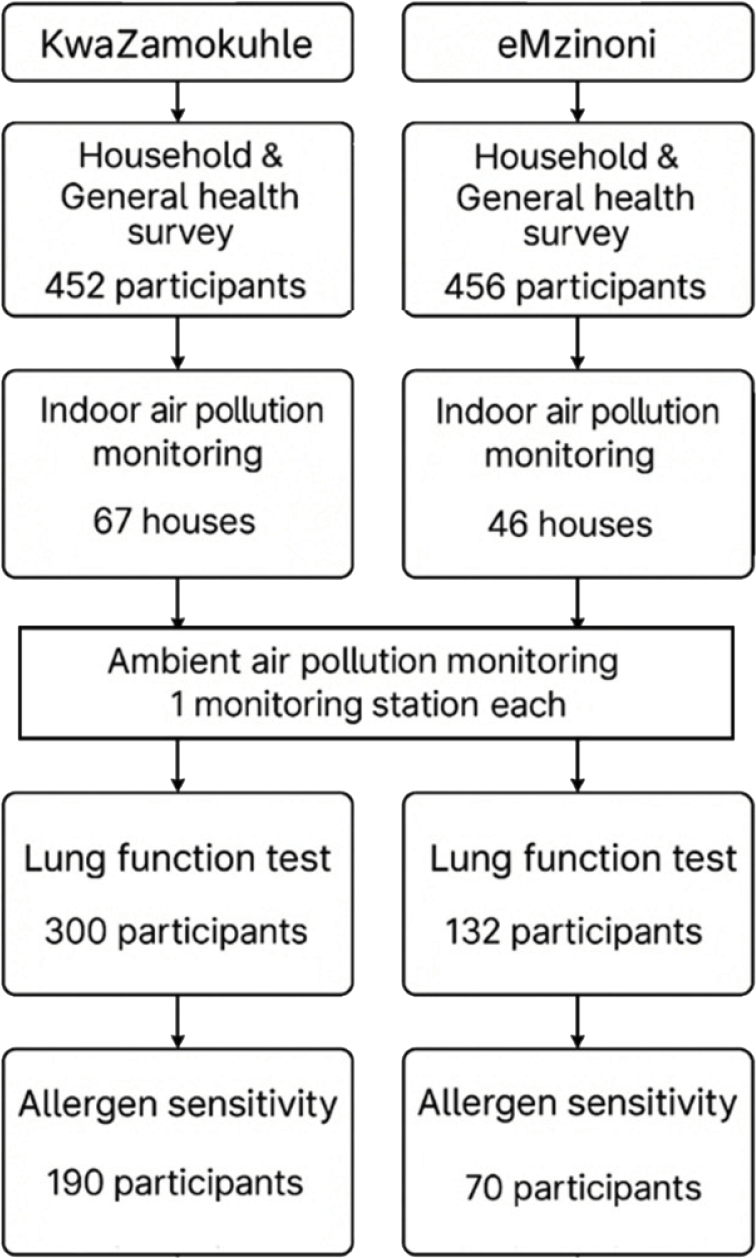
Figure 3
Flowchart of the number of households and participants enrolled in the study.
Table 1
Overview of household demographics and characteristics of the participating households in KwaZamokuhle and eMzinoni.
| VARIABLE | CHARACTERISTICS OF THE SAMPLE | KWAZAMOKUHLE (N = 452) N (%) | EMZINONI (N = 456) N (%) |
|---|---|---|---|
| Age of cook (mean and [range]) Age category | 18–29 years 30–59 years 60+ years | 43 [18‑91] 113 (25) 269 (60) 70 (15) | 48 [18‑96] 90 (20) 228 (50) 138 (30) |
| Education | Currently in primary or high school Finished primary school or high school Studying towards a diploma/degree Completed tertiary education Other | 11(2) 154 (34) 5 (1) 28 (6) 254 (56) | 7 (1) 287 (63) 4 (1) 4 (1) 154 (34) |
| Monthly income of household | < Food poverty line* ZAR 760/month (USD 40/month) < Lower‑bound poverty line ZAR 1058/month (USD 56/month) < Upper‑bound poverty line ZAR 1558 (USD 83) ZAR 1559–ZAR 2000 (USD 84–107) ZAR 2001–ZAR 5000 (USD 108–267) ZAR 5001–ZAR 10 000 (USD 268–534) ZAR 10 001–ZAR 20 000 (USD 435–1068) ZAR 20 001–ZAR 50 000 (USD 1069–2670) Did not report | 36 (8) 24 (5) 22 (5) 56 (12) 77 (17) 19 (4) 24 (5) 10 (2) 184 (41) | 11 (2) 22 (5) 17 (4) 107 (23) 70 (15) 14 (3) 3 (1) 0 (0) 212 (46) |
| Employment | Currently employed Currently unemployed | 379 (84) 73 (16) | 381 (84) 75 (16) |
| Food | Eat less due to money shortage Household runs out of money for food | 189 (42) 349 (77) | 327 (72) 338 (74) |
| Main source of water | Indoor tap Outdoor tap Outdoor tap away from the dwelling or tank | 135 (30) 316 (69) 1 (0.2) | 184 (40) 269 (59) 3 (1) |
| Water and sanitation | Toilet is located inside the dwelling | 282 (62) | 130 (29) |
| Waste collection If waste not collected | Waste is collected Waste is buried Burn it Dispose of it in open space Take to municipal dump Wait for next pick‑up | 451 (99) 0 (0) 1 (0.2) 16 (4) 0 (0) 0 (0) | 454 (99) 14 (3) 21 (5) 161 (37) 117 (27) 113 (26) |
Table 2
Primary fuels for cooking, heating and lighting and main stove types used for cooking in participating households in KwaZamokuhle and eMzinoni.
| VARIABLE | KWAZAMOKUHLE (N = 452) N (%) | EMZINONI (N = 456) N (%) | χ2 VALUE | DF | p‑VALUE |
|---|---|---|---|---|---|
| Cooking Electricity Coal LPG Paraffin Wood Animal dung Candle Other | 186 (41) 251 (55) 5 (1) 0 (0) 10 (2) 0 (0.0) 0 (0.0) 0 (0.0) | 335 (73) 117 (25) 2 (0.4) 1 (0.2) 1 (0.2) 0 (0.0) 0 (0.0) 0 (0.0) | 101.0 | 4 | <0.001 |
| Heating Electricity Coal LPG Paraffin Wood Animal dung Candle Other | 12 (2) 405 (89) 6 (1) 0 (0.0) 18 (3) 0 (0.0) 0 (0.0) 11 (2) | 151 (33) 298 (65) 4 (0.8) 0 (0.0) 2 (0.4) 0 (0.0) 0 (0.0) 1 (0.2) | 156.3 | 4 | <0.001 |
| Lighting Electricity LPG Other | 451 (99) 1 (0.2) 0 (0.0) | 453 (99) 1 (0.2) 2 (0.4) | 1.9 | 2 | 0.370 |
| Stove type used Hybrid (electric + LPG) Electric LPG Paraffin Mbaula Cast iron stove Own welded stove Other | 4 (0.9) 178 (39) 5 (1) 0 (0) 0 (0) 236 (52) 29 (6) 0 (0.0) | 19 (4) 197 (43) 1 (0.2) 0 (0) 1 (0.2) 197 (43) 39 (9) 2 (0.4) | 21.3 | 6 | 0.002 |
| Stove type Electric Non‑electric | 216 (47) 240 (53) | 182 (40) 270 (60) | 4.6 | 1 | 0.031 |
| Stove smoke inside Yes No | 149 (33) 303 (67) | 189 (41) 267 (59) | 6.99 | 1 | 0.008 |
[i] χ2value = chi‑square value; Df = degrees of freedom; bold font denotes statistical significance for the p‑values.
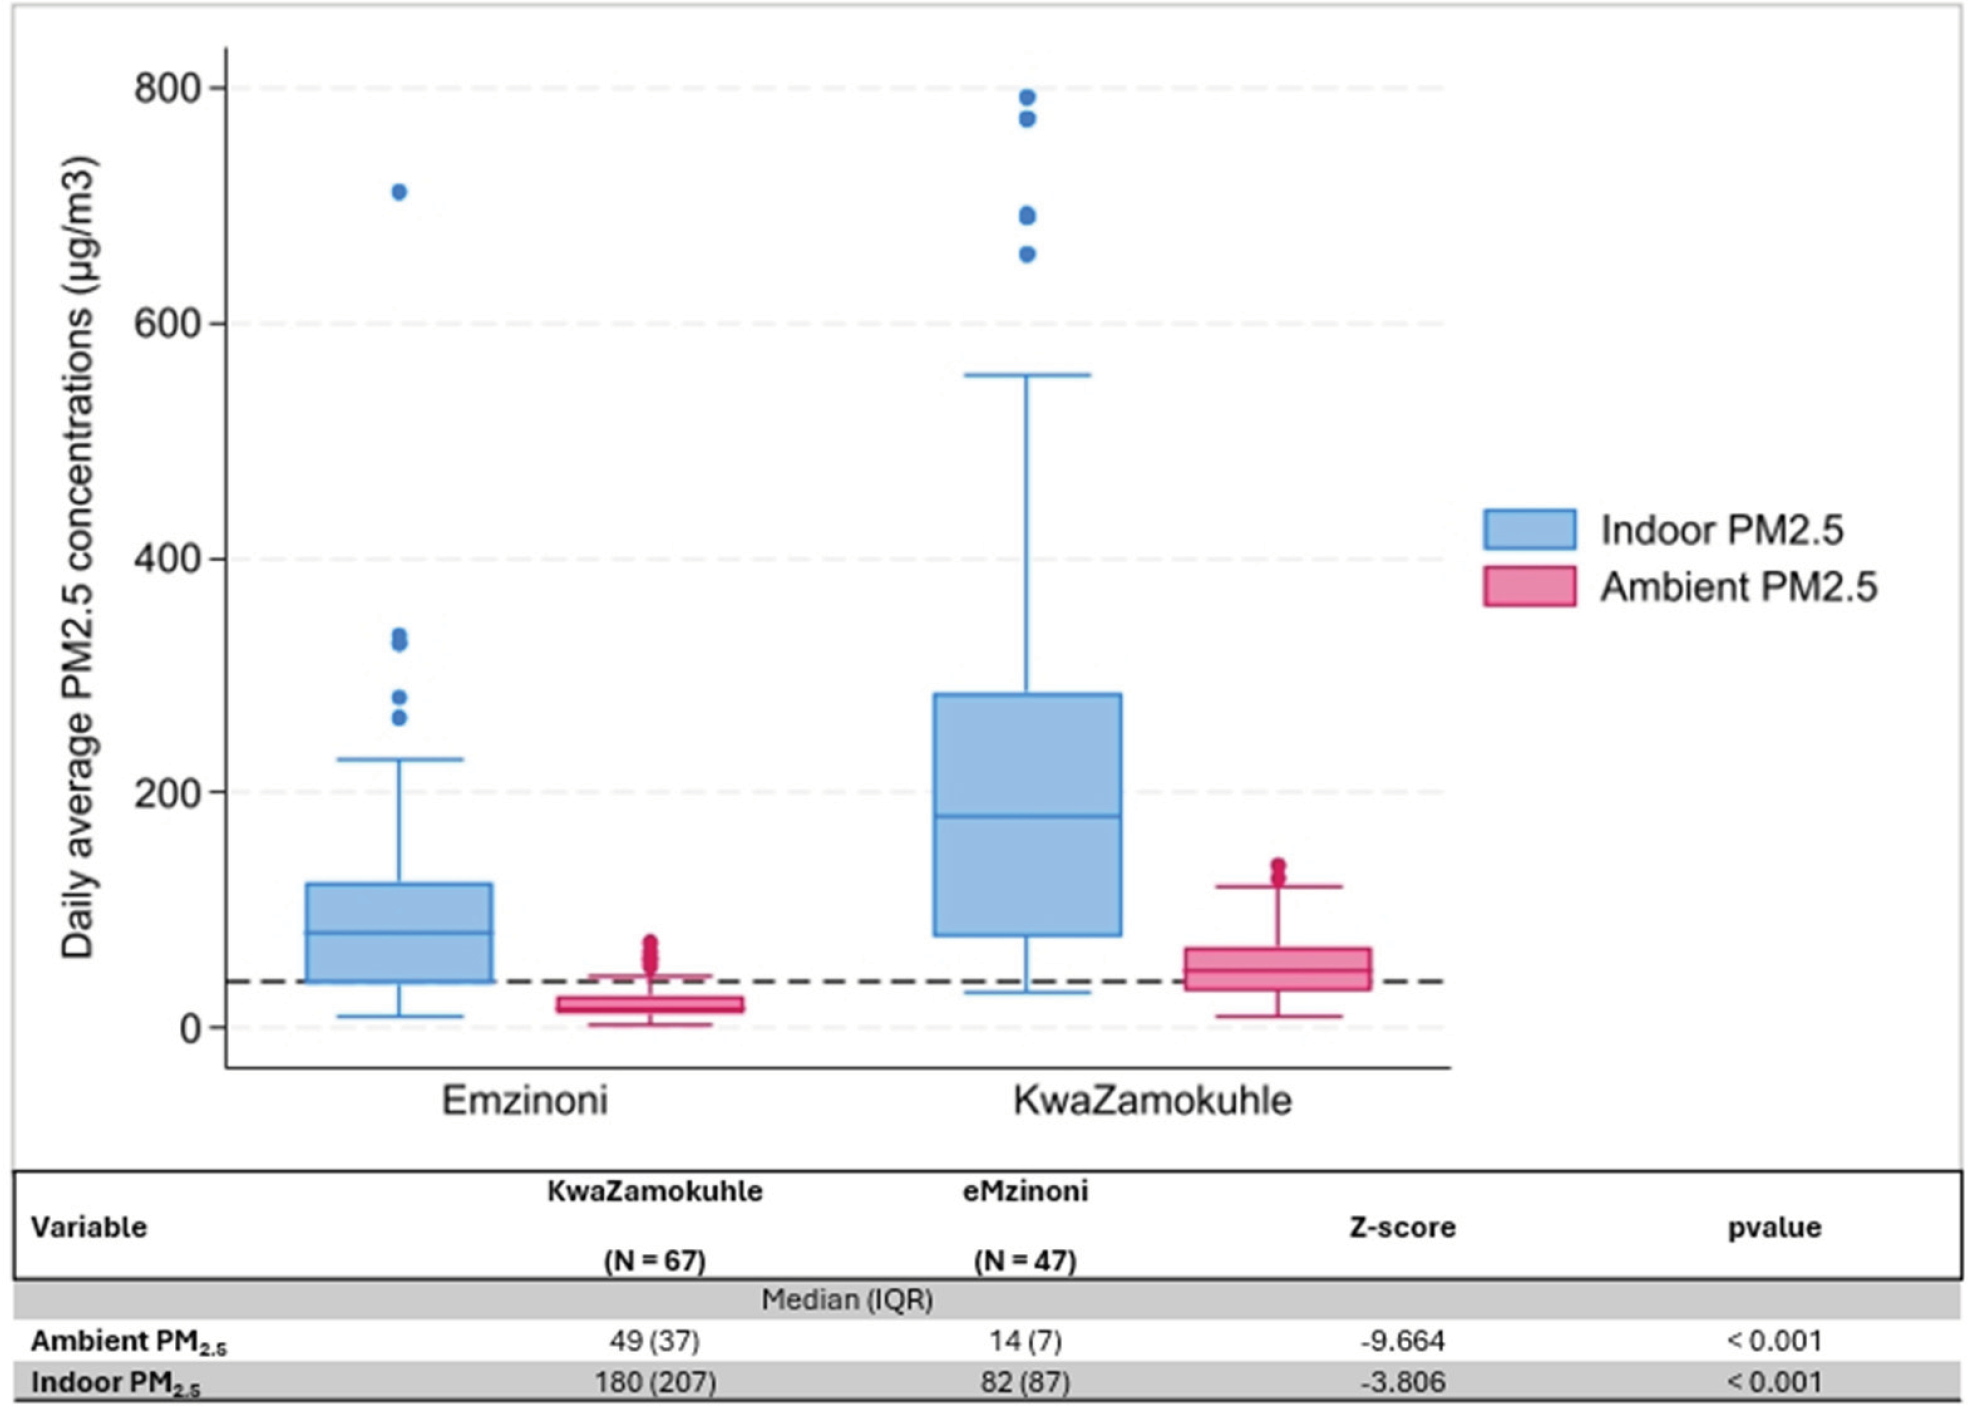
Figure 4
Boxplots of daily average indoor and ambient PM2‧5 concentrations (µg/m3) in eMzinoni and KwaZamokuhle, with the NAAQS daily limit of 40 µg/m3 shown as a dashed line. The nested table compares daily averages between the two sites. Note: IQR = interquartile range.
Table 3
Comparison of lung function and allergen sensitivity of participants in KwaZamokuhle and eMzinoni.
| VARIABLE | KWAZAMOKUHLE (N = 300) | EMZINONI (N = 132) | Z VALUE | p‑VALUE |
|---|---|---|---|---|
| Median Mean FEV1 | 2.59 (0.62) | 2.27 (0.93) | ‑3.091 | 0.002 |
| Median Mean FVC | 2.99 (0.52) | 2.84 (0.98) | ‑2.673 | 0.0084 |
| FEV/FVCa | 0.85 (0.1) | 0.82 (0.1) | ‑3.036 | 0.002 |
| Phadiatop concentrationa | 2.0 (5) | 2.9 (11) | ‑0.822 | 0.411 |
| Obstructive airways diseaseb | 29 (9) | 12 (9) | 0.035 | 0.851 |
| Phadiatop interpretation positiveb | 53 (27) | 17 (24) | 0.339 | 0.561 |
[i] aMann–Whitney U Test (median IQR); bchi‑square (n (%)).
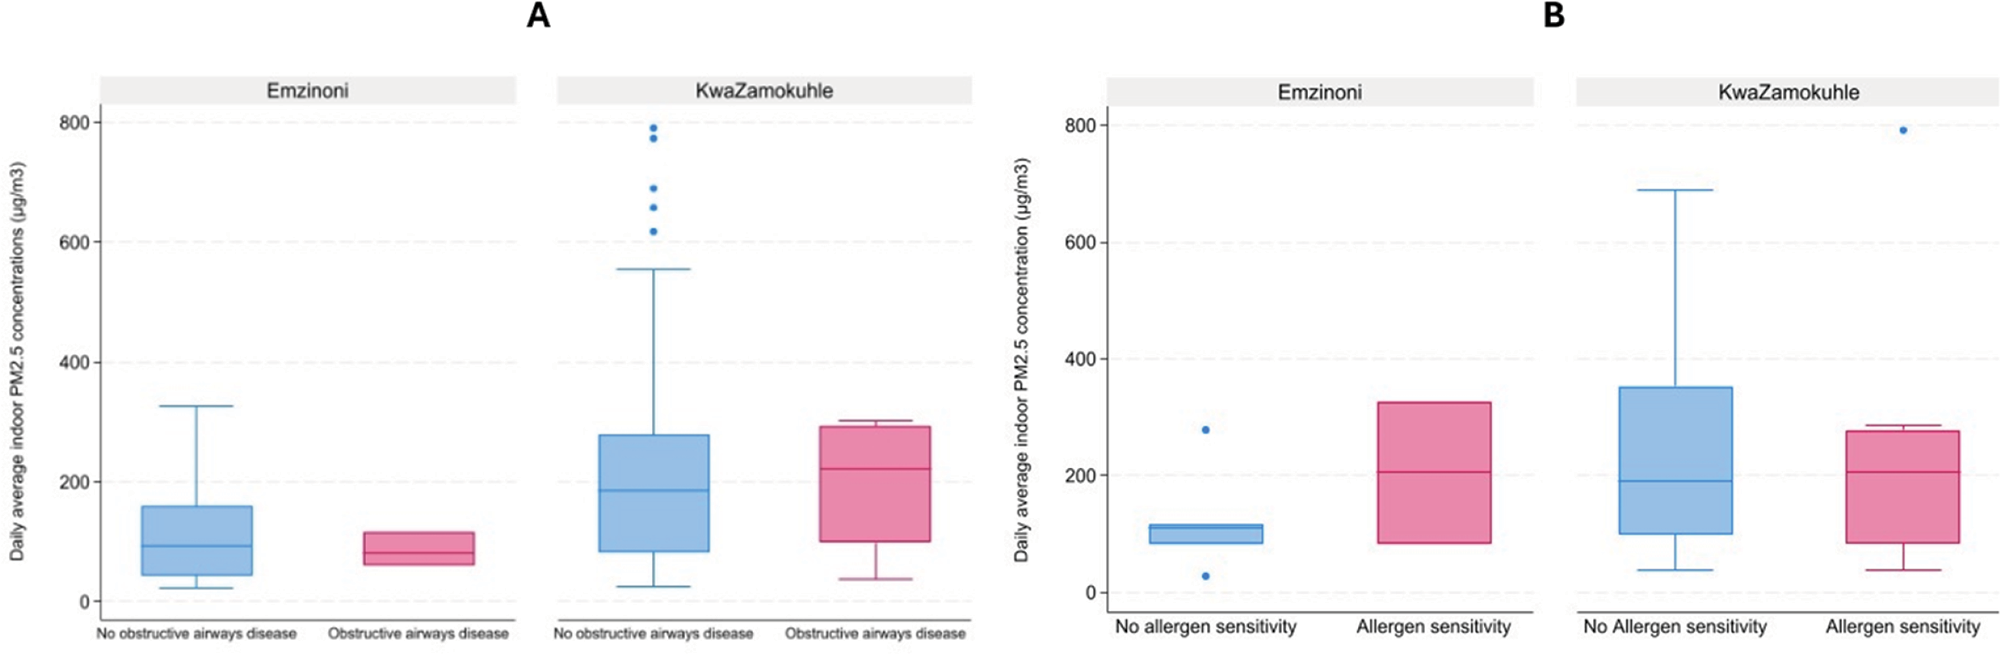
Figure 5
(A) Boxplots of obstructive airways disease occurrence at daily average indoor PM2‧5 concentrations in selected households in eMzinoni and KwaZamokuhle. Mann–Whitney U tests showed no significant differences (eMzinoni: Z = 0.00, p = 1.00; KwaZamokuhle: Z = −0.07, p = 0.95). (B) Boxplots of allergen sensitivity occurrence at daily average indoor PM2.5 concentrations in selected households in eMzinoni and in KwaZamokuhle. Mann–Whitney U test: eMzinoni Z = −0.78, p = 0.44; KwaZamokuhle Z = 0.31, p = 0.76).
Table 4
Crude and adjusted odds ratio estimates of the effects of various HAP exposure proxy metrics on measured lung function and allergen sensitivity. Results of logistic regression analysis. See notes below Table.
| OUTCOMES AND INDEPENDENT VARIABLES | OR (95% CI) AND P‑VALUE | ||
|---|---|---|---|
| MODEL: BASELINEa | MODEL: LIVING CONDITIONSb | MODEL: SOCIO‑ECONOMIC FACTORSc | |
| Obstructive airways disease | |||
| Main cooking fuel Electric Non‑electric | Reference 1.02 (0.54–1.96) p = 0.93 | Reference 0.90 (0.43–2.02) p = 0.80 | Reference 0.82 (0.32 – 2.11) p = 0.74 |
| Main heating fuel Electric Non‑electric | Reference 2.16 (0.50 – 9.29) p = 0.30 | Reference* 2.28 (0.49 – 10.60) p = 0.294 | Reference** 1.90 (0.43 – 8.37) p = 0.40 |
| Stove type Electric Non‑electric | Reference 0.87 (0.46 – 1.66) p = 0.68 | Reference 0.91 (0.41 – 2.03) p = 0.82 | Reference 0.90 (0.36 – 2.29) p = 0.72 |
| Stove smoke No Yes | Reference 0.97 (0.50 – 1.89) p = 0.92 | Reference 0.99 (0.43 – 2.28) p = 0.99 | Reference 1.18 (0.46 – 3.06) p = 0.73 |
| Town eMzinoni KwaZamokuhle | Reference 1.07 (0.53 – 2.17) p = 0.85 | Reference 1.81 (0.66 – 5.00) p = 0.25 | Reference 0.76 (0.25 – 2.28) p = 0.63 |
| Allergen sensitivity | |||
| Main cooking fuel Electric Non‑electric | Reference 1.17 (0.68 – 2.02) p = 0.58 | Reference 1.13 (0.64 – 2.00) p = 0.67 | Reference 1.36 (0.63 – 2.90) p = 0.43 |
| Main heating fuel Electric Non‑electric | Reference 0.78 (0.29 – 2.15) p = 0.64 | Reference 0.60 (0.19 – 1.87) p = 0.38 | Reference 0.86 (0.21 – 3.49) p = 0.83 |
| Stove type Electric Non‑electric | Reference 0.87 (0.50 – 1.52) p = 0.62 | Reference 0.87 (0.50 – 1.54) p = 0.64 | Reference 0.80 (0.38 – 1.70) p = 0.56 |
| Stove smoke No Yes | Reference 0.70 (0.40 – 1.26) p = 0.24 | Reference 0.76 (0.42 – 1.38) p = 0.37 | Reference 0.75 (0.33 – 1.69) p = 0.48 |
| Town eMzinoni KwaZamokuhle | Reference 1.21 (0.0.64 – 2.27) p = 0.56 | Reference 1.27 (0.67 – 2.41) p = 0.46 | Reference 0.71 (0.30 – 1.71) p = 0.45 |
[i] *Excluded time lived in community due to collinearity issues.
[ii] **Excluded monthly income, due to collinearity issues.
[iii] aUnadjusted bivariate model.
[iv] bAdjusted for time lived in community and whether or not the home has a ceiling.
[v] cAdjusted for employment status, monthly income, education and age.