
Table 1
Socio‑demographic and clinical characteristics of patients visiting the ED with heat‑related illnesses pre‑intervention (2013–2017) and post‑intervention (2018–2022) (n = 308).
| PRE‑INTERVENTION (2013–2017) (N = 184) | POST‑INTERVENTION (2018–2022) (N = 124) | P‑VALUE | |
|---|---|---|---|
| Age in Years | 51.43 ± 18.33 | 42.52 ± 17.39 | <0.001* |
| Male | 117 (64) | 101 (82) | <0.001* |
| Female | 67 (36) | 23 (19) | |
| Triage Category | |||
| Priority level 1 | 34 (19) | 32 (26) | <0.043* |
| Priority level 2 | 49 (27) | 37 (30) | |
| Priority level 3 | 94 (51) | 45 (36) | |
| Priority level 4 | 7 (4) | 10 (8) | |
| Presenting Complain | |||
| Fever | 135 (73) | 71 (57) | <0.003* |
| Malaise/Nausea/Vomiting | 70 (38) | 110 (89) | <0.001* |
| Weakness | 33 (18) | 25 (20) | 0.624 |
| Altered Mental Status | 26 (14) | 26 (21) | 0.116 |
| Shortness of Breath (SOB) | 13 (7) | 26 (21) | <0.001* |
| Headache | 10 (5) | 24 (19) | <0.001* |
| Faint/Dizziness/Syncope | 9 (5) | 23 (19) | <0.001* |
| Fall | 19 (10) | 10 (8) | 0.505 |
| Chest | 1 (1) | 27 (22) | <0.001* |
| Abdominal Pain | 2 (1) | 22 (18) | <0.001* |
| Palpitations | 8 (4) | 15 (12) | <0.011* |
| Anxiety | 17 (9) | 6 (5) | 0.150 |
| Body ache | 9 (5) | 7 (6) | 0.770 |
| Chills | 3 (2) | 7 (6) | <0.051 |
| Urinary | 4 (2) | 2 (2) | 0.727 |
| Gasping | 1 (1) | 4 (3) | 0.068 |
| Cramp | 2 (1) | 0 (0) | 0.244 |
| Triage Vitals | |||
| Systolic Blood Pressure (BP) mmHg | 117.03 ± 36.85 | 126.87 ± 23.83 | 0.009* |
| Diastolic Blood Pressure (BP) mmHg | 70.59 ± 22.94 | 76.17 ± 14.53 | 0.017* |
| Heart Rate (HR) | 101.07 ± 35.16 | 99.25 ± 26.45 | 0.624 |
| Temperature (Celsius) | 38.08 ± 4.45 | 37.55 ± 1.4 | 0.200 |
[i] *p < 0.05 indicates statistical significance.
Table 2a
Number of heat‑related diagnoses and management pre‑intervention (2013–2017) and post‑intervention (2018–2022) (n = 308).
| PRE‑INTERVENTION (2013–2017) N = 184 (%) | POST‑INTERVENTION (2018–2022) N = 124 (%) | P‑VALUE | |
|---|---|---|---|
| Heat Diagnosis | |||
| Total Heat Diagnosis | 184 (59.7) | 124 (40.3) | 0.0008* |
| Heat Exhaustion | 63 (34) | 85 (69) | <0.001* |
| Heat Stroke | 114 (62) | 29 (23) | <0.001* |
| Heat Syncope | 1 (1) | 0 (0) | 0.411 |
| Heat Cramp | 4 (2) | 0 (0) | 0.098 |
| Heat Rashes | 2 (1) | 5 (4) | 0.089 |
| Heat intolerance | 0 (0) | 1 (1) | 0.222 |
| Any other heatrelated illness | 0 (0) | 4 (3) | 0.014* |
| Management | |||
| IV Fluid Administration | 70 (39) | 82 (66) | <0.001* |
| Sponging | 42 (23) | 17 (14) | 0.046* |
| Ice Pack | 2 (1) | 2 (2) | 0.689 |
[i] *p < 0.05 indicates statistical significance.
Table 2b
Yearly trend in the diagnosis of heat‑related illnesses pre‑intervention (2013–2017) and post‑intervention (2018–2022).
| YEAR | HEATH EXHAUSTION 148 (%) | HEAT STROKE 143 (%) | OTHER HEAT‑RELATED ILLNESSES* 4 (%) |
|---|---|---|---|
| Pre‑Intervention | |||
| 2013 | 0 (0%) | 1 (1%) | 0 (0%) |
| 2014 | 1 (1%) | 1 (1%) | 0 (0%) |
| 2015 | 58 (39%) | 108 (76%) | 5 (29.5%) |
| 2016 | 1 (1%) | 1 (1%) | 1 (5.9%) |
| 2017 | 3 (2%) | 3 (2%) | 1 (5.9%) |
| Post‑Intervention | |||
| 2018 | 31 (21%) | 5 (3%) | 4 (23.5%) |
| 2019 | 23 (16%) | 9 (6%) | 1 (5.9%) |
| 2020 | 8 (5%) | 2 (1%) | 1 (5.9%) |
| 2021 | 14 (9%) | 9 (6%) | 4 (23.5%) |
| 2022 | 9 (6%) | 4 (3%) | 0 (0%) |
[i] *Other HRIs include heat syncope, heat cramps, heat rashes, heat intolerance, and any other heat‑related illness.
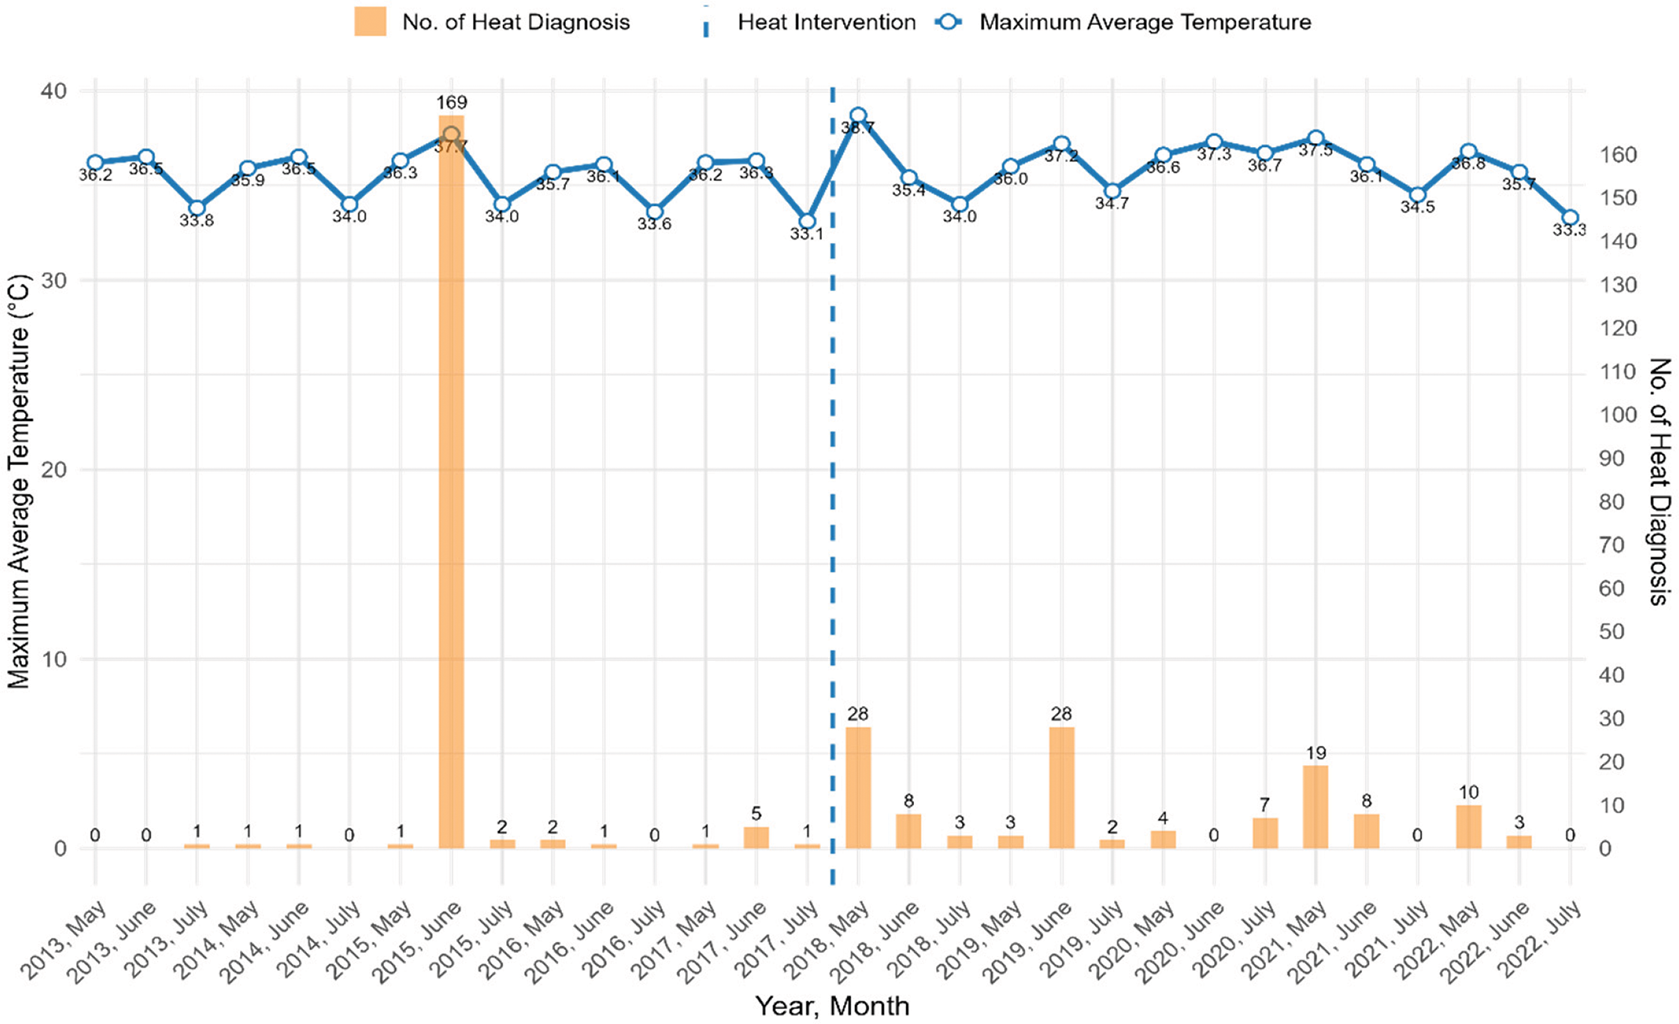
Figure 1
Trends in heat‑related diagnoses and their correlation with maximum average ambient temperature in summer months (May, June, and July) pre‑intervention (2013–2017) and post‑intervention (2018–2022).

Figure 2
Yearly trends in diagnosis and management of heat‑related illnesses pre‑intervention (2013–2017) and post‑intervention (2018–2022).
Table 3
Patient outcomes for heat‑related illnesses pre‑intervention (2013–2017) and post‑intervention (2018–2022) (n = 308).
| PRE‑INTERVENTION (2013–2017) (N = 184) | POST‑INTERVENTION (2018–2022) (N = 124) | P‑VALUE | |
|---|---|---|---|
| ED Disposition | |||
| Discharged | 94 (51) | 82 (66) | |
| Referral | 36 (20) | 25 (20) | |
| Leave against medical advice (LAMA) | 0 (0) | 12 (10) | <0.001* |
| Admission | 49 (27) | 4 (3) | |
| Expired | 5 (3) | 1 (1) | |
| Admissions | (n = 49) | (n = 4) | |
| HDU/CCU/ICU | 16 (33) | 3 (75) | 0.089 |
| General Ward Adults | 33 (67) | 1 (25) | |
| Length of Stay (Median IQR in minutes) | 148 (1440 ‑ 38) | 245 (383 ‑ 147) | <0.001* |
| Mortality | |||
| ED Mortality | 5 (3) | 1 (1) | 0.234 |
| Hospital Mortality (n = 53) | 11 (6) | 2 (2) | 0.062 |
| Total Mortality | 16 (9) | 3 (2) | 0.025* |
[i] HDU/CCU/ICU*= High Dependency Unit, Critical Care Unit, Intensive Care Unit.
Table 4a
Interrupted time series (ITS) analyses from 2013 to 2022 for the months of May to July.
| ESTIMATE (β) | P‑VALUE | CI (95%) | |
|---|---|---|---|
| Heat Diagnosis | –1.63 | <0.001* | –2.28 to −0.99 |
| Heat Exhaustion | −0.74 | 0.34 | −2.29 to 0.80 |
| Heat Stroke | −4.06 | 0.056 | −8.2 to 0.10 |
| IV Fluids | –0.72 | 0.09 | –1.5 to 0.13 |
| Sponging Use | –0.51 | 0.64 | –2.70 to 1.68 |
[i] *Ice pack was not included in this table due to the limited cell count.
Table 4b
Analyses from 2013 to 2022 for the months of May to July excluding the extreme heat days in 2015.
| ESTIMATE (β) | P‑VALUE | CI (95%) | |
|---|---|---|---|
| Heat Diagnosis | 2.18 | <0.001* | 1.21 to 3.16 |
| Heat Exhaustion | 0.45 | 0.014* | 0.15 to 0.98 |
| Heat Stroke | 0.44 | 0.081 | −0.95 to 0.58 |
| IV Fluids | 2.07 | <0.001* | 1.08 to 3.25 |
| Sponging Use | 1.82 | 0.23 | –1.16 to 4.82 |
[i] *Ice pack was not included in this table due to the limited cell count.