
Table 1
CMIP5 ensemble projection of annual temperature and precipitation, under RCP8.5 high emission scenario, Ethiopia.
| CMIP5 ENSEMBLE PROJECTION | 2020–2039 | 2040–2059 | 2060–2079 | 2080–2099 |
|---|---|---|---|---|
| Annual temperature | +0.6 to +1.5 | +1.2 to +2.6 | +2.1 to + 4.0 | +2.8 to +5.5 |
| Anomaly (°C) | (+1.0 °C) | (+1.8 °C) | (+2.8 °C) | (+3.7 °C) |
| Annual precipitation | ‑14.4 to +21.2 | ‑16.8 to +27.4 | ‑18.8 to 37.6 | ‑17.5 to +50.0 |
| Anomaly (mm) | (+2.2 mm) | (+3.1 mm) | +6.0 mm | +9.7 mm |
[i] Note: Bold value is the range (10th – 90th percentile) and values in parentheses show the median.
[ii] Source: Adapted from Climate Risk Profile: Ethiopia (2021): The World Bank Group [5].
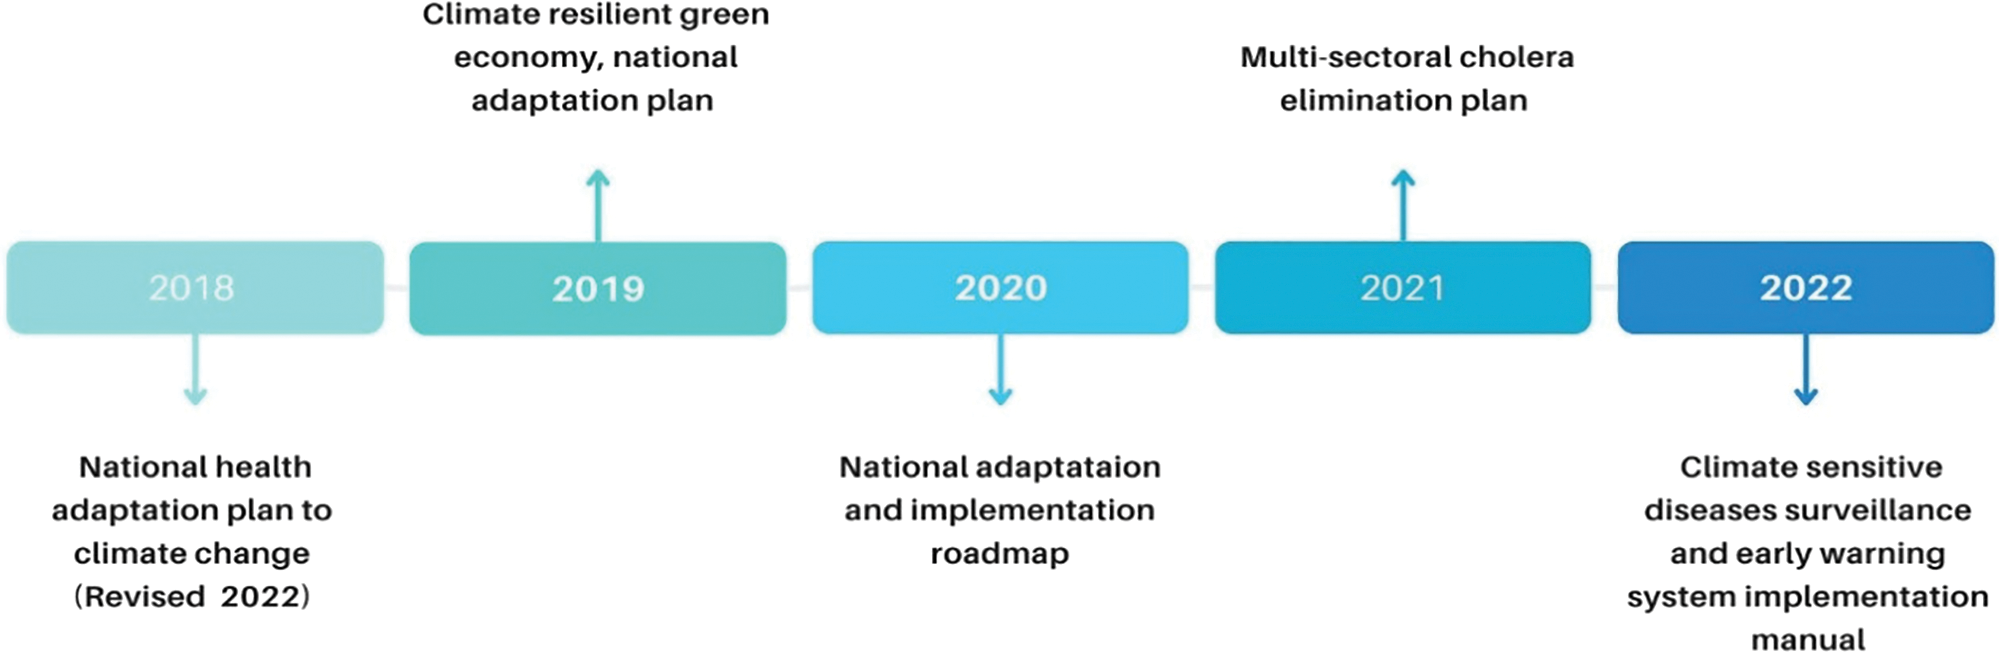
Figure 1
Timeline of key climate adaptation strategies for cholera in Ethiopia.
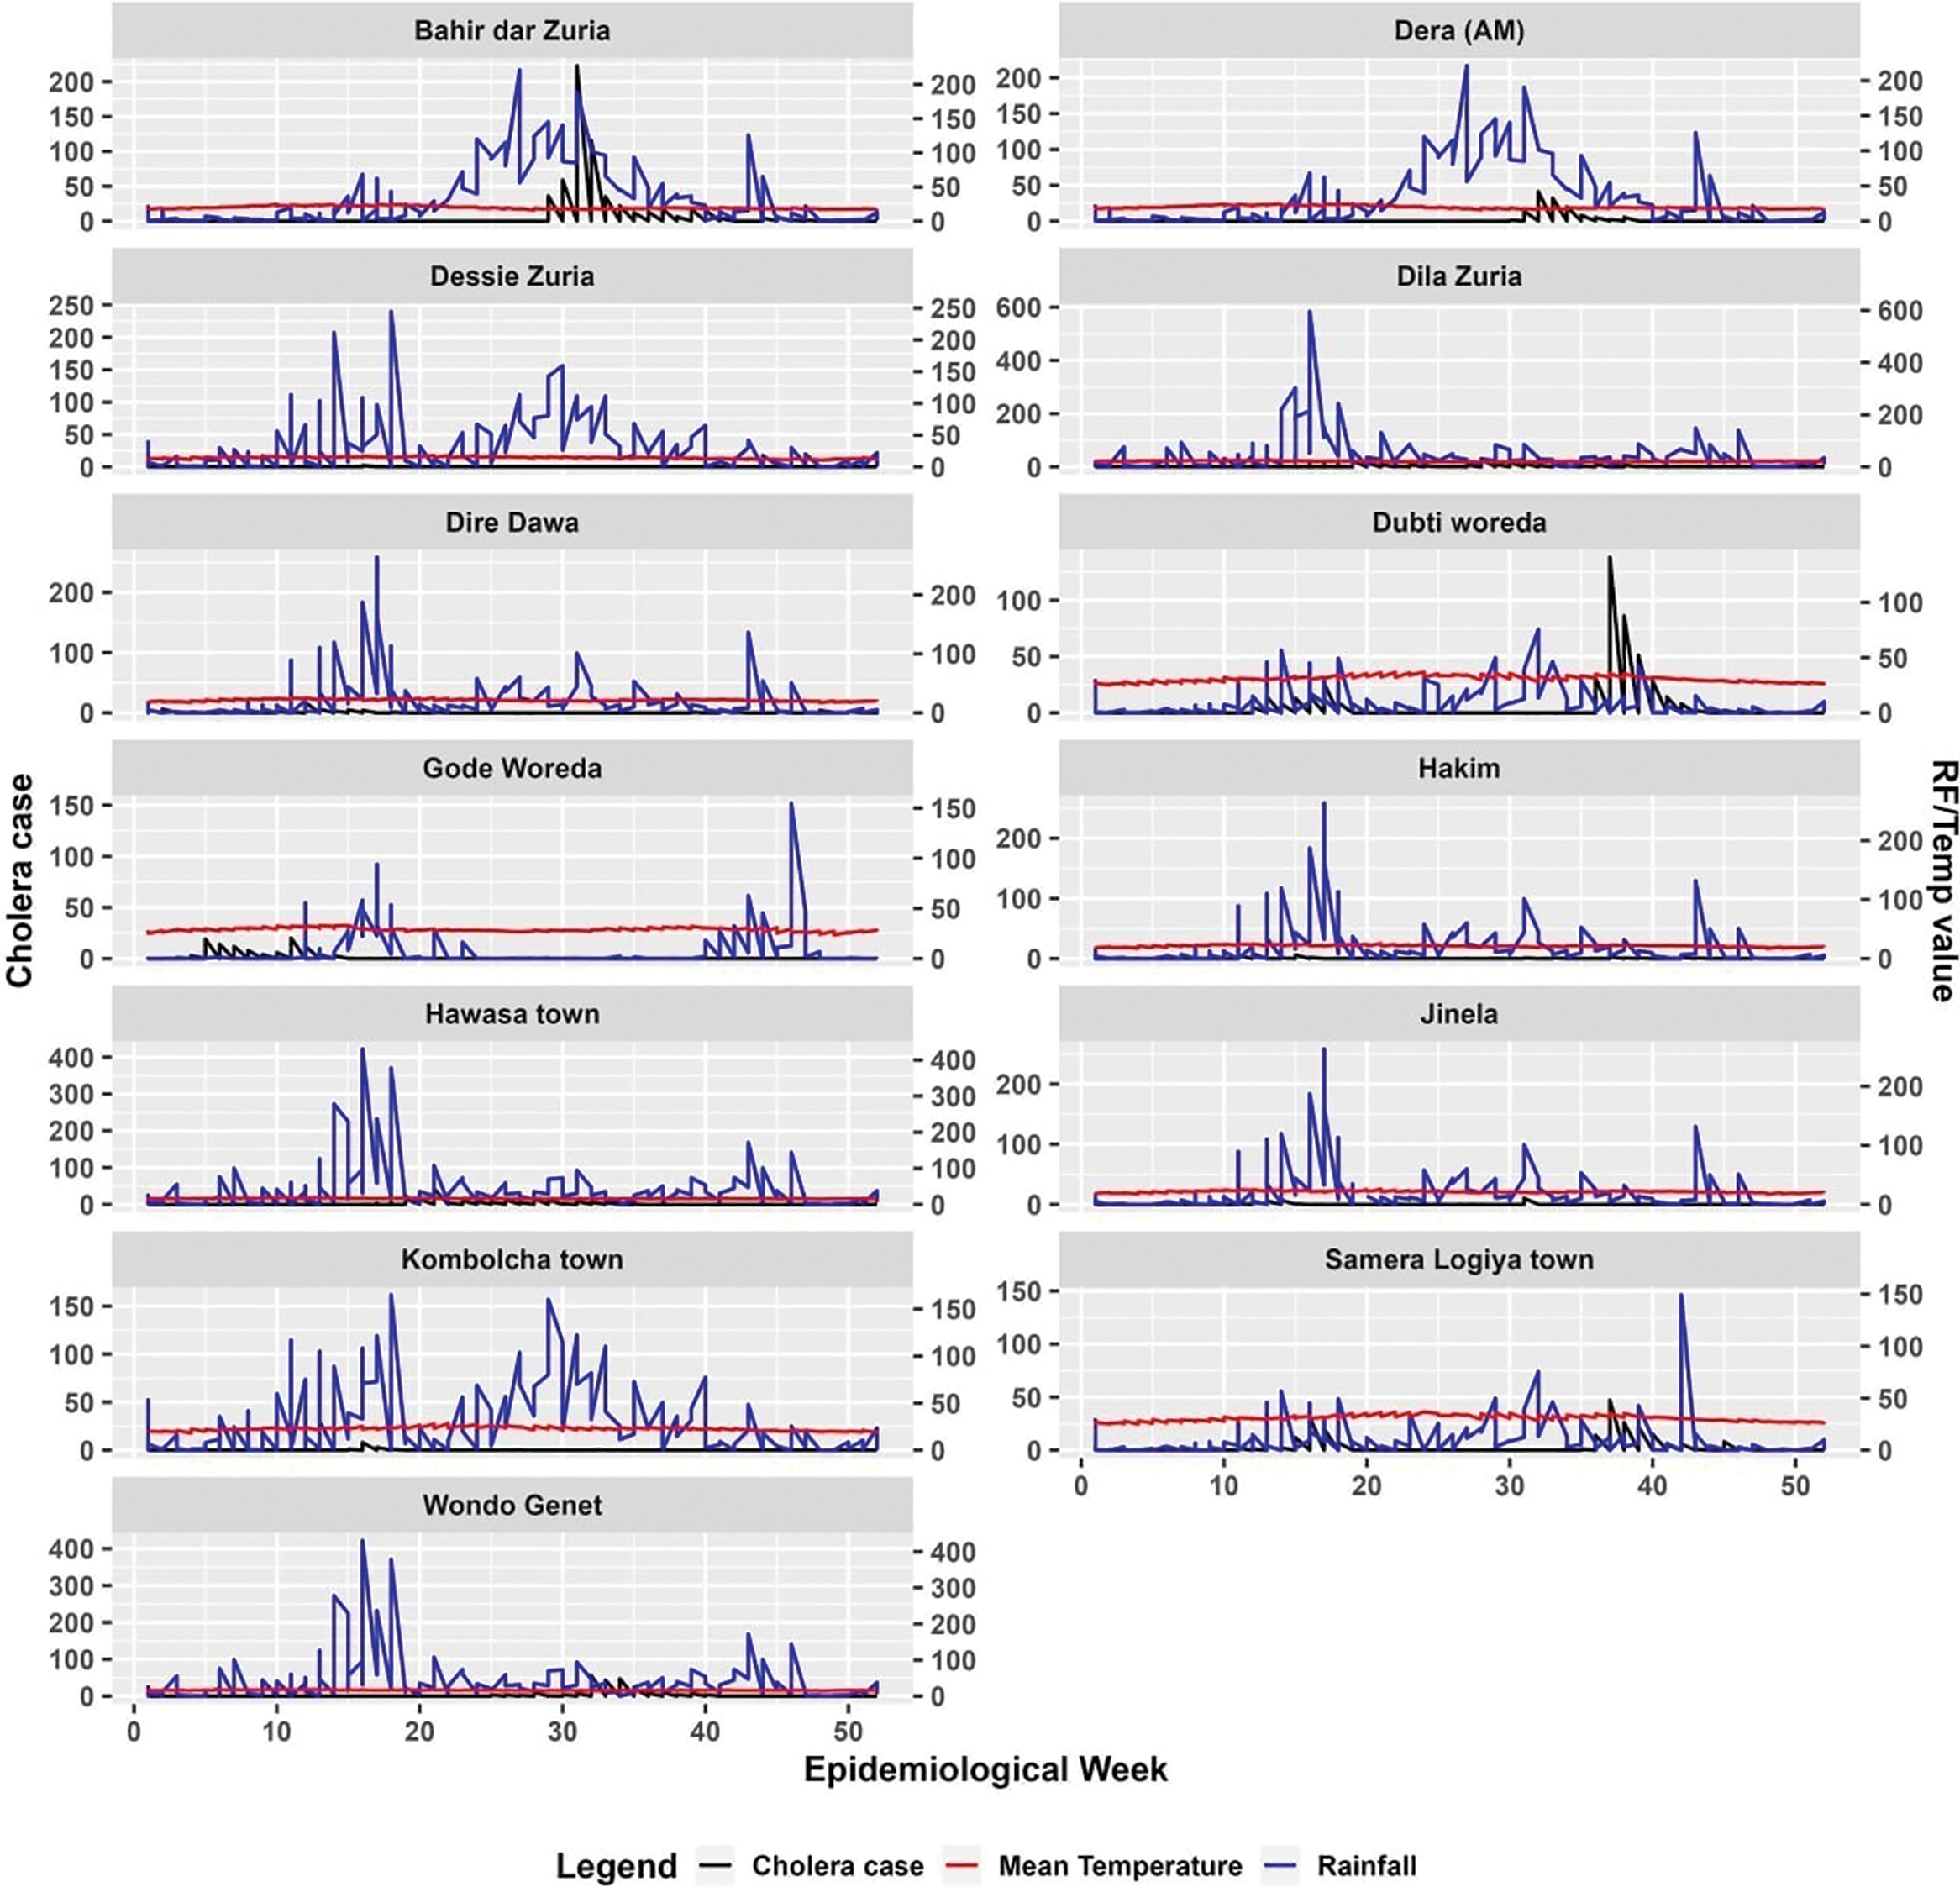
Figure 2
Cholera case distribution in relation to rainfall and temperature across study districts in Ethiopia.
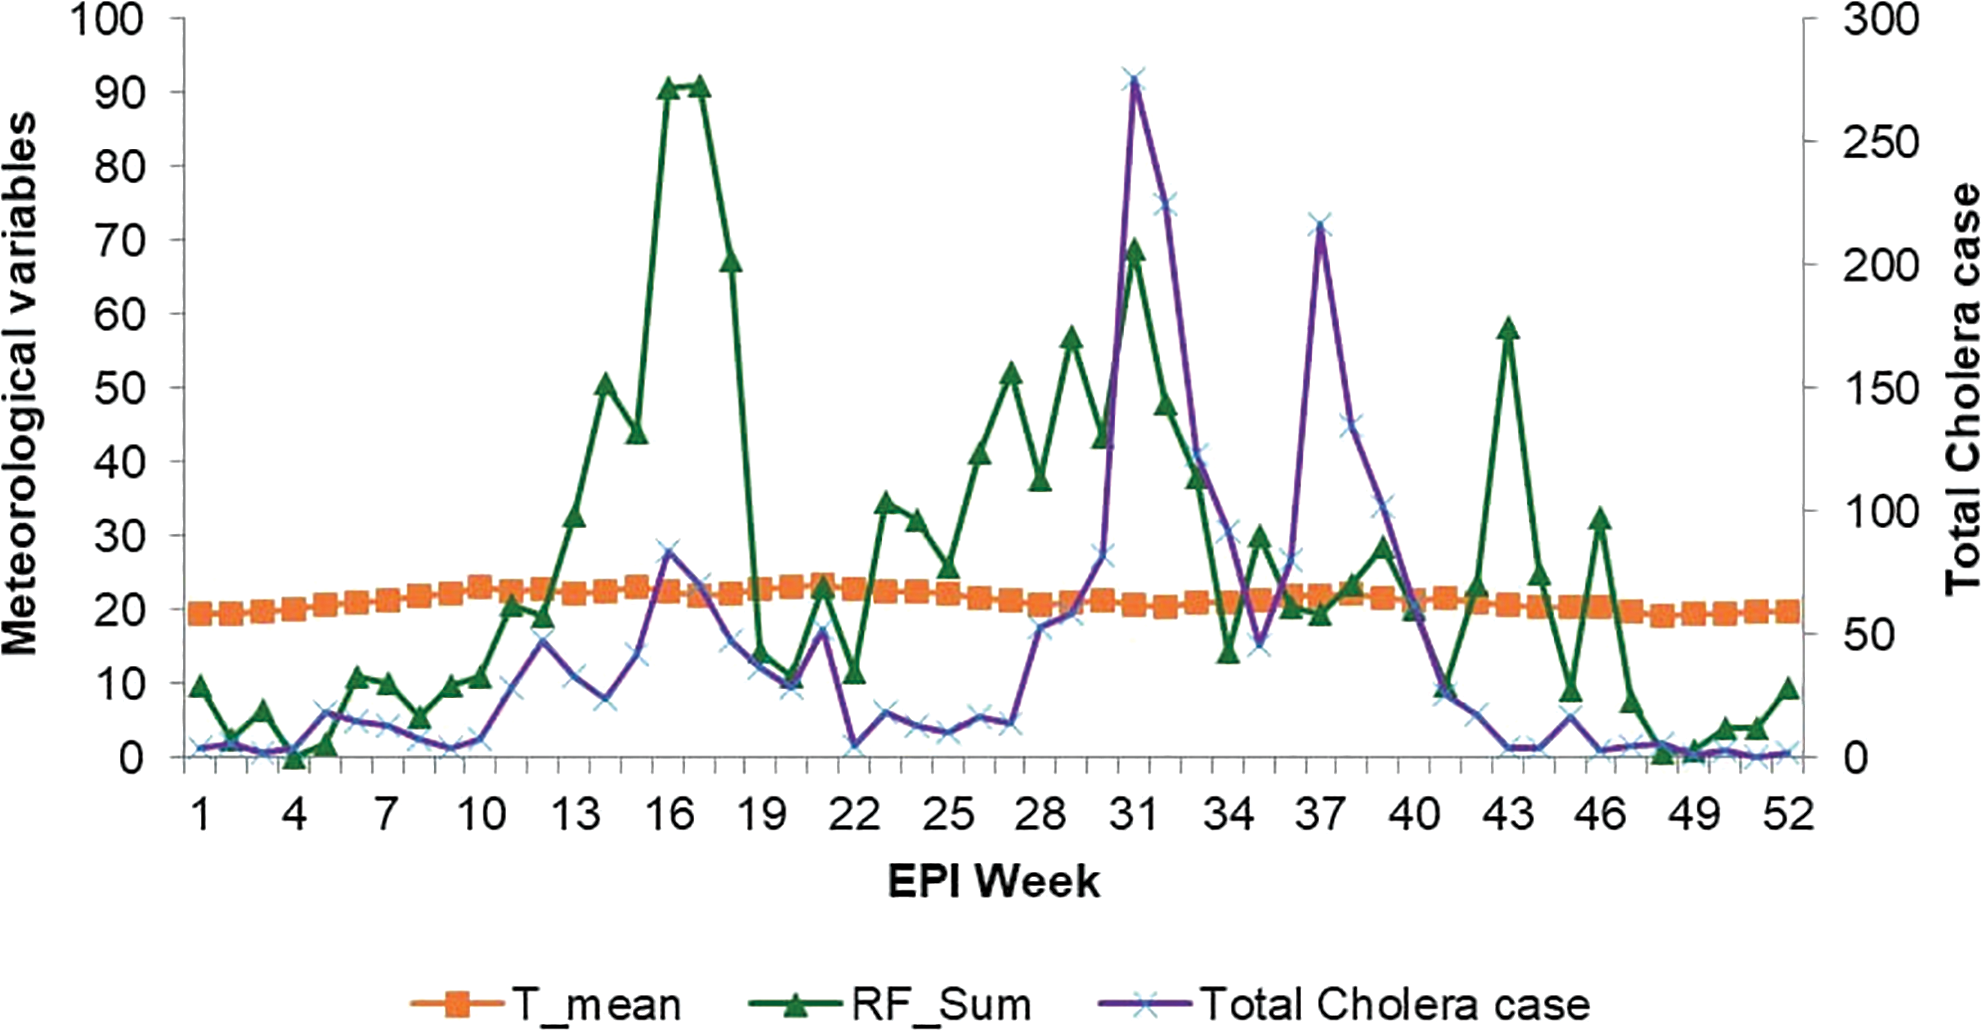
Figure 3
Total cholera distribution with rainfall and temperature in the study districts, Ethiopia.
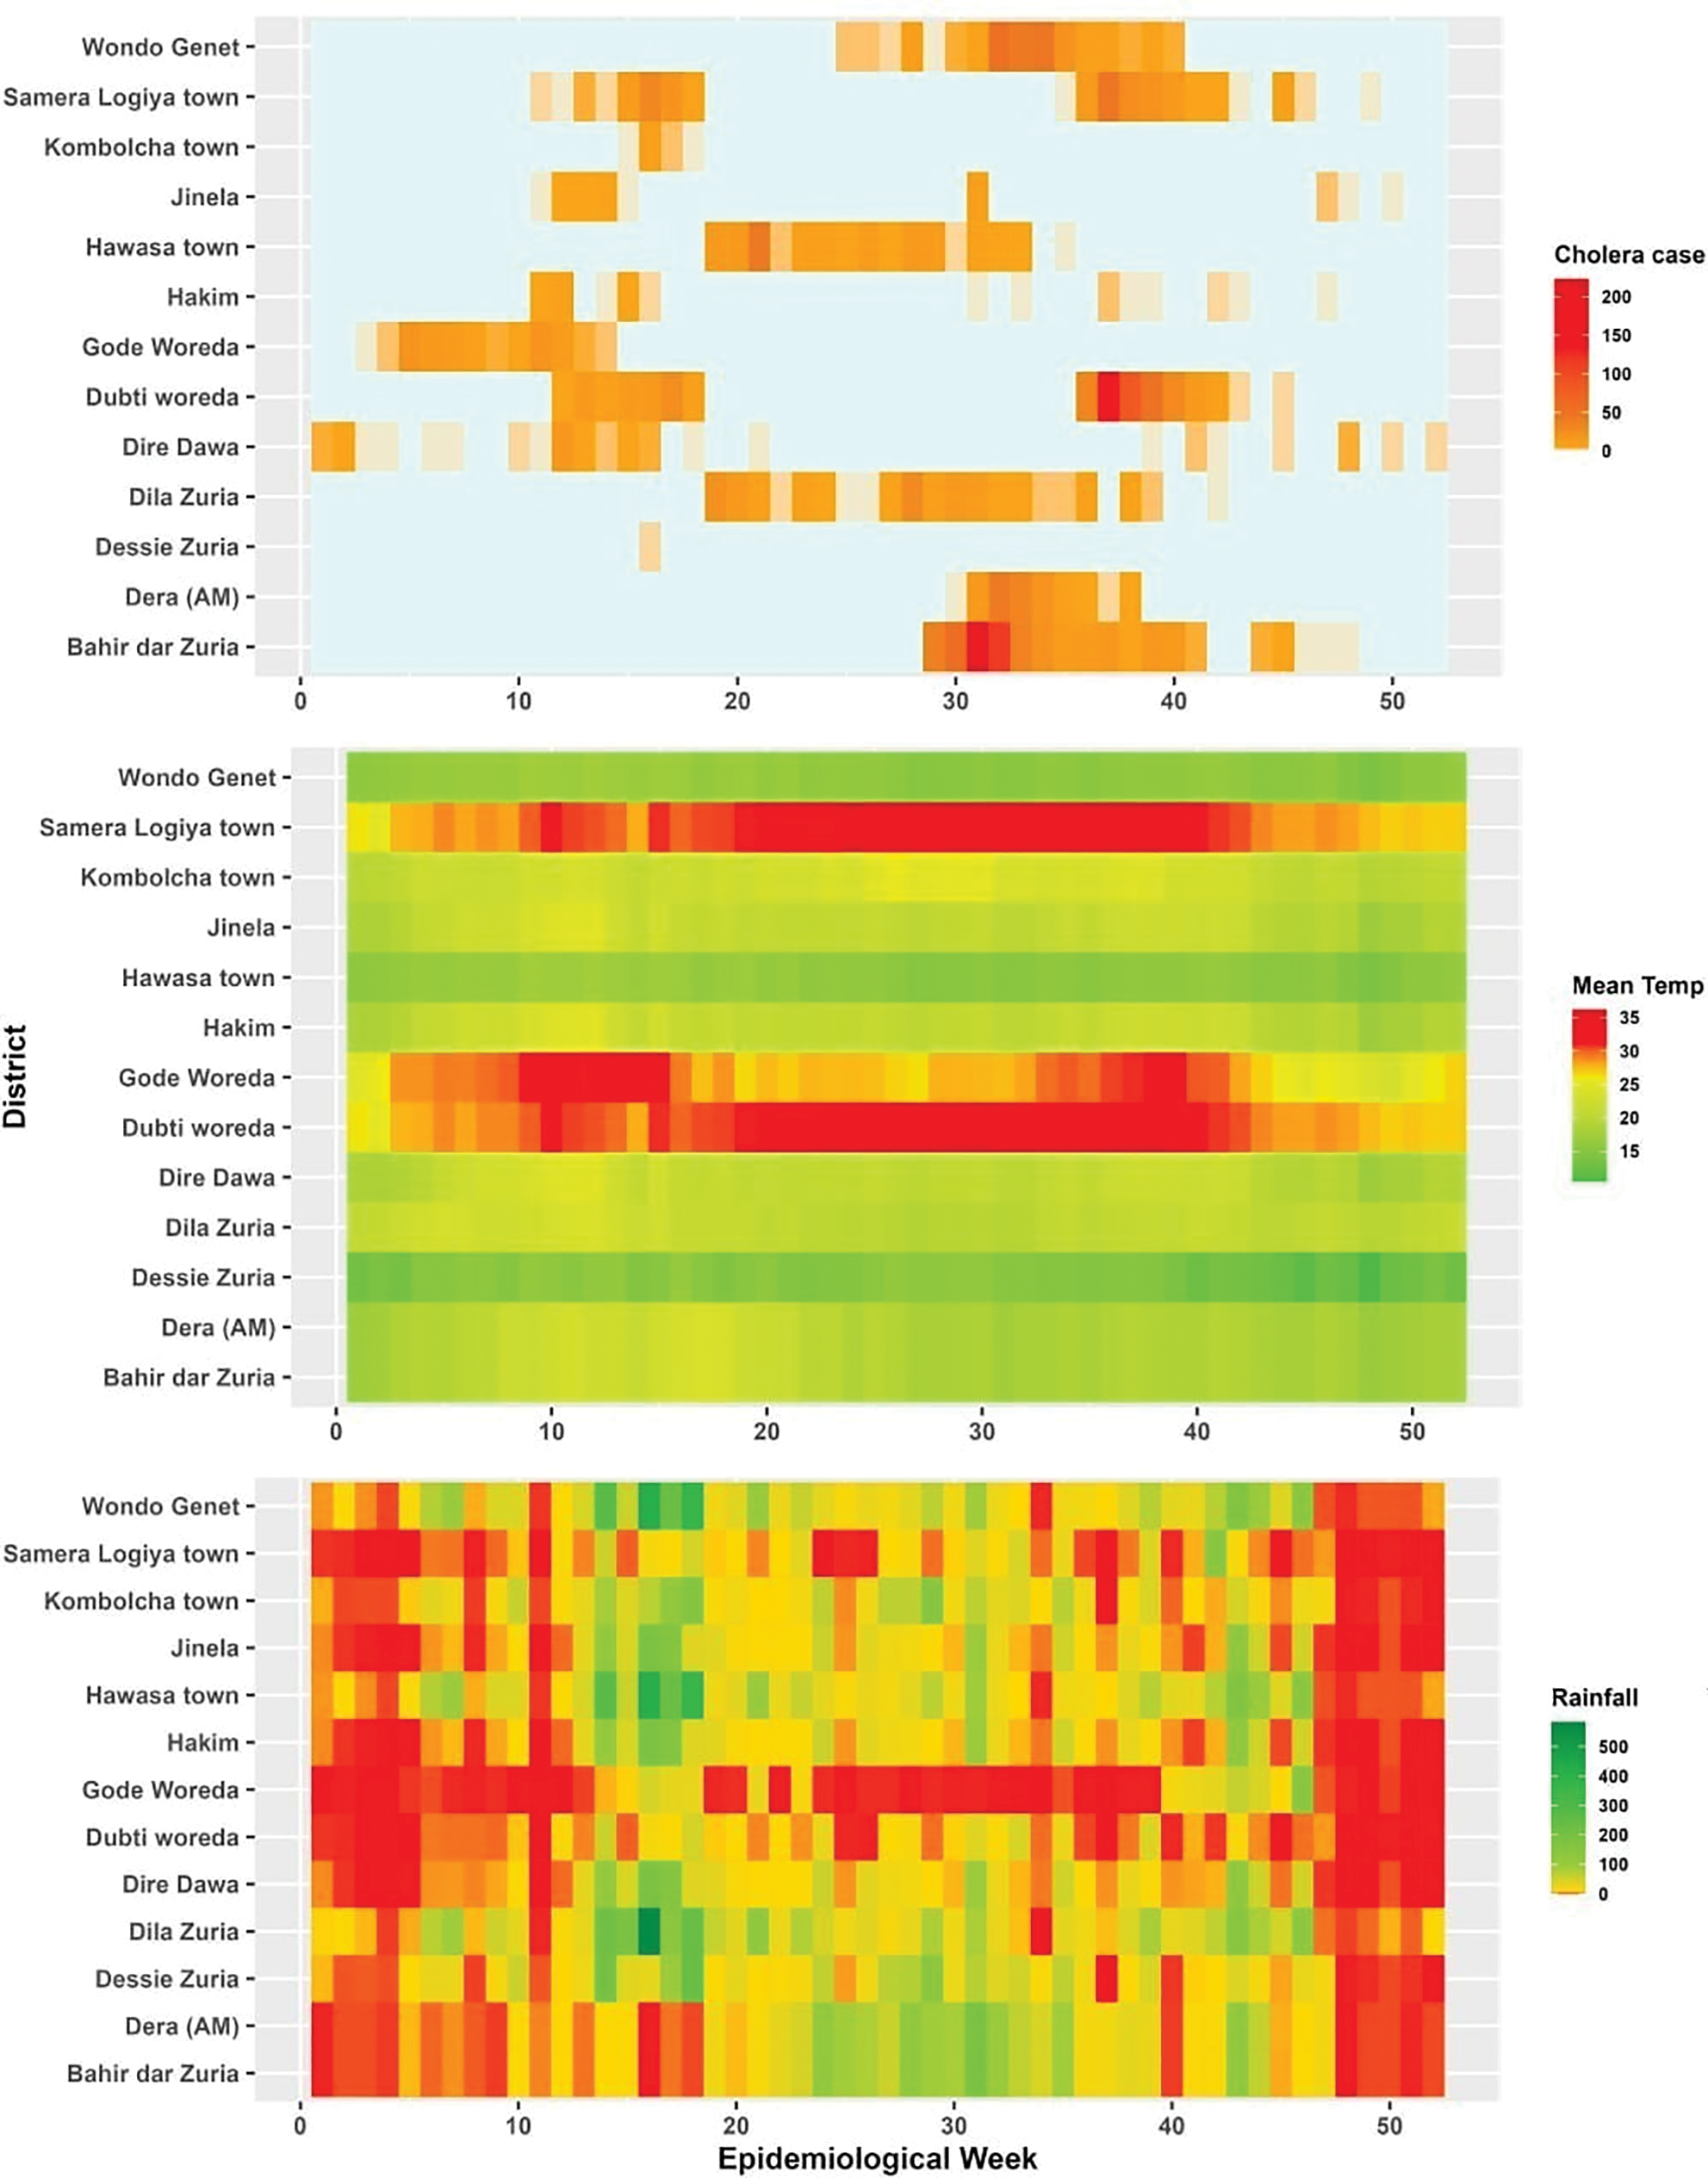
Figure 4
Heatmap of cholera incidence in relation to temperature and rainfall in the study districts, Ethiopia.
Table 2
Correlation values between cholera incidence and rainfall and temperature at lag 0 to 3 weeks in selected districts, Ethiopia.
| DISTRICT | CLIMATE VARIABLE | CORRELATION (P‑VALUE) | |||
|---|---|---|---|---|---|
| LAG 0 (AT SAME WEEK) | LAG 1 (AFTER 1 WEEK) | LAG 2 (AFTER 2 WEEKS) | LAG 3 (AFTER 3 WEEKS) | ||
| Bahir Dar Zuria | Rainfall | 0.618(0.001) | 0.519(0.001) | 0.439(0.001) | 0.468(0.001) |
| Temperature | –0.264(0.025) | –0.235(0.053) | –0.219(0.075) | –0.216(0.082) | |
| Dera (AM) | Rainfall | 0.397(0.001) | 0.594(0.001) | 0.566(0.001) | 0.551(0.001) |
| Temperature | –0.239(0.048) | –0.267(0.028) | –0.249(0.042) | –0.239(0.053) | |
| Dessie | Rainfall | –0.008(0.95) | 0.019(0.876) | 0.566(0.001) | –0.019(0.881) |
| Temperature | 0.191(0.116) | 0.074(0.55) | 0.032(0.797) | 0.174(0.163) | |
| Dilla | Rainfall | 0.01(0.933) | –0.008(0.946) | 0.022(0.86) | 0.075(0.552) |
| Temperature | –0.384(0.001) | –0.39(0.001) | –0.333(0.006) | –0.315(0.01) | |
| Dire Dawa | Rainfall | –0.051(0.677) | –0.103(0.402) | –0.049(0.694) | –0.166(0.182) |
| Temperature | 0.225(0.064) | 0.303(0.012) | 0.306(0.012) | 0.316(0.01) | |
| Dubti | Rainfall | –0.017(0.887) | –0.017(0.893) | 0.091(0.464) | 0.116(0.355) |
| Temperature | 0.356(0.003) | 0.372(0.002) | 0.35(0.004) | 0.326(0.007) | |
| Gode | Rainfall | –0.158(0.195) | –0.158(0.197) | –0.155(0.209) | –0.151(0.227) |
| Temperature | 0.352(0.003) | 0.307(0.011) | 0.236(0.054) | 0.083(0.506) | |
| Hakim | Rainfall | 0.015(0.905) | 0.01(0.934) | –0.018(0.883) | –0.135(0.279) |
| Temperature | 0.486(0.001) | 0.444(0.001) | 0.422(0.001) | 0.473(0.001) | |
| Hawassa Zuria | Rainfall | 0(0.836) | 0(0.757) | 0(0.865) | 0(0.301) |
| Temperature | –0.092(0.836) | –0.134(0.757) | –0.029(0.865) | –0.049(0.301) | |
| Jinela | Rainfall | 0.178(0.143) | –0.077(0.533) | –0.129(0.299) | –0.091(0.469) |
| Temperature | 0.108(0.375) | 0.302(0.012) | 0.344(0.004) | 0.325(0.008) | |
| Kombolcha | Rainfall | 0.259(0.032) | 0.136(0.268) | 0.231(0.06) | 0.082(0.513) |
| Temperature | 0.017(0.89) | –0.004(0.975) | –0.07(0.575) | –0.003(0.98) | |
| Semera Logia | Rainfall | 0.04(0.744) | –0.004(0.975) | 0.094(0.448) | 0.149(0.232) |
| Temperature | 0.321(0.007) | 0.342(0.004) | 0.302(0.013) | 0.303(0.014) | |
| Wondo Genet | Rainfall | –0.134(0.273) | –0.053(0.668) | –0.047(0.704) | 0.047(0.707) |
| Temperature | –0.258(0.032) | –0.291(0.016) | –0.299(0.014) | –0.312(0.011) | |
[i] Note: values in Bold and Italic indicate significant value at P‑value of 0.05.
Table 3
Observed associations of temperature and rainfall parameters for Vibrio Cholerae proliferation at epidemic onset in selected districts, Ethiopia.
| DISTRICT | CLIMATE VARIABLE | THRESHOLDS FOR PROLIFERATION OF VIBRIO CHOLERAE | |||
|---|---|---|---|---|---|
| LAG 0 (AT SAME WEEK) | LAG 1 (AFTER 1 WEEK) | LAG 2 (AFTER 2 WEEKS) | LAG 3 (AFTER 3 WEEKS) | ||
| Bahir‑Dar Zuria | Rainfall | 106.2–15.3 | 90.1+31.3 | 85.3–30.1 | 80.8–1.3 |
| Temperature | 16.9 +1.5 | 17.1+1.1 | 17.6+0.6 | 18.3+0.8 | |
| Dera (AM) | Rainfall | 112.0–26.4 | 106.2–15.3 | 90.1+31.3 | 85.3–30.1 |
| Temperature | 16.8+1.7 | 16.9+1.5 | 17.1+1.1 | 17.6+0.6 | |
| Dessie | Rainfall | 14.0+16.7 | 13.8+22.9 | 19.2+188.1 | 11.8+8.8 |
| Temperature | 15.3+1.1 | 15.4–0.3 | 15.3–0.8 | 15.3+0.7 | |
| Dilla | Rainfall | 56.5–40.4 | 43.9+4 | 26.7+52.3 | 24.8+63.5 |
| Temperature | 22.5–0.3 | 23.0–1.7 | 23.7–2.5 | 23.9–2.8 | |
| Dire Dawa | Rainfall | 11.9+1.5 | 21.9+9.3 | 36.1–31.4 | 34.8–21.5 |
| Temperature | 21.0+1.1 | 20.9+1.4 | 20.7+1.6 | 20.6+1.2 | |
| Dubti | Rainfall | 18.7–17.6 | 21.6+6.6 | 21.7–18.9 | 29.6+15.1 |
| Temperature | 31.4+2.7 | 31.2+1.7 | 31.1+2.1 | 30.8+1.3 | |
| Gode | Rainfall | 0.3–0.3 | 0.3–0.2 | 0.3–0.3 | NA |
| Temperature | 27.5+1.1 | 27.0–1.2 | 26.6–1.9 | NA | |
| Hakim | Rainfall | 32.8+66.2 | 32.2–25.5 | 30.2–19.2 | 30.6–10.1 |
| Temperature | 20.4–0.2 | 20.4+0.8 | 20.7+0.1 | 20.9–0.1 | |
| Hawassa Zuria | Rainfall | 57.2+94.9 | 53.1–22.1 | 50.9–36.7 | 40.7–1.9 |
| Temperature | 16.3–0.6 | 16.7+0.4 | 16.9–0.4 | 17.2–0.9 | |
| Jinela | Rainfall | 3.9–3.9 | 4.7–4.2 | 4.4+45.6 | 6.4–5.2 |
| Temperature | 19.0+0.3 | 19.2+0.7 | 19.4–0.3 | 19.6–0.4 | |
| Kombolcha | Rainfall | 15.7+22.9 | 21.3+65.9 | 16.8+13.0 | 18.8–4.4 |
| Temperature | 23.2–1.1 | 23.0–2.0 | 22.7–0.4 | 22.5+0.8 | |
| Semera Logia | Rainfall | 21.6+6.6 | 21.7–18.9 | 29.6+15.1 | 29.1–15.8 |
| Temperature | 31.2+1.7 | 31.1+2.1 | 30.8+1.3 | 30.6+2.5 | |
| Wondo Genet | Rainfall | 31.3–16.8 | 29.8+3.5 | 27.8+31.9 | 33.7–6.4 |
| Temperature | 15.0+1.0 | 15.3+0.6 | 15.7+0.4 | 15.9–0.1 | |
[i] Note: Threshold = 33 year mean +/‑ Anomaly.