
Table 1
Sociodemographic characteristics.
| ≤ 1 MONTH (N = 61) | > 1 MONTH (N = 116) | OVERALL (N = 177) | |
|---|---|---|---|
| Weight (kg) | |||
| Median [IQR] | 2.5 [1.7, 3.0] | 11.3 [7.0, 21.8] | 5.1 [2.8, 15.0] |
| Missing (%) | 0 (0) | 10 (8.6) | 10 (5.6) |
| Gender, n (%) | |||
| 1: Male | 33 (54.1) | 68 (58.6) | 101 (57.1) |
| 2: Female | 28 (45.9) | 45 (38.8) | 73 (41.2) |
| Missing | 0 (0) | 3 (2.6) | 3 (1.7) |
| Region of Residence, n (%) | |||
| 1: Kigali | 20 (32.8) | 36 (31.0) | 56 (31.6) |
| 2: Southern Province | 12 (19.7) | 18 (15.5) | 30 (16.9) |
| 3: West Province | 4 (6.6) | 16 (13.8) | 20 (11.3) |
| 4: North Province | 15 (24.6) | 29 (25.0) | 44 (24.9) |
| 5: East Province | 10 (16.4) | 12 (10.3) | 22 (12.4) |
| 6: Other | 0 (0) | 1 (0.9) | 1 (0.6) |
| Missing | 0 (0) | 4 (3.4) | 4 (2.3) |
| Health Insurance, n (%) | |||
| CBHI Insurance | 56 (91.8) | 106 (91.4) | 162 (91.5) |
| Private Health Insurance | 1 (1.6) | 0 (0) | 1 (0.6) |
| Rwandaise d’Assurance Maladie (RAMA) and MMI | 0 (0) | 1 (0.9) | 1 (0.6) |
| Missing | 4 (6.6) | 9 (7.8) | 13 (7.3) |
Table 2
Clinical characteristics.
| ≤ 1 MONTH (N = 61) | > 1 MONTH (N = 116) | OVERALL (N = 177) | |
|---|---|---|---|
| Time between symptom onset and hospitalization (days) | |||
| Median [IQR] | 0.0 [0.0, 4.0] | 4.5 [2.0, 21.0] | 3.0 [0.0, 7.0] |
| Missing (%) | 2 (3.3) | 22 (19) | 24 (13.6) |
| Time between initial hospital and PICU (days) | |||
| Median [IQR] | 5.5 [2.0, 13.2] | 2.0 [0.0, 7.0] | 3.0 [1.0, 9.8] |
| Missing (%) | 9 (14.8) | 54 (46.6) | 63(35.6) |
| Length of stay (days) | |||
| Median [IQR] | 5.0 [2.0, 13.0] | 5.0 [1.0, 14.5] | 5.0 [2.0, 14.0] |
| Missing (%) | 0 (0) | 4 (3.4) | 4 (2.3) |
| Entry unit, n (%) | |||
| 1: Emergency Room | 17 (27.9) | 62 (53.4) | 79 (44.6) |
| 2: General Unit | 17 (27.9) | 19 (16.4) | 36 (20.3) |
| 3: Other | 27 (44.3) | 29 (25.0) | 56 (31.6) |
| Missing | 0 (0) | 6 (5.2) | 6 (3.4%) |
| Surgery, n (%) | |||
| Yes | 46 (75.4) | 49 (42.2) | 95 (53.7) |
| Missing | 0 (0) | 0 (0) | 0 (0) |
| Admittance Delay, n (%) | |||
| Yes | 8 (13.1) | 16 (13.8) | 24 (13.6) |
| Missing | 0 (0) | 0 (0) | 0 (0) |
| Mortality, n (%) | |||
| Yes | 38 (62.3) | 59 (50.9) | 97 (54.8) |
| Missing | 0 (0) | 0 (0) | 0 (0) |
Table 3
Diagnoses at admission and discharge/death.
| DIAGNOSIS | ADMISSION | DISCHARGE |
|---|---|---|
| Congenital Defects | 54 | 48 |
| Primary Respiratory Failure | 48 | 38 |
| Systemic Infection | 37 | 25 |
| Sepsis | 35 | 72 |
| Neurological Insults | 35 | 40 |
| Cancer | 15 | 12 |
| Trauma | 15 | 10 |
| Malnutrition | 11 | 15 |
| Renal Failure | 8 | 9 |
| Other | 121 | 222 |
[i] 1Includes one NA value.
[ii] 2Includes three NA values.
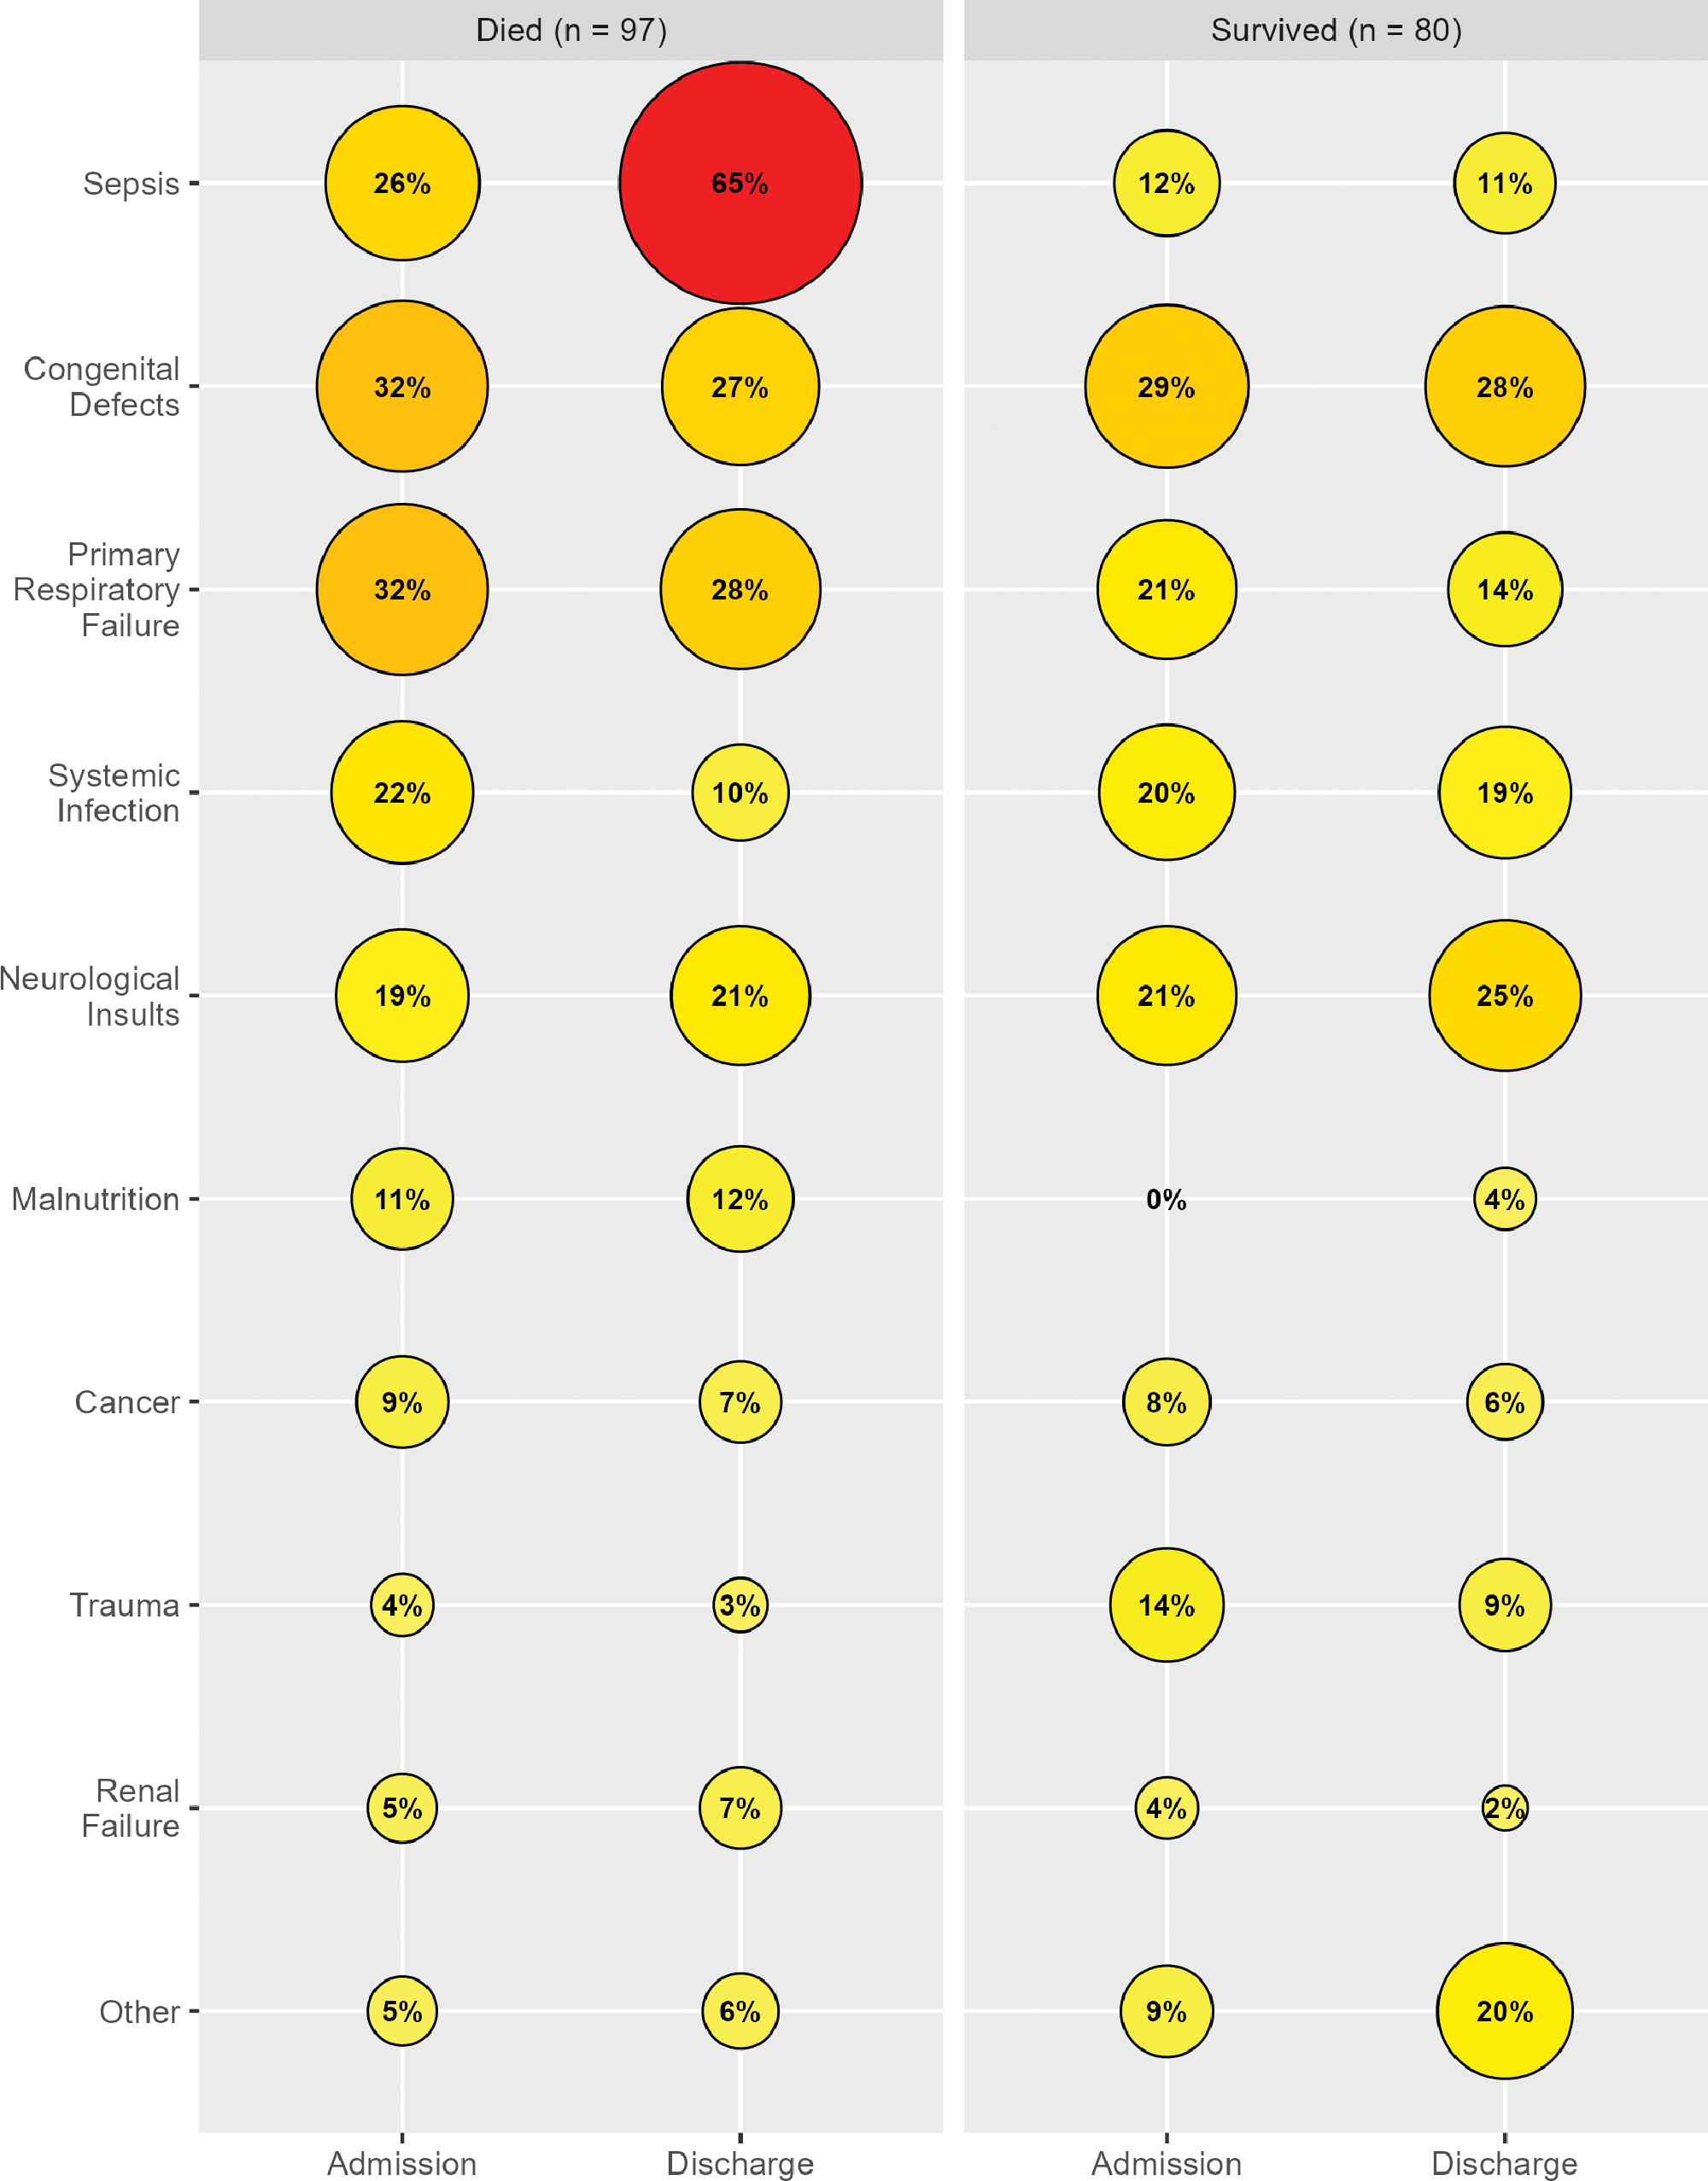
Figure 1
Diagnoses by patient outcome and time.
Table 4
Multivariable logistic regression results.
| CHARACTERISTICS | LOG(OR) | 95% CI | P‑VALUE |
|---|---|---|---|
| Admittance Delay | |||
| No | — | — | |
| Yes | 1.7 | 0.57, 3.1 | 0.006 |
| Age Category | |||
| ≤1 Month | — | — | |
| >1 Month | 0.28 | −0.93, 1.4 | 0.6 |
| Surgery | |||
| No | — | — | |
| Yes | 0.10 | −1.2, 1.3 | 0.9 |
| Age Category * Surgery | |||
| >1 Month * Yes | −2.0 | −3.6, −0.52 | 0.008 |
[i] Abbreviations: CI = Confidence Interval, OR = Odds Ratio
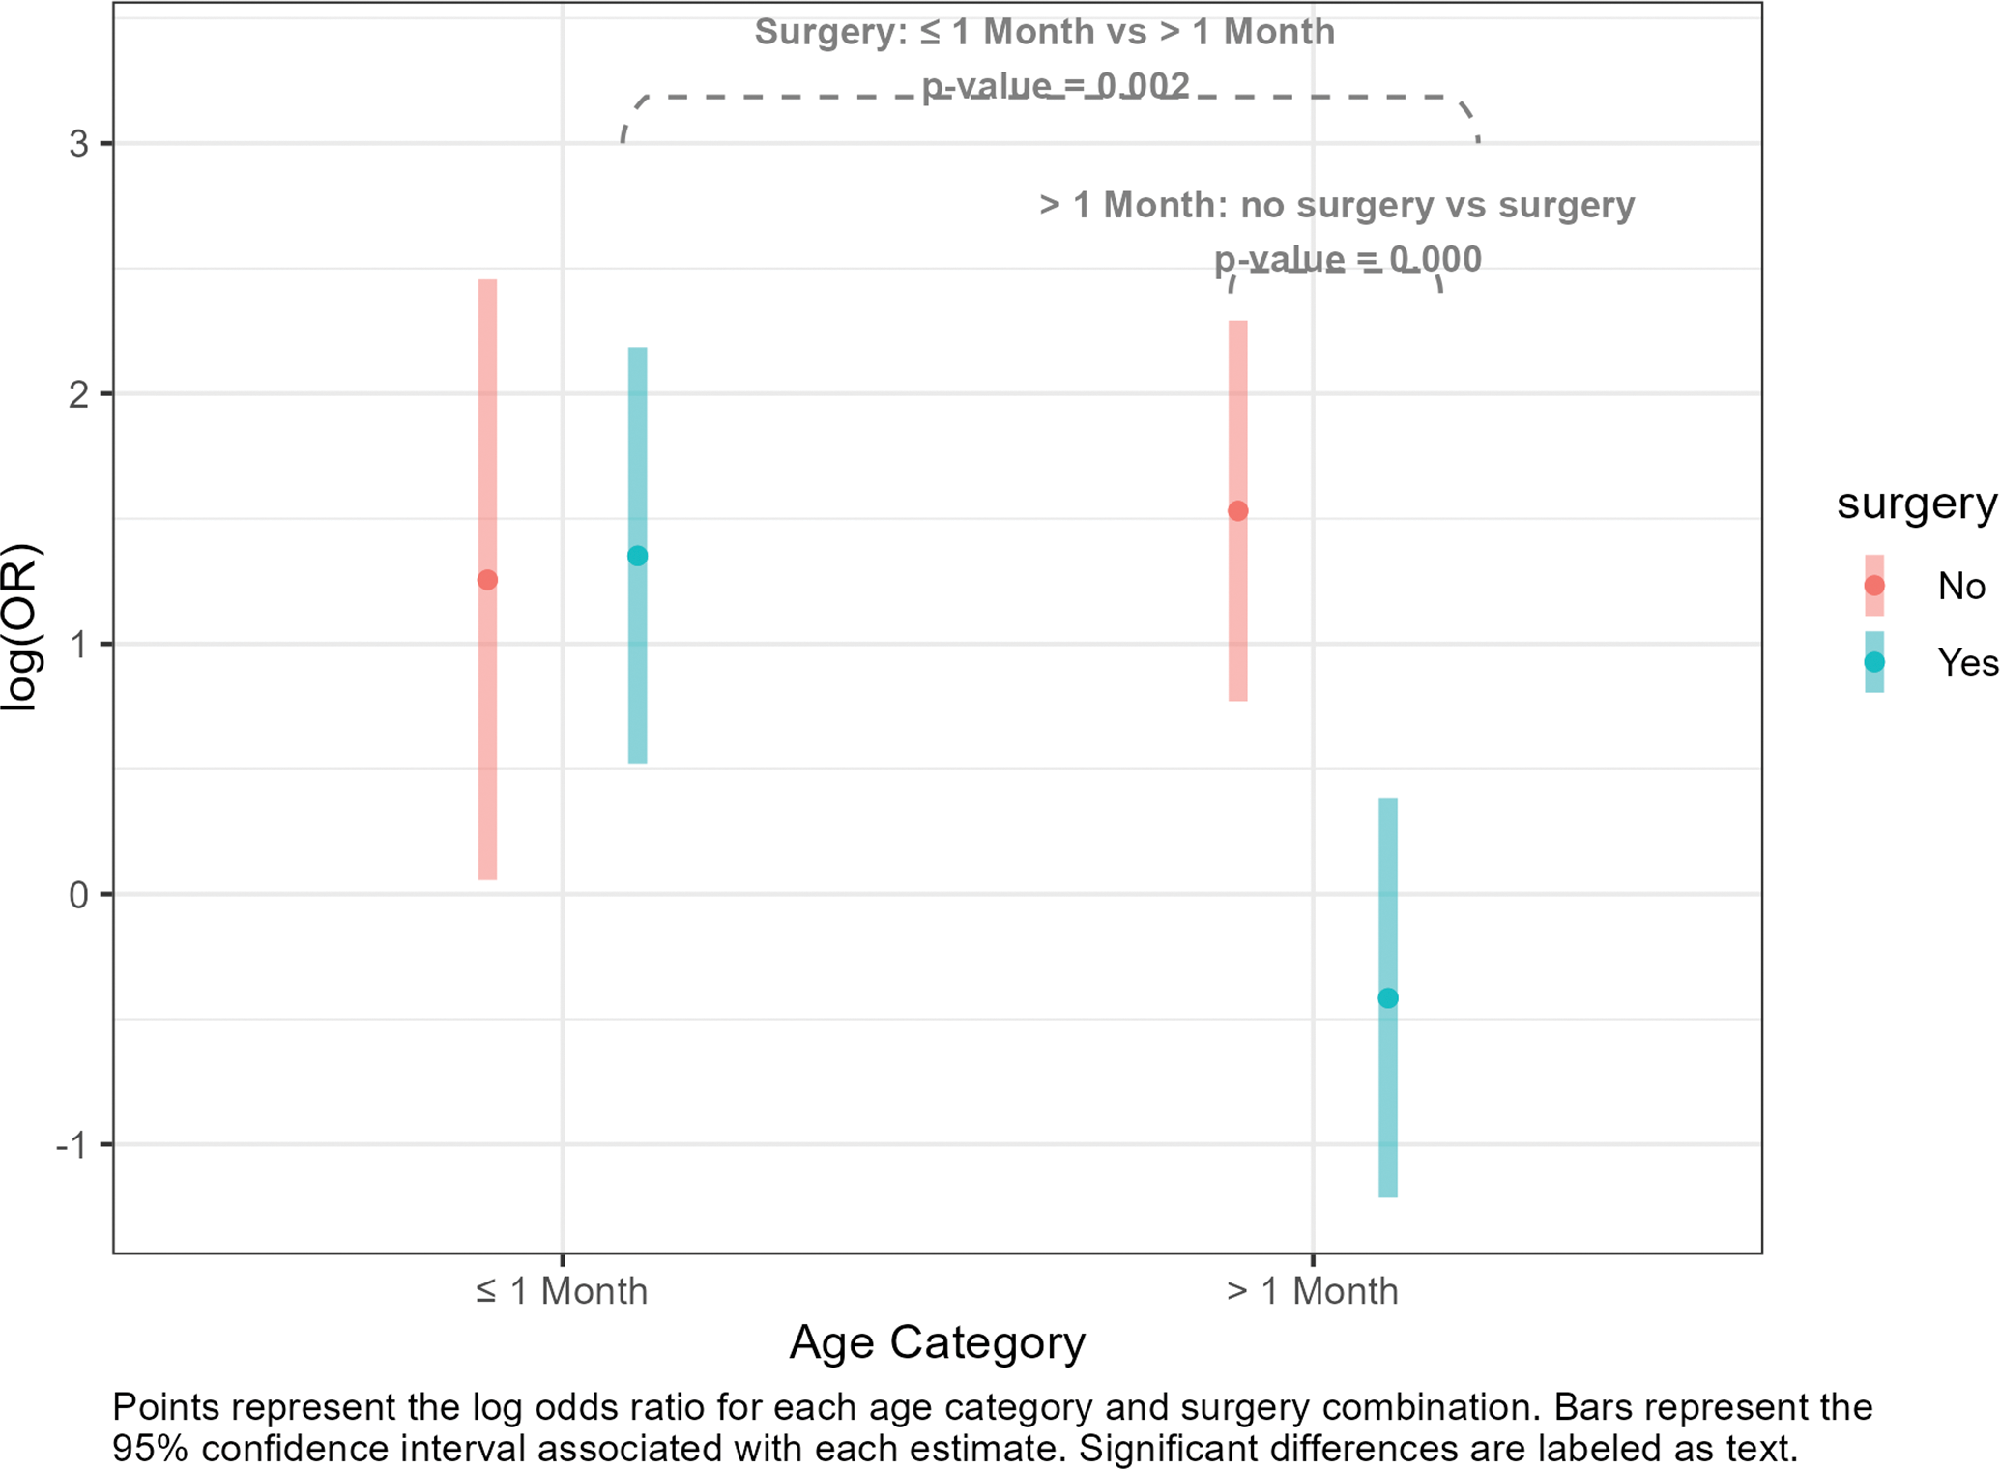
Figure 2
Interaction between surgery and age.