
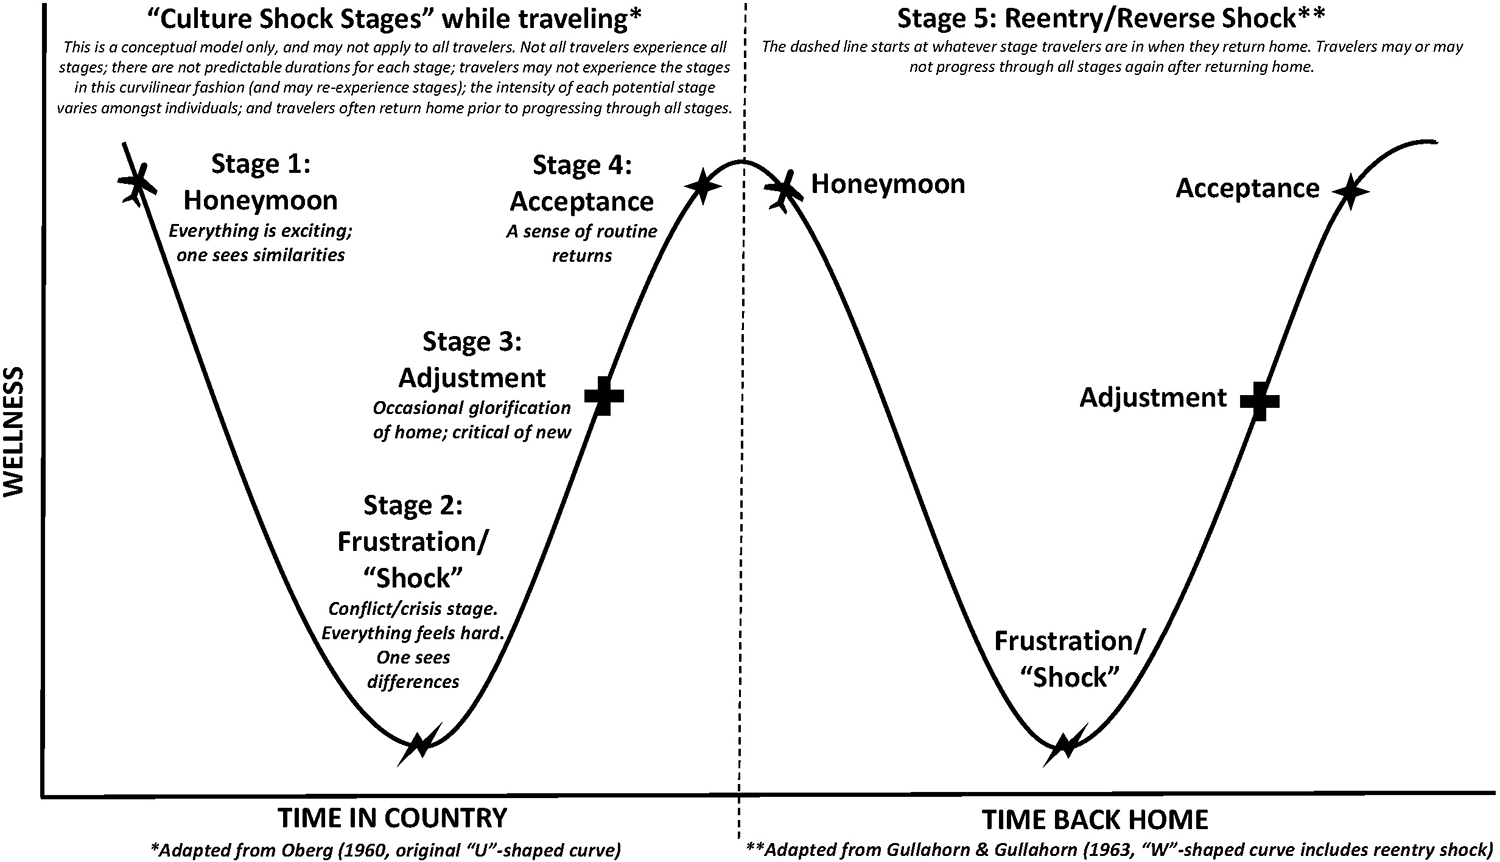
Figure 1
Conceptual framework of culture shock stages used for Project PRIME, adapted from Oberg (1960) and Gullahorn and Gullahorn (1963).
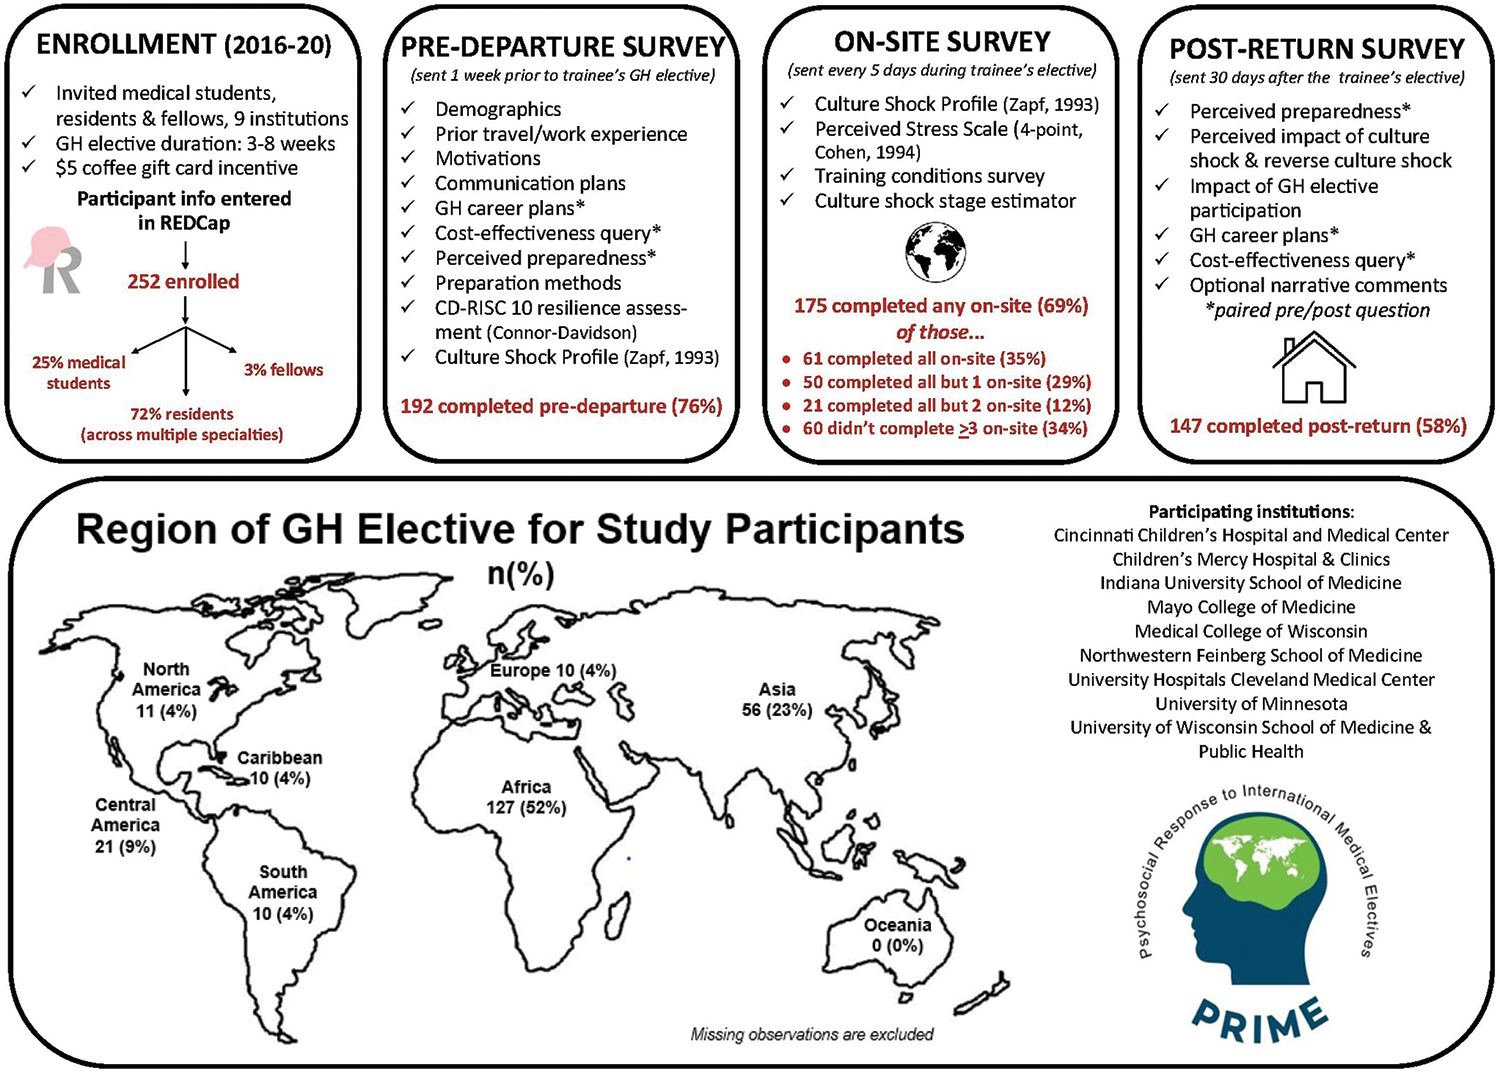
Figure 2
Project PRIME methodology: enrollment, survey distribution, survey completion rates, global health elective regions for study participants, and participating institutions.
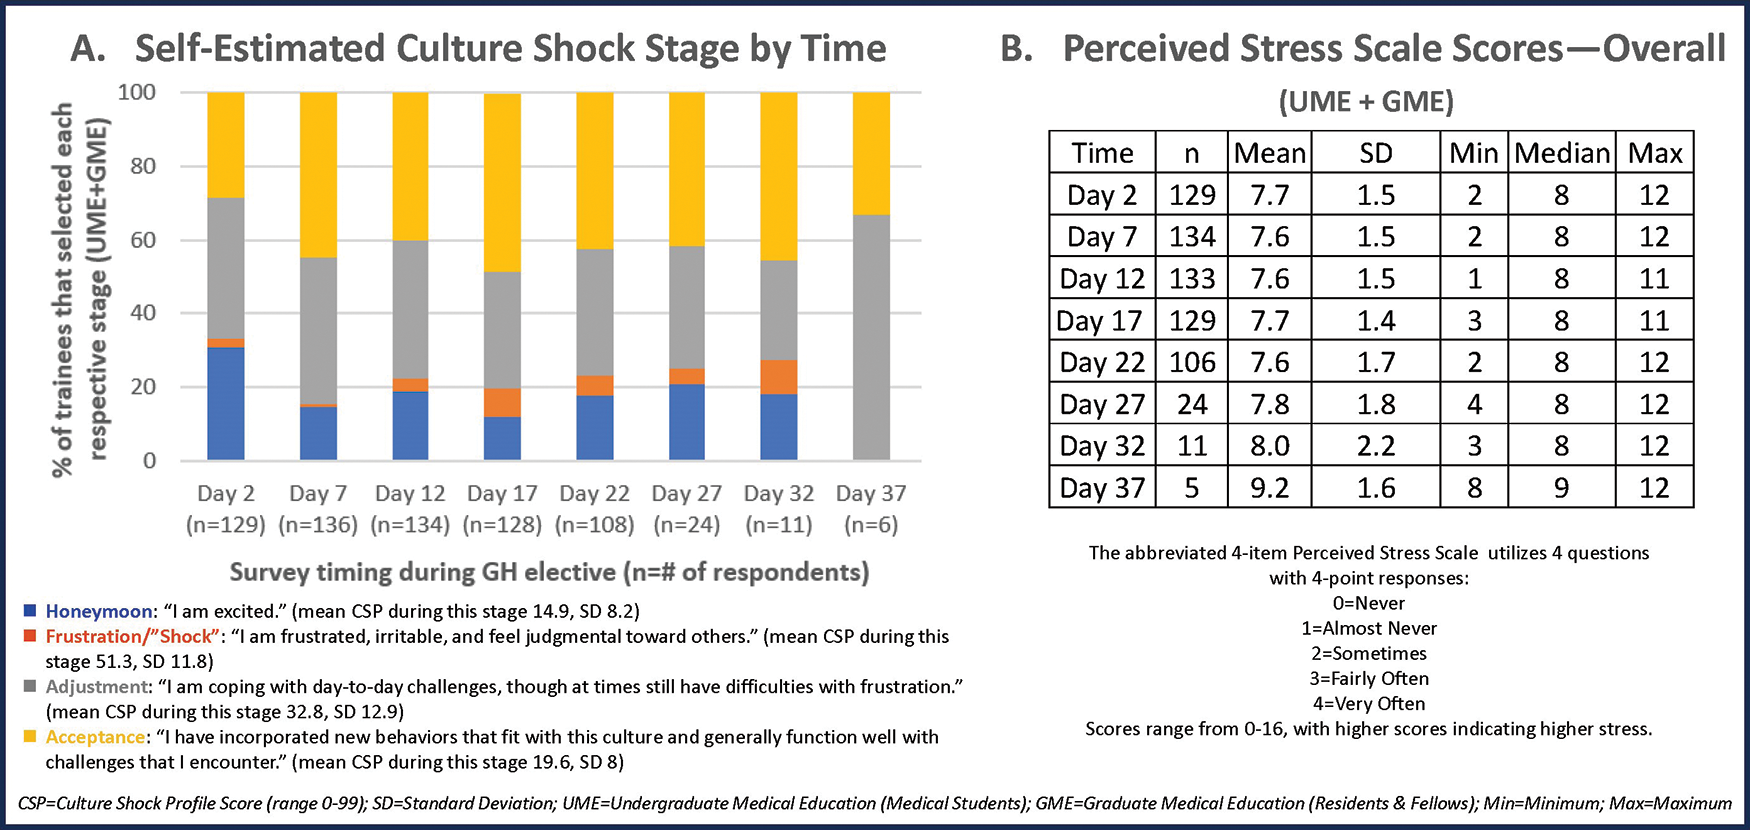
Figure 3
Summary of findings from the Culture Shock Stage Estimator (CSSE, A) and the Perceived Stress Scales (PSS) Scores (B).
Table 1
Baseline participant demographic, training, and medical elective characteristics by total and analyzed samples.
| TOTAL SAMPLE N (COL %) | ANALYSIS SAMPLE N (COL %) | P VALUE1 | |
|---|---|---|---|
| Total, n | 252 | 140 | |
| Demographic characteristics | |||
| Age | |||
| Mean (range) | 29 (24–40) | 29 (25–36) | 0.13 |
| Race and ethnicity | |||
| White, non‑Hispanic | 136 (54) | 99 (71) | 0.58 |
| Hispanic | 5 (2) | 3 (2) | |
| Black, non‑Hispanic | 10 (4) | 8 (6) | |
| Asian or Pacific Islander, non‑Hispanic | 26 (10) | 21 (15) | |
| Multiracial, non‑Hispanic | 4 (2) | 2 (1) | |
| Missing | 71 (28) | 7 (5) | |
| Gender | |||
| Male | 56 (22) | 41 (30) | 0.89 |
| Female | 137 (55) | 99 (70) | |
| Missing | 59 (23) | 0 (0) | |
| Marital Status | |||
| Single | 104 (41) | 75 (54) | 0.94 |
| Married/partnered | 80 (32) | 58 (41) | |
| Other | 9 (4) | 7 (5) | |
| Missing | 59 (23) | 0 (0) | |
| Prior work experience outside USA | |||
| Yes | 131 (52) | 97 (69) | 0.45 |
| No | 61 (24) | 42 (30) | |
| Missing | 60 (24) | 1 (1) | |
| Prior travel experience in elective site | |||
| Yes | 39 (16) | 28 (20) | 0.91 |
| No | 154 (61) | 112 (80) | |
| Missing | 59 (23) | 0 (0) | |
| Prior work experience in elective site | |||
| Yes | 25 (10) | 18 (13) | 0.95 |
| No | 168 (67) | 122 (87) | |
| Missing | 59 (23) | 0 (0) | |
| Provided medical care outside USA | |||
| Yes | 119 (47) | 90 (64) | 0.28 |
| No | 73 (29) | 50 (36) | |
| Missing | 60 (24) | 0 (0) | |
| Predeparture resilience score (CD RISC‑10) | |||
| Mean (range) | 25 (13–30) | 25 (15–30) | 0.79 |
| Training characteristics | |||
| Training institution | |||
| Institution no. 1 | 13 (5) | 6 (4) | 0.08 |
| Institution no. 2 | 2 (1) | 1 (1) | |
| Institution no. 3 | 37 (15) | 22 (16) | |
| Institution no. 4 | 39 (15) | 29 (20) | |
| Institution no. 5 | 38 (15) | 14 (10) | |
| Institution no. 6 | 65 (26) | 33 (24) | |
| Institution no. 7 | 30 (12) | 19 (14) | |
| Institution no. 8 | 17 (7) | 10 (7) | |
| Institution no. 9 | 6 (2) | 2 (1) | |
| Missing | 5 (2) | 4 (3) | |
| Type of trainee | |||
| Medical student (UME trainee) | 63 (25) | 37 (26) | 0.04 |
| Resident (GME trainee) | 181 (72) | 102 (73) | |
| Fellow (subspecialty GME trainee) | 8 (3) | 1 (1) | |
| Year of training | |||
| Medical student (UME trainee) Year 2 | 1 (0) | 1 (1) | 0.006 |
| Medical student (UME trainee) Year 3 | 4 (2) | 1 (1) | |
| Medical student (UME trainee) Year 4 | 51 (20) | 37 (26) | |
| Resident, (GME trainee) postgraduate year 2 | 20 (8) | 19 (13) | |
| Resident, (GME trainee) Postgraduate year 3 | 104 (41) | 77 (55) | |
| Resident, (GME trainee) Postgraduate year 4 | 9 (4) | 4 (3) | |
| Fellow (subspecialty GME trainee) | 4 (2) | 1 (1) | |
| Missing | 59 (23) | 0 (0) | |
| Completion of a simulation preparation activity | |||
| Yes | 129 (51) | 96 (69) | 0.41 |
| No | 64 (26) | 44 (31) | |
| Missing | 59 (23) | 0 (0) | |
| Predeparture meeting(s) with a faculty mentor | |||
| Yes | 172 (68) | 129 (92) | 0.03 |
| No | 21 (9) | 11 (8) | |
| Missing | 59 (23) | 0 (0) | |
| Predeparture curriculum | |||
| Yes | 178 (71) | 128 (91) | 0.76 |
| No | 15 (6) | 12 (9) | |
| Missing | 59 (23) | 0 (0) | |
| Didactic overview or independent reading about culture shock | |||
| Yes | 164 (65) | 122 (87) | 0.17 |
| No | 29 (12) | 18 (13) | |
| Missing | 59 (23) | 0 (0) | |
| Predeparture online module(s) | |||
| Yes | 124 (49) | 92 (66) | 0.45 |
| No | 68 (27) | 47 (33) | |
| Missing | 60 (24) | 1 (1) | |
| Discussions with trainees who worked at same or similar GH elective site | |||
| Yes | 155 (61) | 117 (83) | 0.05 |
| No | 37 (15) | 22 (16) | |
| Missing | 60 (24) | 1 (1) | |
| Researching the country of the GH elective | |||
| Yes | 172 (68) | 125 (89) | 0.90 |
| No | 21 (9) | 15 (11) | |
| Missing | 59 (23) | 0 (0) | |
| Language study/course in the host language | |||
| Yes | 42 (17) | 35 (25) | 0.08 |
| No | 151 (60) | 105 (75) | |
| Missing | 59 (23) | 0 (0) | |
| Medical elective characteristics | |||
| Region | |||
| Africa | 131 (52) | 63 (45) | 0.19 |
| Asia | 57 (23) | 37 (26) | |
| Caribbean | 10 (4) | 7 (5) | |
| Central America | 21 (9) | 14 (10) | |
| Europe | 10 (4) | 5 (4) | |
| North America | 11 (4) | 5 (4) | |
| Oceania | 0 (0) | 0 (0) | |
| South America | 11 (4) | 8 (5) | |
| Missing | 1 (0) | 1 (1) | |
| Duration, days | |||
| Median (Range) | 27 (17–88) | 26 (17–54) | 0.34 |
| Travel Cohort | |||
| Solo | 55 (22) | 39 (28) | 0.58 |
| Group | 135 (53) | 101 (72) | |
| Missing | 62 (25) | 0 (0) | |
| Elective site language ability | |||
| Not fluent | 118 (47) | 82 (59) | 0.13 |
| Partially, conversationally, and/or medically fluent | 73 (29) | 58 (41) | |
| Missing | 61 (24) | 0 (0) | |
[i] 1 Differences between respondents analyzed versus excluded due to insufficient responses were assessed using t‑tests, chi‑square tests, and Fisher’s exact tests as appropriate.
Table 2
Adjusted and unadjusted associations between selected predictors and Culture Shock Profile (CSP) score using a linear mixed effects model, n = 1401.
| ADJUSTED2 | UNADJUSTED | |||||||
|---|---|---|---|---|---|---|---|---|
| ESTIMATE | PERCENT CHANGE3 | SE | P VALUE | ESTIMATE | PERCENT CHANGE | SE | P VALUE | |
| INTRINSIC FACTORS (DEMOGRAPHICS) | ||||||||
| Resilience score (CD RISC‑10) | −0.0126 | −1.25 | 0.01 | 0.2078 | −0.03 | −3.31 | 0.01 | 0.0009* |
| Male gender (reference: female gender) | −0.0536 | −5.22 | 0.07 | 0.4638 | 0.10 | 10.97 | 0.08 | 0.1979 |
| Medical student, UME trainees (reference: resident and fellow, GME trainees) | 0.1971 | 21.79 | 0.09 | 0.0385* | 0.07 | 6.79 | 0.08 | 0.4238 |
| Traveled alone (reference: traveled with others) | 0.0899 | 9.41 | 0.08 | 0.2379 | 0.00 | −0.06 | 0.08 | 0.9941 |
| Prior provision of medical care outside USA (reference: no prior experience) | −0.0163 | −1.62 | 0.07 | 0.8159 | −0.14 | −12.67 | 0.07 | 0.0472* |
| Completion of simulation for a preparation activity (reference: no simulation activity) | 0.0831 | 8.67 | 0.09 | 0.3352 | 0.02 | 1.99 | 0.08 | 0.7969 |
| Partially, conversationally, and/or medically fluent (reference: not fluent) | 0.0321 | 3.26 | 0.08 | 0.6765 | −0.25 | −22.41 | 0.08 | 0.001* |
| EXTRINSIC FACTORS (TRAINING CONDITIONS) | ||||||||
| “I think there is a good support network here to help me deal with difficult situations” (support network on‑site) | −0.1053 | −9.99 | 0.03 | <0.0001* | −0.19 | −17.40 | 0.02 | <0.0001* |
| “I can communicate easily with my clinical supervisor and non‑supervisory providers” (ease of communication with clinical supervisor and non‑supervisory providers) | −0.0701 | −6.77 | 0.02 | 0.0036* | −0.13 | −12.22 | 0.02 | <0.0001* |
| “I can communicate easily with my patients” (ease of communication with patients) | −0.0684 | −6.61 | 0.03 | 0.0084* | −0.13 | −11.90 | 0.02 | <0.0001* |
| “There are sufficient resources to provide good care for my patients” (resource availability) | 0.0033 | 0.33 | 0.03 | 0.8996 | −0.08 | −7.87 | 0.02 | 0.0002* |
| “I feel overwhelmed by the medical needs in this community” (medical needs in the community) | 0.0939 | 9.84 | 0.03 | 0.0005* | 0.11 | 12.00 | 0.02 | <0.0001* |
| “I have a clear sense of my role and how I can be helpful” (clarity of role) | −0.1175 | −11.09 | 0.02 | <0.0001* | −0.18 | −16.20 | 0.02 | <.0001* |
| “I feel conflicted between my own ideas of medical care and a desire to respect local medical practices that differ” (degree of conflict related to local medical practices) | 0.0592 | 6.10 | 0.02 | 0.0103* | 0.09 | 9.74 | 0.02 | <0.0001* |
| “Number of patient deaths that have occurred over the past 5 days that I am aware of” (patient mortality) | 0.0186 | 1.88 | 0.01 | 0.0279* | 0.03 | 2.69 | 0.01 | 0.0007* |
| “Increasing severity of health status of the majority of patients over the past 5 days” (level of patient acuity) | 0.0304 | 3.09 | 0.03 | 0.3508 | 0.07 | 7.11 | 0.03 | 0.0250* |
| “My role during the GH elective is a clinical provider” (reference: observer or educator) | 0.0340 | 3.46 | 0.06 | 0.6021 | −0.07 | −6.34 | 0.05 | 0.2268 |
| “Percent of personal responsibility that I felt for the outcomes of my patients over the past 5 days”4 | −0.0003 | −0.03 | 0.00 | 0.7895 | 0.00 | −0.12 | 0.00 | 0.2456 |
[i] Notes: SE, Standard Error.
[ii] 1 Statistically significant difference over time determined by linear mixed effects methods with a random intercept and slope, where the continuous outcome underwent a log(x + 1) transformation, predictors were modeled as categorical or continuous variables, and time modeled as a categorical variable.
[iii] 2 The adjusted model includes all covariates. The unadjusted model examines each variable independently.
[iv] 3 To ease interpretation, the percent change indicated by the slope estimate via standard back‑transformation is provided. For example, for every one‑unit increase in the independent variable (resilience score), our dependent variable (Culture Shock Profile score) decreases by a factor of about 0.0126 or 1.25%.
[v] 4 Percent of personal responsibility is operationalized as 0% meaning “you did not feel responsible for patient outcomes,” 50% meaning “you shared responsibility equally with other providers,” and 100% meaning “you felt fully responsible for patient outcomes”.
[vi] *Denotes significant P value < 0.05.
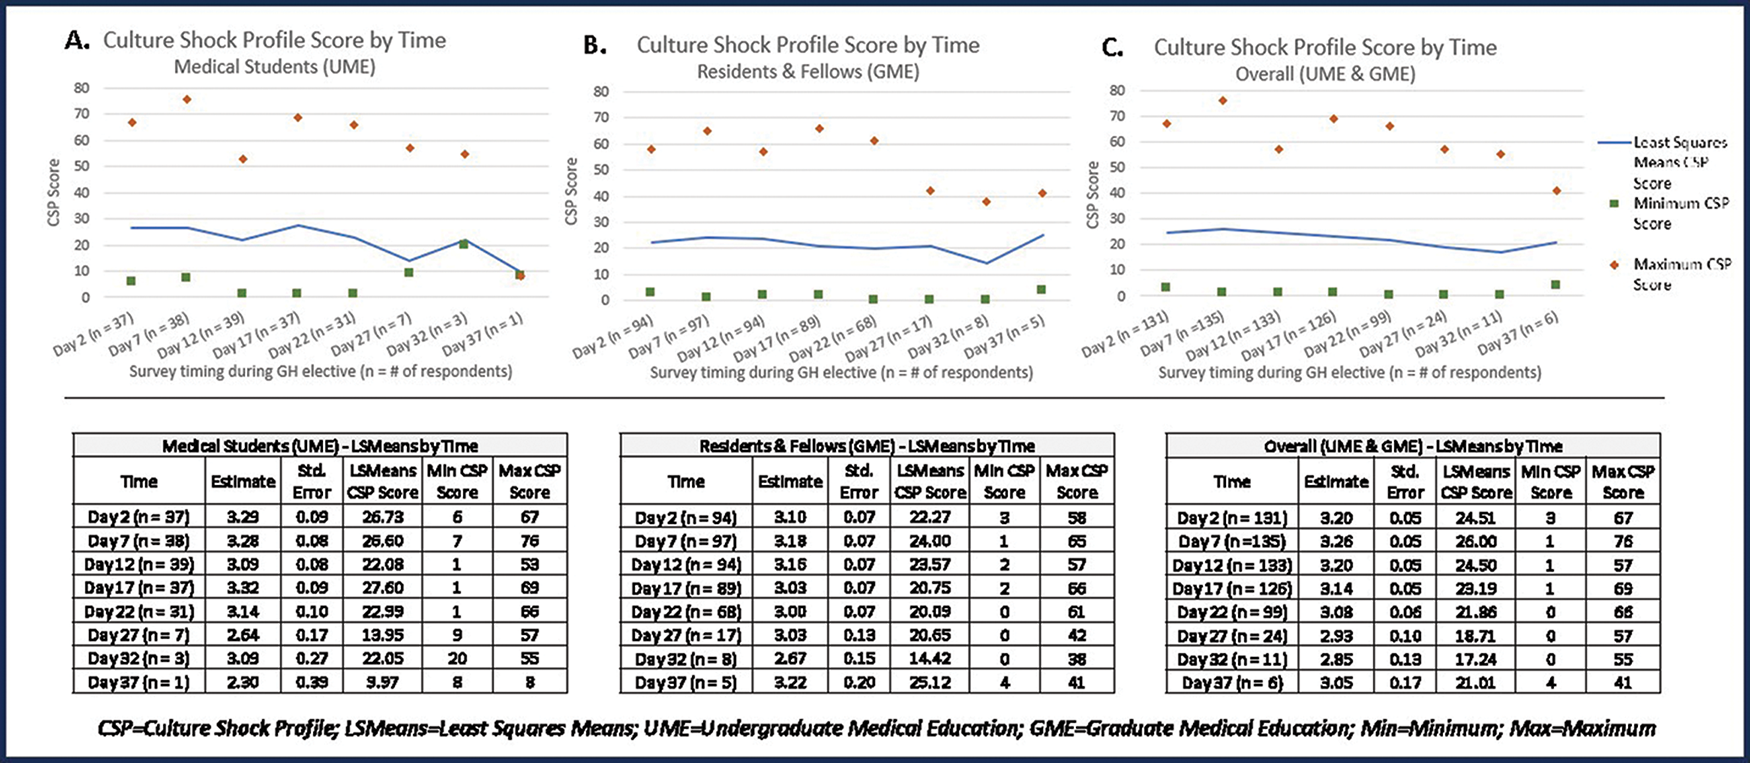
Figure 4
Mean CSP scores over time for (A) medical students; (B) residents and fellows; and (C) medical students, residents, and fellows combined.
Table 3
Impact of culture shock and reverse culture shock on medical trainees during and after global health electives (data obtained from postreturn survey of medical students, residents, and fellows (UME and GME trainees), n = 1471).
| How would you describe your experience of… | |||||||||
| Not significant n (row %) | Minimally significant n (row %) | Somewhat significant n (row %) | Very significant n (row %) | ||||||
| Culture shock during your GH elective? | 6 (4) | 63 (43) | 66 (45) | 11 (8) | |||||
| REVERSE culture shock after your return? | 38 (26) | 60 (42) | 38 (26) | 8 (6) | |||||
| The experience of culture shock had a NEGATIVE impact on my… | |||||||||
| Strongly disagree n (row %) | Disagree n (row %) | Neutral n (row %) | Agree n (row %) | Strongly agree n (row %) | |||||
| Ability to work with other local providers | 38 (26) | 66 (46) | 17 (12) | 22 (15) | 1 (1) | ||||
| Interactions with patients | 35 (25) | 69 (49) | 16 (11) | 22 (15) | 0 | ||||
| Interactions with local community members | 35 (25) | 67 (47) | 21 (15) | 19 (13) | 0 | ||||
| Ability to perform normal life functions (sleeping, eating, etc.) | 48 (33) | 57 (40) | 19 (13) | 19 (13) | 1 (1) | ||||
| Clinical performance | 31 (22) | 65 (46) | 26 (18) | 19 (14) | 0 | ||||
| Overall mood | 30 (21) | 45 (31) | 25 (17) | 37 (26) | 7 (5) | ||||
| Opinions about the local clinical environment | 27 (19) | 52 (37) | 20 (14) | 41 (29) | 2 (1) | ||||
| Desire to continue the elective | 60 (42) | 52 (36) | 12 (8) | 16 (11) | 4 (3) | ||||
| The experience of REVERSE culture shock had a NEGATIVE impact on my… | |||||||||
| Strongly disagree n (row %) | Disagree n (row %) | Neutral n (row %) | Agree n (row %) | Strongly agree n (row %) | |||||
| Ability to communicate easily with friends and family after my return | 50 (35) | 51 (35) | 17 (12) | 25 (17) | 1 (1) | ||||
| Ability to perform normal life functions (sleeping, eating, etc.) | 50 (35) | 65 (45) | 12 (8) | 17 (12) | 0 | ||||
| Overall mood | 48 (34) | 49 (34) | 15 (11) | 29 (20) | 2 (1) | ||||
| Perceptions on how medicine is practiced at my home institution | 27 (19) | 40 (28) | 26 (18) | 41 (28) | 10 (7) | ||||
[i] 1 Missing data is excluded from this analysis.