
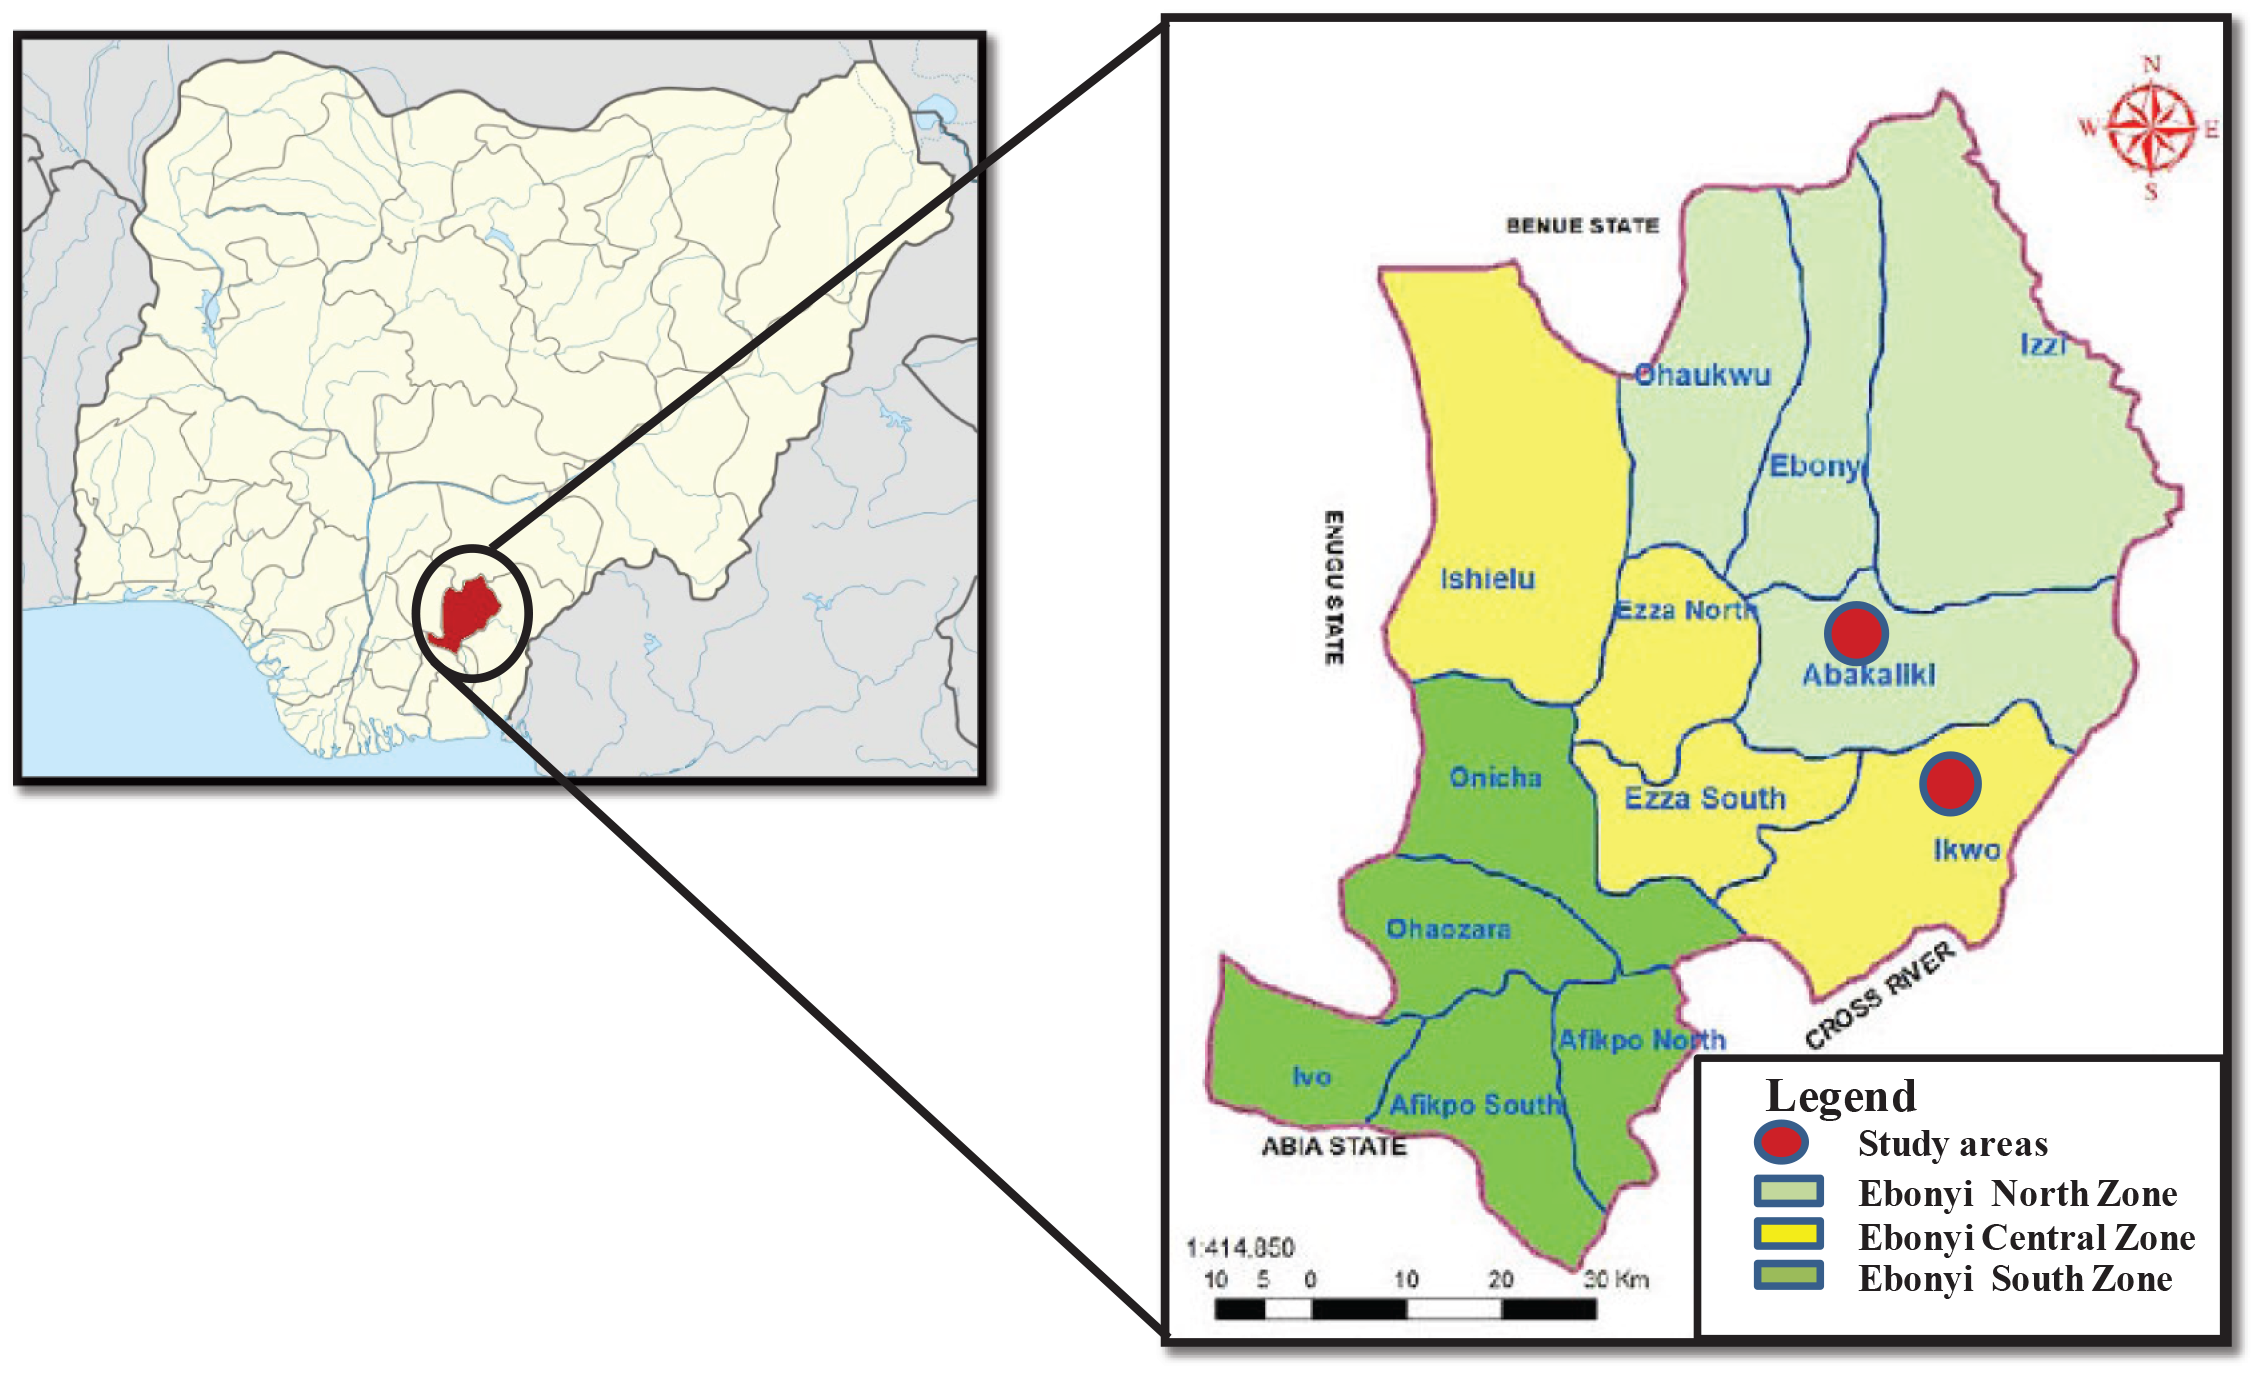
Figure 1
Map of Ebonyi State showing the study areas.
Table 1
Age and anthropometric indicators of nutritional status in the studied population.
| RURAL | URBAN LOW SES | URBAN MIDDLE SES | URBAN UPPER SES | |||||||||
|---|---|---|---|---|---|---|---|---|---|---|---|---|
| FEMALE (160) | MALE (41) | P‑VALUE (FEMALE VERSUS MALE) | FEMALE (123) | MALE (59) | P‑VALUE (FEMALE VERSUS MALE) | FEMALE (178) | MALE (128) | P‑VALUE (FEMALE VERSUS MALE) | FEMALE (50) | MALE (42) | P‑VALUE (FEMALE VERSUS MALE) | |
| Age | 15.0 ± 1.9 | 15.2 ± 2.0 | 0.503 | 14.9 ± 1.8 | 15.8 ± 1.5 | 0.001 | 12.7 ± 1.5 | 12.9 ± 1.7 | 0.226 | 11.9 ± 2.0 | 11.7 ± 1.6 | 0.673 |
| P‑value (rural versus others as per sex) | 0.390 | 0.224 | <0.001 | <0.001 | <0.001 | <0.001 | ||||||
| Weight | 45.6 ± 8.2 | 48.0 ± 10.9 | 0.187 | 50.7 ± 8.2 | 54.7 ± 9.0 | 0.151 | 50.4 ± 11.0 | 48.5 ± 11.7 | 0.123 | 53.4 ± 16.9 | 48.0 ± 11.0 | 0.014 |
| P‑value (rural versus others as per sex) | <0.001 | 0.002 | <0.001 | 0.793 | <0.001 | 0.992 | ||||||
| Height | 156.8 ± 7.1 | 161.1 ± 11.5 | 0.009 | 157.6 ± 8.2 | 161.7 ± 9.1 | 0.005 | 158.7 ± 8.8 | 160.7 ± 13.1 | 0.068 | 158.1 ± 11.0 | 155.7 ± 10.1 | 0.240 |
| P‑value (rural versus others as per sex) | 0.505 | 0.742 | 0.073 | 0.809 | 0.407 | 0.010 | ||||||
| BMI | 18.5 ± 2.6 | 18.3 ± 2.5 | 0.706 | 20.4 ± 3.1 | 20.8 ± 2.6 | 0.367 | 19.9 ± 3.5 | 18.6 ± 2.9 | <0.001 | 21.1 ± 5.3 | 19.7 ± 3.5 | 0.039 |
| P‑value (rural versus others as per sex) | <0.001 | <0.001 | <0.001 | 0.573 | <0.001 | 0.044 | ||||||
| WC | 69.2 ± 5.4 | 70.5 ± 6.0 | 0.267 | 67.3 ± 5.4 | 68.5 ± 6.0 | 0.242 | 68.3 ± 7.0 | 67.4 ± 7.0 | 0.261 | 71.9 ± 10.2 | 70.2 ± 7.7 | 0.232 |
| P‑value (rural versus others as per sex) | 0.013 | 0.133 | 0.195 | 0.009 | 0.013 | 0.862 | ||||||
| HC | 82.8 ± 7.3 | 82.6 ± 7.5 | 0.956 | 92.2 ± 7.3 | 86.6 ± 7.5 | 0.227 | 88.0 ± 10.9 | 84.5 ± 9.8 | 0.306 | 95.2 ± 19.2 | 88.6 ± 10.2 | 0.291 |
| P‑value (rural versus others as per sex) | 0.007 | 0.495 | 0.109 | 0.714 | 0.010 | 0.347 | ||||||
| WHpR | 0.84 ± 0.05 | 0.86 ± 0.04 | 0.434 | 0.78 ± 0.08 | 0.79 ± 0.05 | 0.519 | 0.79 ± 0.05 | 0.80 ± 0.04 | 0.605 | 0.77 ± 0.07 | 0.80 ± 0.05 | 0.271 |
| P‑value (rural versus others as per sex) | <0.001 | 0.014 | 0.001 | 0.016 | <0.001 | 0.032 | ||||||
| WHtR | 0.44 ± 0.03 | 0.44 ± 0.03 | 0.561 | 0.43 ± 0.04 | 0.42 ± 0.03 | 0.501 | 0.43 ± 0.04 | 0.42 ± 0.04 | 0.023 | 0.45 ± 0.06 | 0.45 ± 0.05 | 0.775 |
| P‑value (rural versus others as per sex) | 0.002 | 0.012 | 0.011 | 0.013 | 0.041 | 0.088 | ||||||
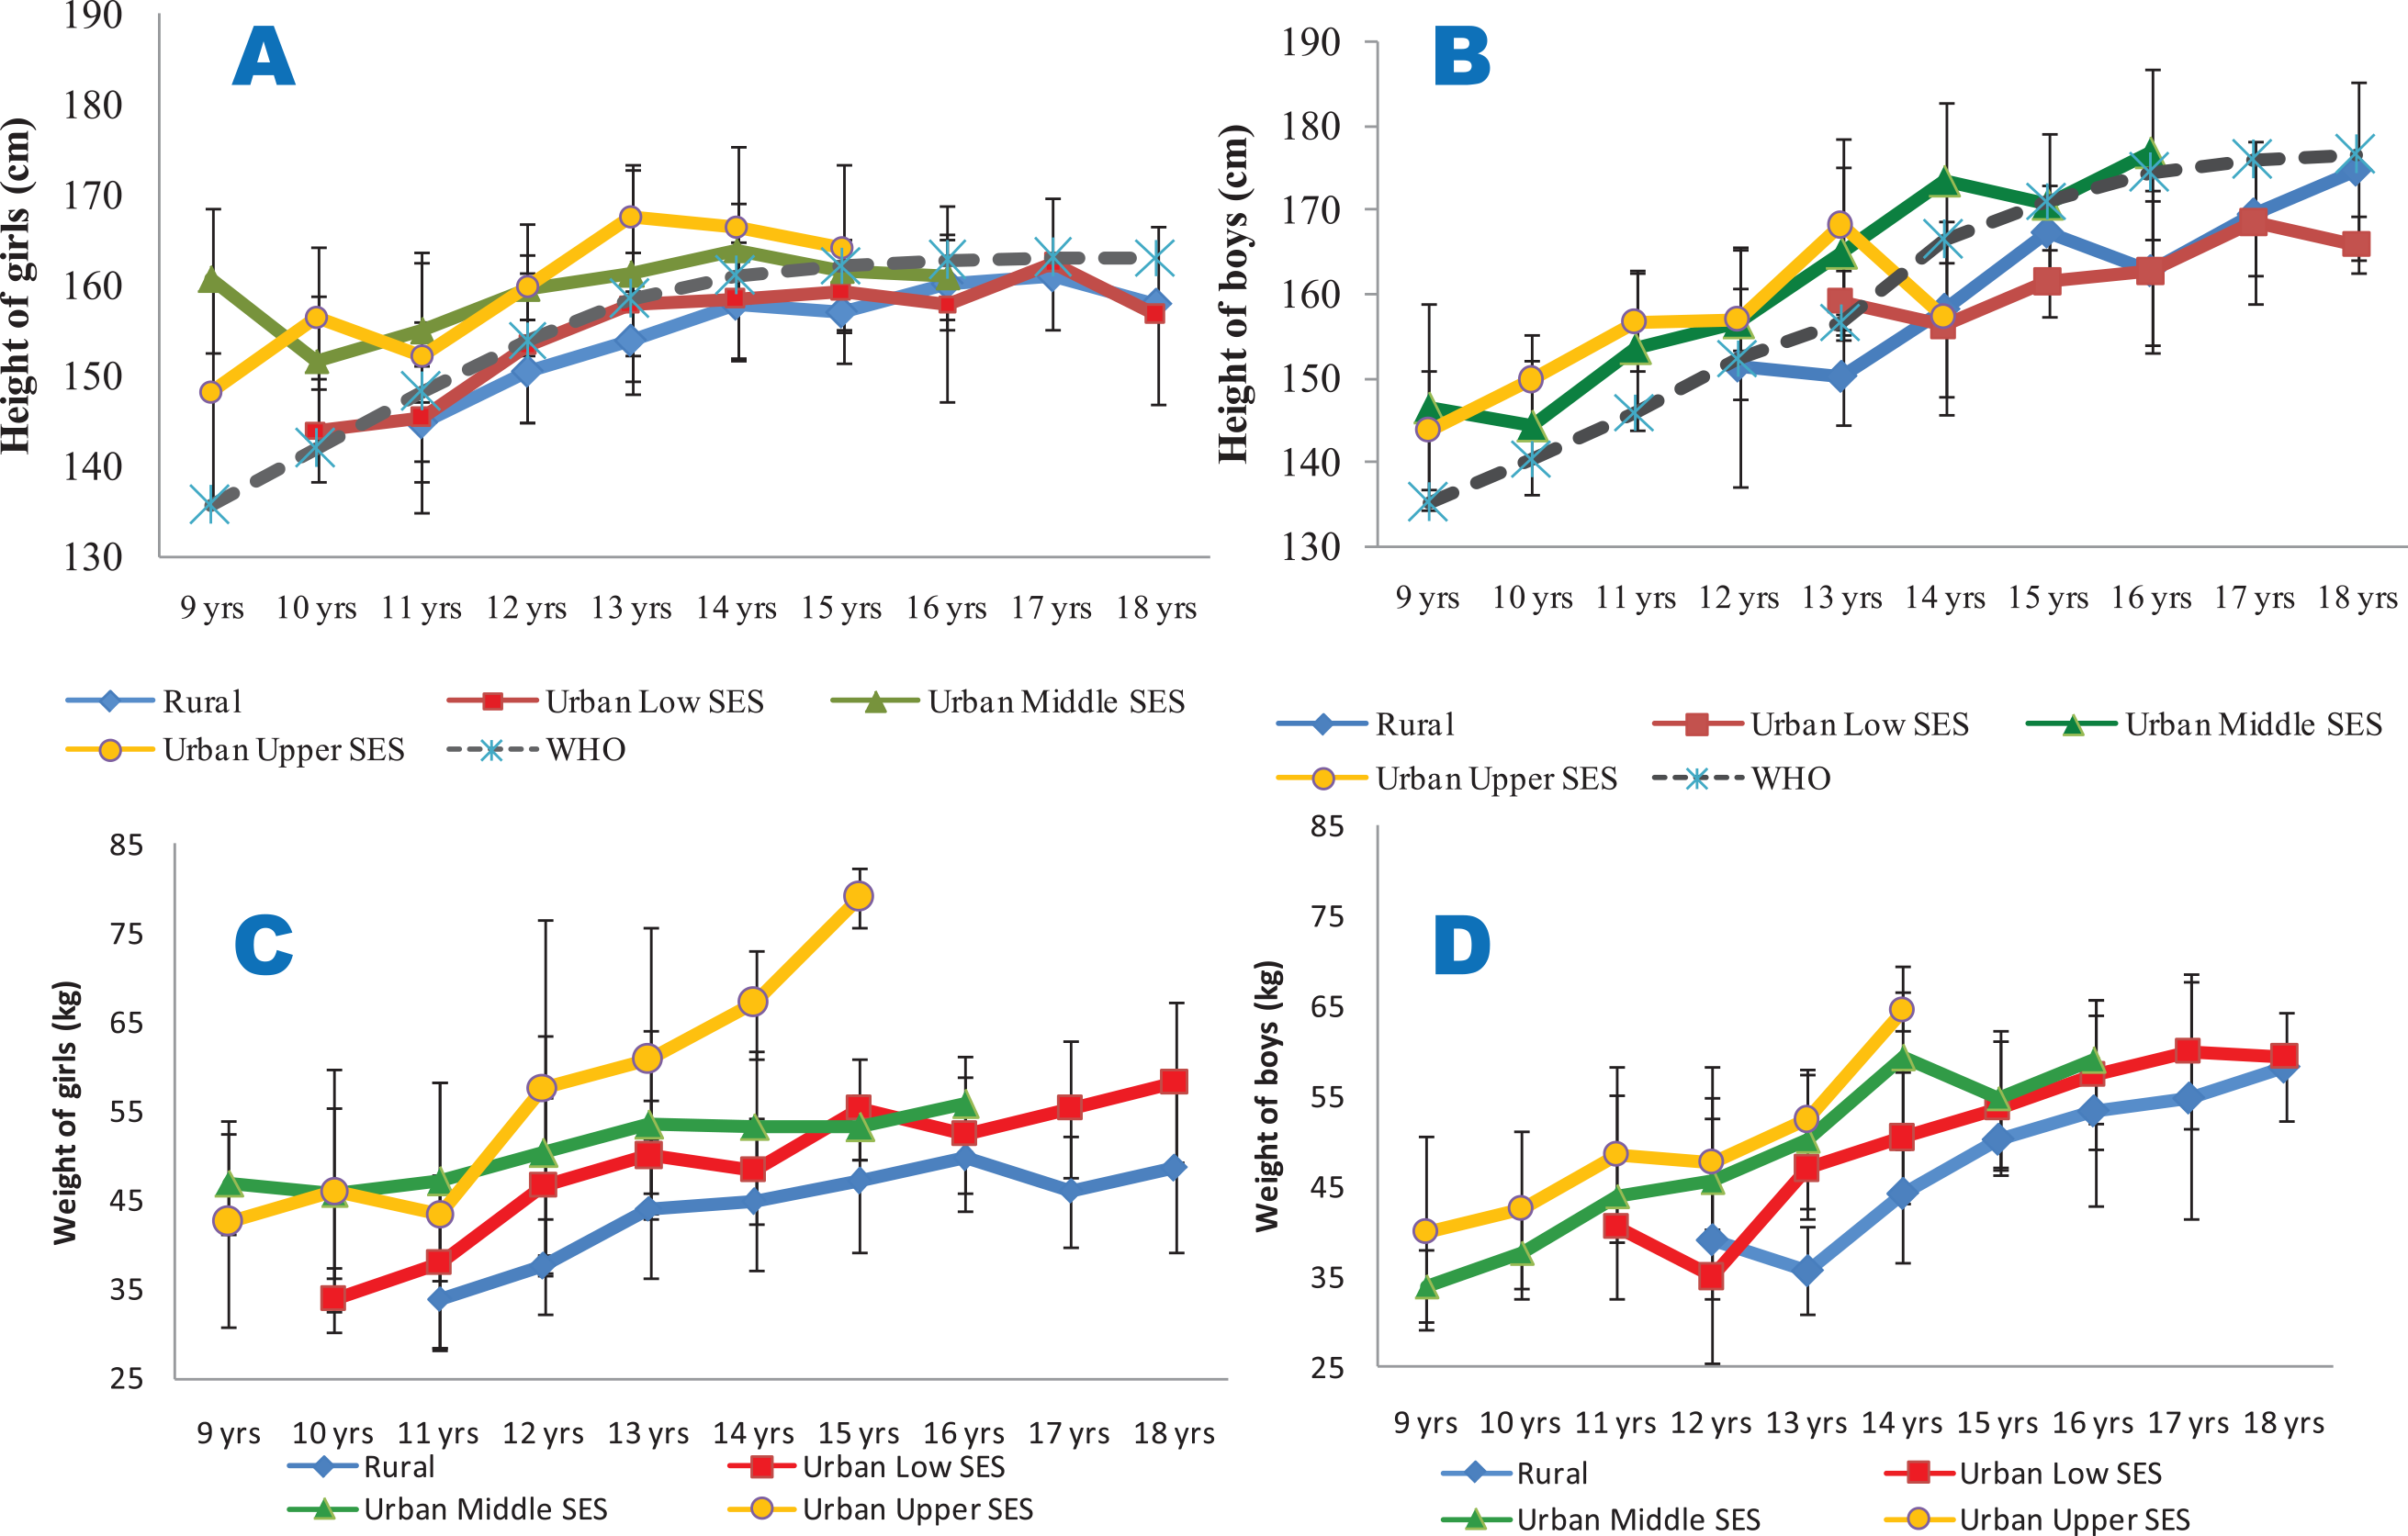
Figure 2
Mean heights (2A and 2B) and weights (2C and 2D) of the studied population.
2A (height for girls) and 2B (height for boys) are compared with the 85th percentiles of the WHO sex‑specific height reference dataset; 2C (weight for girls) and 2D (weight for boys). All the data are disaggregated as per place of residence and socio‑economic status.
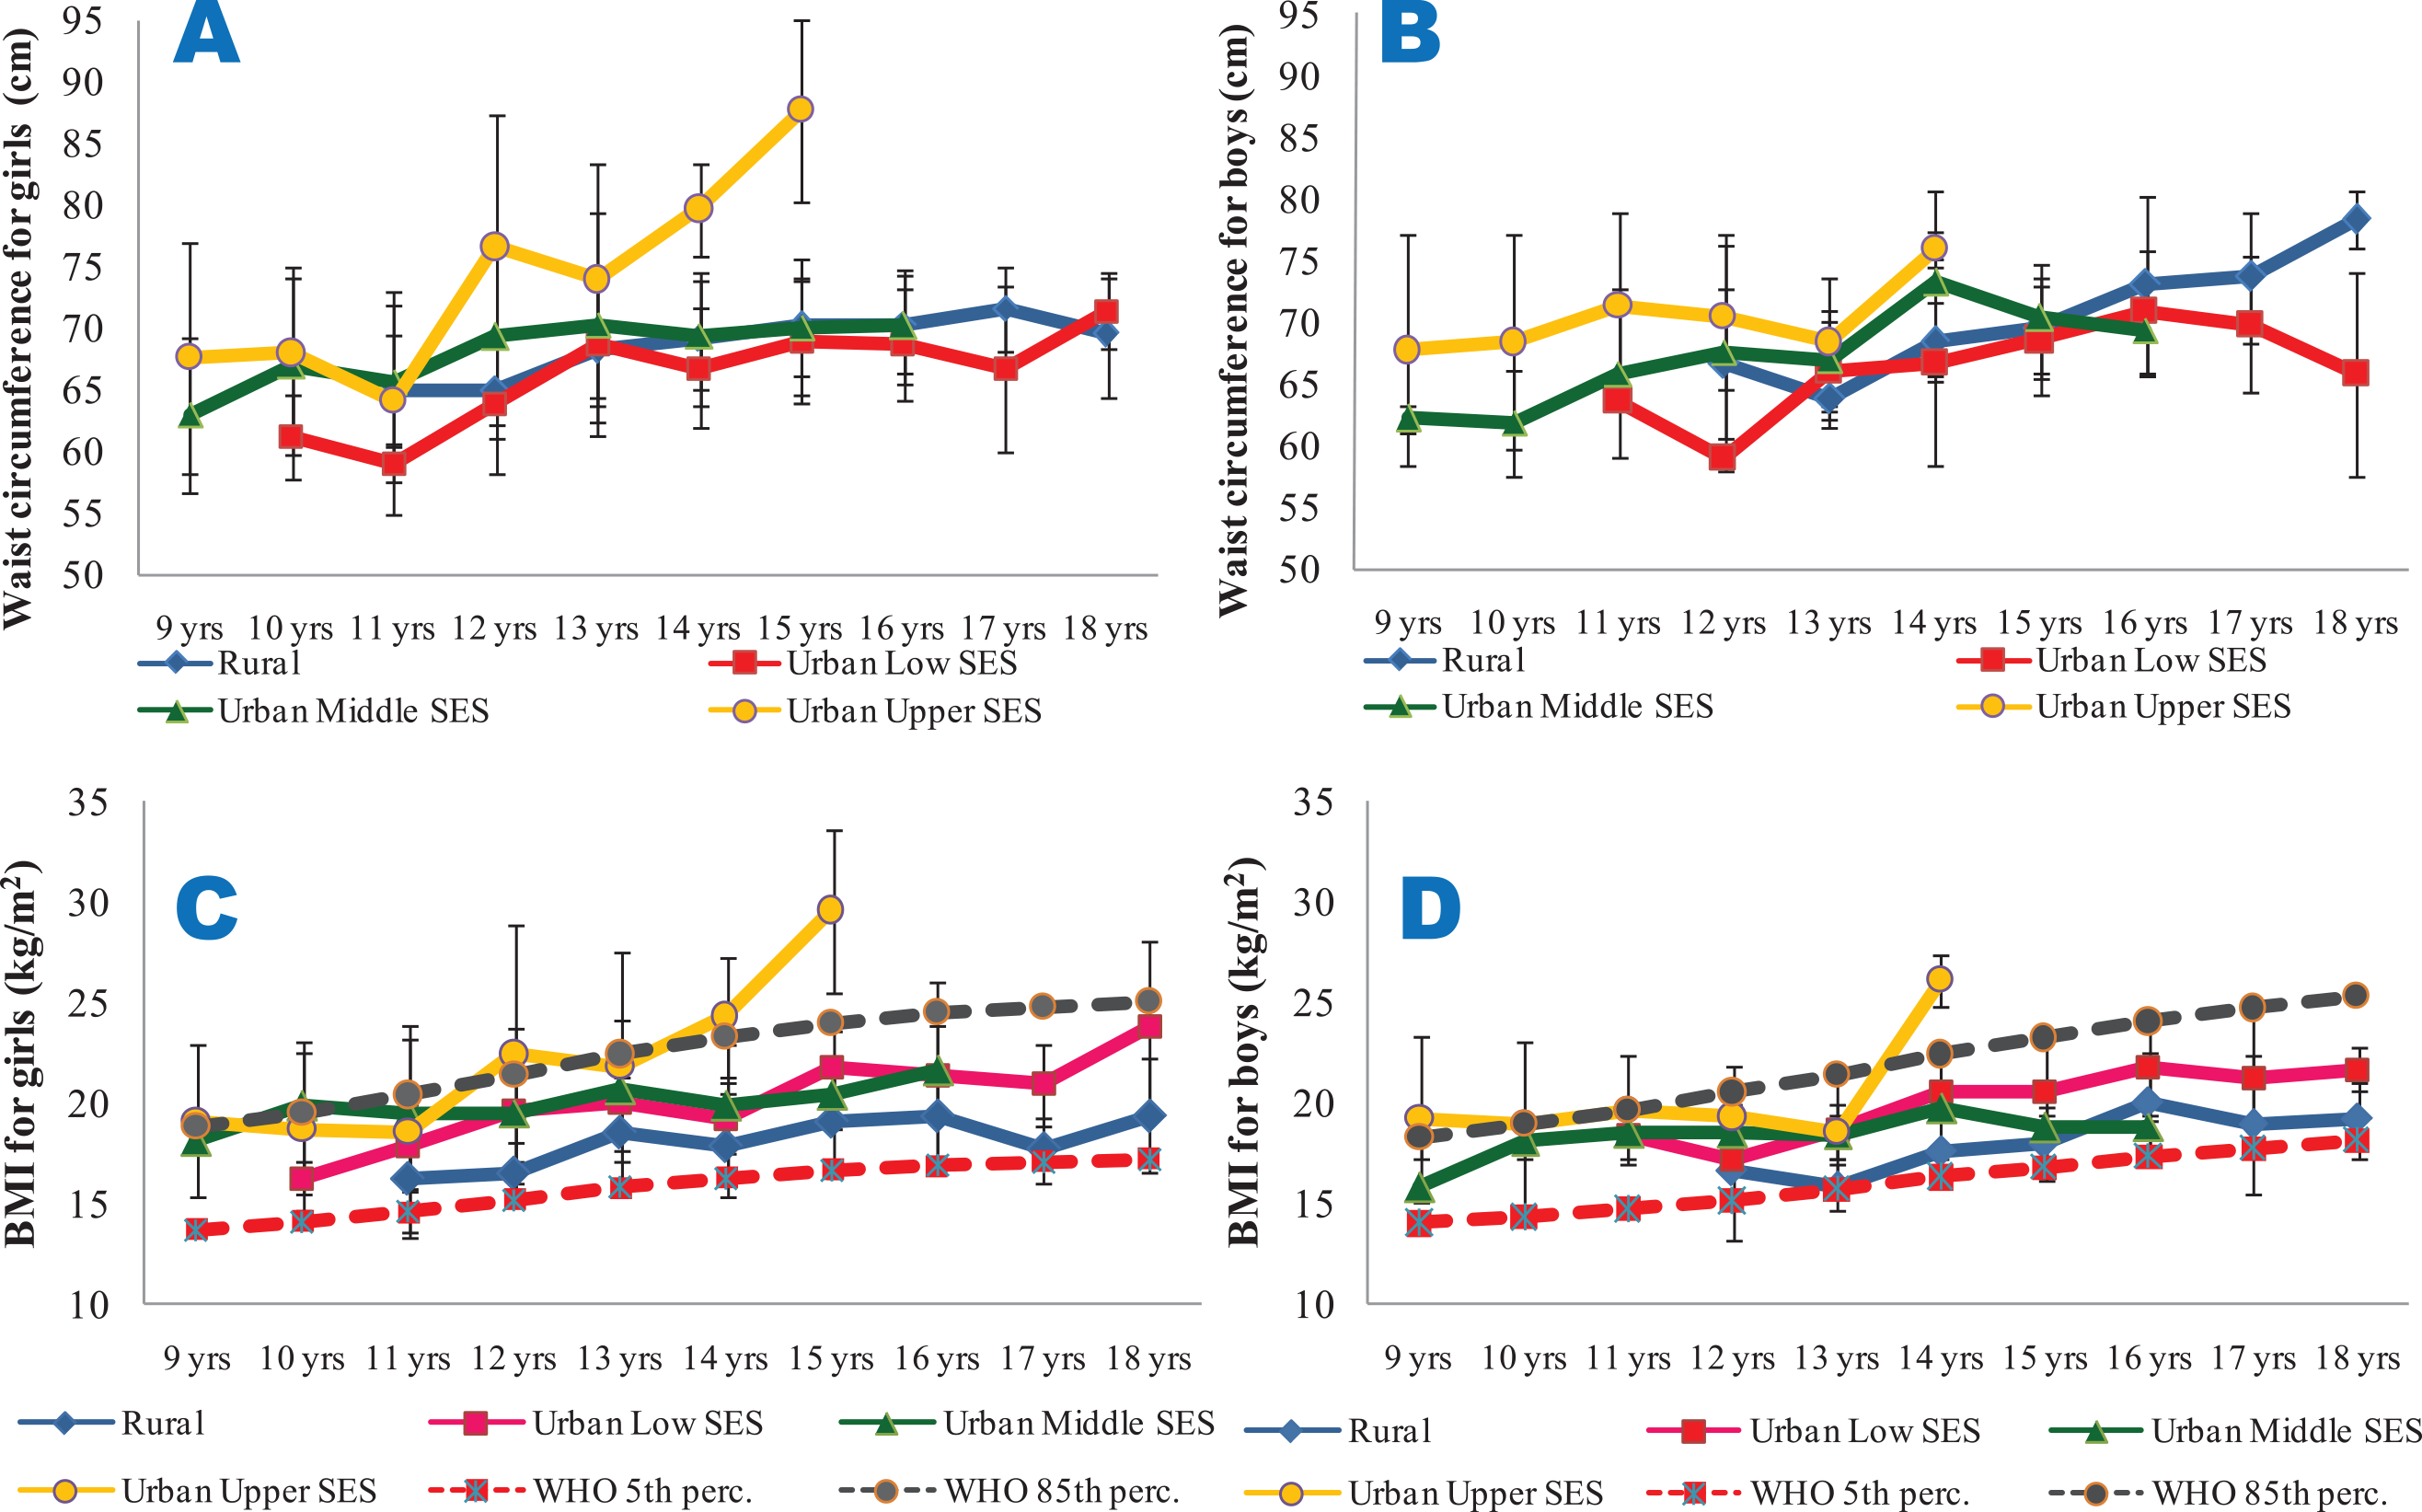
Figure 3
Mean waist circumference (3A and 3B) and BMI (3C and 3D) of the subjects.
3A and 3B are for waist circumferences for girls and boys, respectively. 3C (BMI for girls) and 3D (BMI for boys) are compared with the 5th and 85th percentiles of the WHO sex‑specific BMI reference dataset. All the data are disaggregated as per place of residence and socio‑economic status.
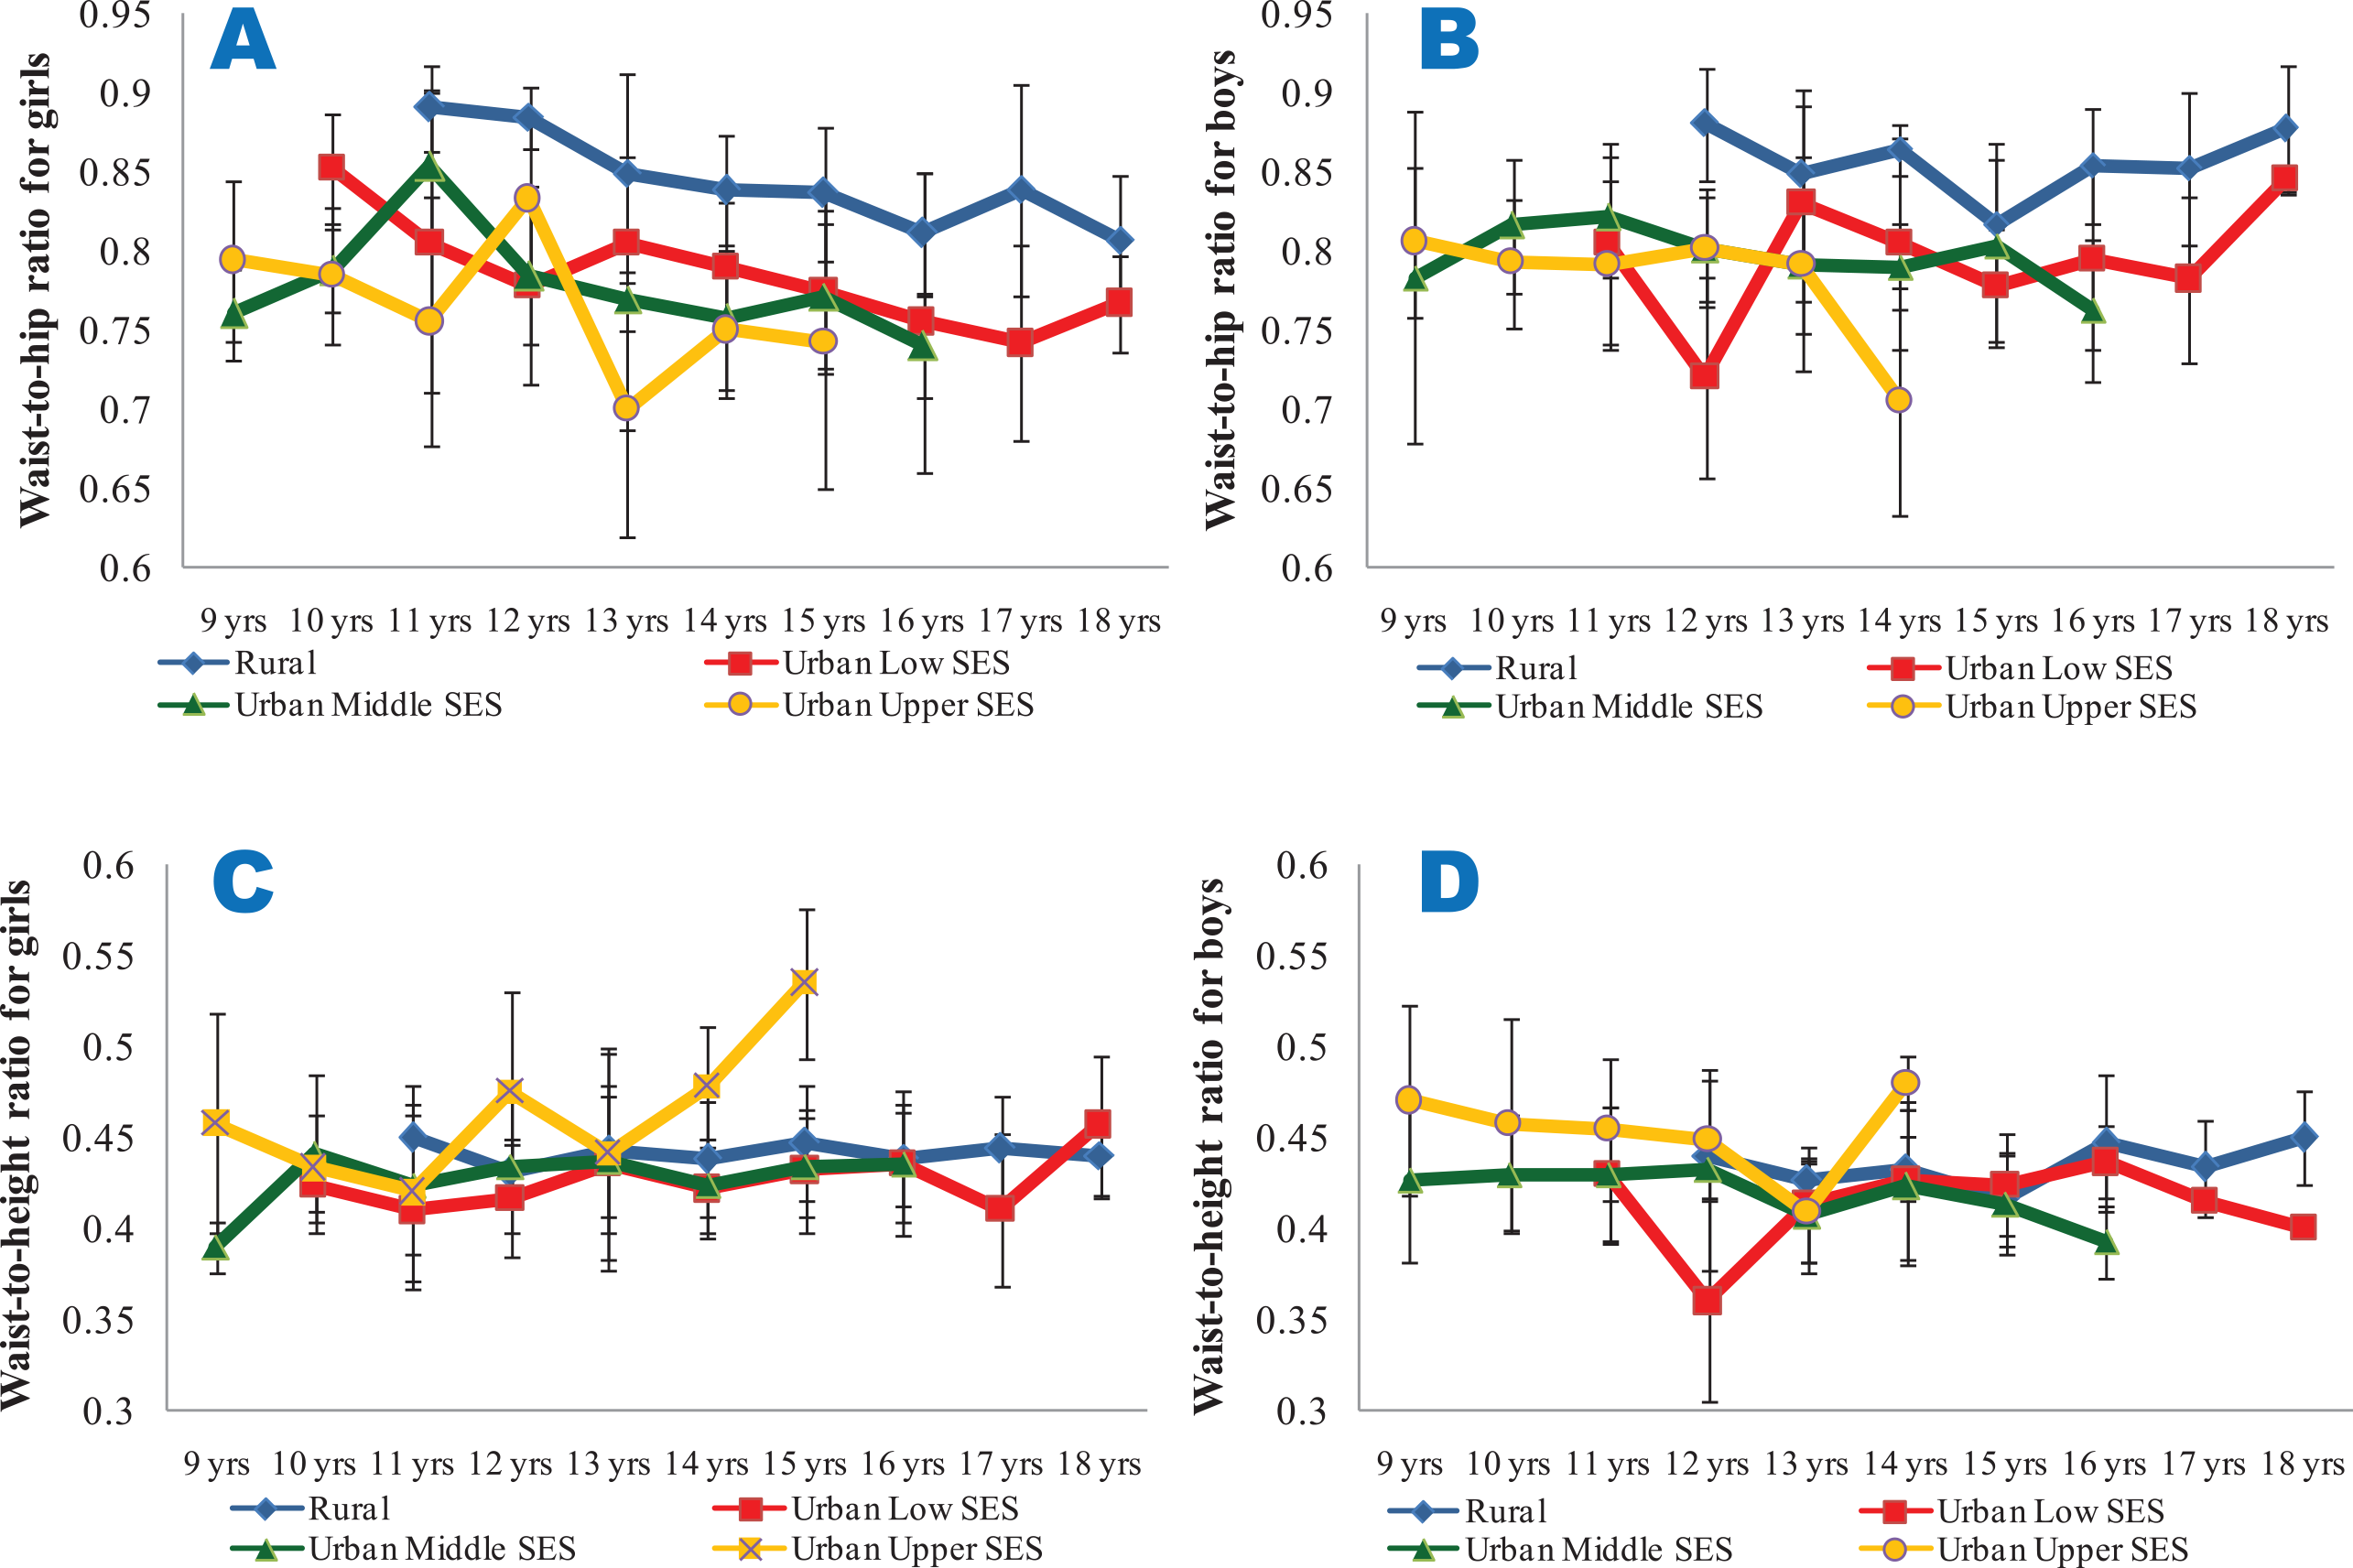
Figure 4
Mean waist‑to‑hip ratios (4A and 4B) and waist‑to‑height ratios (4C and 4D) of the subjects.
4A and 4C show data for girls, while 4B and 4D show data for boys. All the data are disaggregated as per place of residence and socio‑economic status.
Table 2
Prevalence of malnutrition in the general population (irrespective of SES).
| AGE (YEARS) | POPULATION DISTRIBUTION | PREVALENCE OF THINNESS | PREVALENCE OF STUNTING | PREVALENCE OF OBESITY/OVERWEIGHT | ||||||||
|---|---|---|---|---|---|---|---|---|---|---|---|---|
| FEMALE (N) | MALE (N) | ALL (N) | FEMALE (%) | MALE (%) | ALL (%) | FEMALE (%) | MALE (%) | ALL (%) | FEMALE (%) | MALE (%) | ALL (%) | |
| 9 | 10 | 7 | 17 | 0.0 | 0.0 | 0.0 | 0.0 | 0.0 | 0.0 | 30.0 | 42.9 | 35.3 |
| 10 | 32 | 18 | 50 | 0.0 | 0.0 | 0.0 | 0.0 | 0.0 | 0.0 | 31.3 | 27.8 | 30.0 |
| 11 | 49 | 40 | 89 | 4.1 | 5.0 | 2.2 | 0.0 | 0.0 | 0.0 | 24.5 | 27.5 | 25.8 |
| 12 | 69 | 36 | 105 | 7.2 | 22.2 | 7.6 | 1.4 | 0.0 | 1.0 | 14.5 | 19.4 | 16.2 |
| 13 | 98 | 45 | 143 | 7.1 | 15.6 | 4.9 | 4.1 | 2.2 | 3.5 | 13.3 | 11.1 | 12.6 |
| 14 | 88 | 36 | 124 | 11.4 | 30.6 | 8.9 | 2.3 | 8.3 | 4.0 | 6.8 | 16.7 | 9.7 |
| 15 | 58 | 31 | 89 | 5.2 | 12.9 | 4.5 | 0.0 | 6.5 | 2.2 | 10.3 | 9.7 | 10.1 |
| 16 | 66 | 33 | 99 | 6.1 | 15.2 | 5.1 | 3.0 | 21.2 | 9.1 | 4.5 | 6.1 | 5.1 |
| 17 | 25 | 19 | 44 | 16.0 | 36.8 | 15.9 | 0.0 | 10.5 | 4.5 | 0.0 | 10.5 | 4.5 |
| 18 | 10 | 4 | 14 | 30.0 | 75.0 | 21.4 | 10.0 | 0.0 | 7.1 | 10.0 | 0.0 | 7.1 |
| 19 | 6 | 1 | 7 | 0.0 | 0.0 | 0.0 | 0.0 | 0.0 | 0.0 | 0.0 | 0.0 | 0.0 |
| Total | 511 | 270 | 781 | 2.2 | 7.4 | 2.6 | 2.0 | 5.6 | 3.2 | 12.5 | 16.3 | 13.8 |
Table 3
Prevalence of stunting (low height for age) in the studied population, disaggregated by SES.
| AGE (YEARS) | RURAL (N = 201) | URBAN LOW (N = 182) | URBAN MIDDLE (N = 306) | URBAN UPPER (N = 92) | ||||||||||||
|---|---|---|---|---|---|---|---|---|---|---|---|---|---|---|---|---|
| FEMALE | % | MALE | % | FEMALE | % | MALE | % | FEMALE | % | MALE | % | FEMALE | % | MALE | % | |
| 9 | – | – | – | – | – | – | – | – | – | – | – | – | 10 | 0.0 | 7 | 0.0 |
| 10 | – | – | – | – | – | – | – | – | 18 | 0.0 | 10 | 0.0 | 14 | 0.0 | 8 | 0.0 |
| 11 | – | – | – | – | – | – | – | – | 45 | 0.0 | 33 | 0.0 | 4 | 0.0 | 7 | 0.0 |
| 12 | 13 | 0.0 | 3 | 0.0 | 12 | 8.3 | 1 | 0.0 | 40 | 0.0 | 23 | 0.0 | 4 | 0.0 | 9 | 0.0 |
| 13 | 27 | 11.1 | 5 | 0.0 | 25 | 4.0 | 3 | 0.0 | 37 | 0.0 | 29 | 3.4 | 9 | 0.0 | 8 | 0.0 |
| 14 | 35 | 2.9 | 8 | 12.5 | 23 | 4.3 | 9 | 22.2 | 25 | 0.0 | 17 | 0.0 | 5 | 0.0 | 2 | 0.0 |
| 15 | 26 | 0.0 | 6 | 0.0 | 20 | 0.0 | 15 | 13.3 | 8 | 0.0 | 9 | 0.0 | 4 | 0.0 | 1 | 0.0 |
| 16 | 36 | 2.8 | 10 | 10.0 | 25 | 4.0 | 16 | 37.5 | 5 | 0.0 | 7 | 0.0 | – | – | – | – |
| 17 | 10 | 0.0 | 6 | 16.7 | 15 | 0.0 | 13 | 7.7 | – | – | – | – | – | – | – | – |
| 18 | 7 | 0.0 | 2 | 0.0 | 3 | 33.3 | 2 | 0.0 | – | – | – | – | – | – | – | – |
| 19 | 6 | 0.0 | 1 | 0.0 | – | – | – | – | – | – | – | – | – | – | – | – |
| Total | 160 | 3.1 | 41 | 7.3 | 123 | 4.1 | 59 | 18.6 | 178 | 0.0 | 128 | 0.8 | 50 | 0.0 | 42 | 0.0 |
| All (female + male) | 201 (4.0%) | 182 (8.8%) | 306 (0.3%) | 92 (0.0%) | ||||||||||||
[i] N/B: Percentages are calculated as per place of residence.
Table 4
Prevalence of thinness (low BMI for age) in the studied population, disaggregated by SES.
| AGE (YEARS) | RURAL (N = 201) | URBAN LOW (N = 182) | URBAN MIDDLE (N = 306) | URBAN UPPER (N = 92) | ||||||||||||
|---|---|---|---|---|---|---|---|---|---|---|---|---|---|---|---|---|
| FEMALE | % | MALE | % | FEMALE | % | MALE | % | FEMALE | % | MALE | % | FEMALE | % | MALE | % | |
| 9 | – | – | – | – | – | – | – | – | – | – | – | – | 10 | 0.0 | 7 | 0.0 |
| 10 | – | – | – | – | – | – | – | – | 18 | 0.0 | 10 | 0.0 | 14 | 0.0 | 8 | 0.0 |
| 11 | – | – | – | – | – | – | – | – | 45 | 4.4 | 33 | 0.0 | 4 | 0.0 | 7 | 0.0 |
| 12 | 13 | 23.1 | 3 | 0.0 | 12 | 8.3 | 1 | 0.0 | 40 | 2.5 | 23 | 13.0 | 4 | 0.0 | 9 | 0.0 |
| 13 | 27 | 18.5 | 5 | 0.0 | 25 | 4.0 | 3 | 0.0 | 37 | 2.7 | 29 | 0.0 | 9 | 0.0 | 8 | 0.0 |
| 14 | 35 | 20.0 | 8 | 12.5 | 23 | 4.3 | 9 | 0.0 | 25 | 8.0 | 17 | 0.0 | 5 | 0.0 | 2 | 0.0 |
| 15 | 26 | 11.5 | 6 | 0.0 | 20 | 0.0 | 15 | 6.7 | 8 | 0.0 | 9 | 0.0 | 4 | 0.0 | 1 | 0.0 |
| 16 | 36 | 8.3 | 10 | 10.0 | 25 | 4.0 | 16 | 0.0 | 5 | 0.0 | 7 | 0.0 | – | – | – | – |
| 17 | 10 | 40.0 | 6 | 16.7 | 15 | 0.0 | 13 | 15.4 | – | – | – | – | – | – | – | – |
| 18 | 7 | 28.6 | 2 | 0.0 | 3 | 33.3 | 2 | 0.0 | – | – | – | – | – | – | – | – |
| 19 | 6 | 0.0 | 1 | 0.0 | – | – | – | – | – | – | – | – | – | – | – | – |
| Total | 160 | 16.9 | 41 | 7.3 | 123 | 4.1 | 59 | 5.1 | 178 | 3.4 | 128 | 2.3 | 50 | 0.0 | 42 | 0.0 |
| All (female + male) | 201 (14.9%) | 182 (4.4%) | 306 (2.9%) | 92 (0.0%) | ||||||||||||
[i] N/B: Percentages are calculated as per place of residence.
Table 5
Prevalence of overweight/obesity (high BMI for age) in the studied population, disaggregated by SES.
| AGE (YEARS) | RURAL (N = 201) | URBAN LOW (N = 182) | URBAN MIDDLE (N = 306) | URBAN UPPER (N = 92) | ||||||||||||
|---|---|---|---|---|---|---|---|---|---|---|---|---|---|---|---|---|
| FEMALE | % | MALE | % | FEMALE | % | MALE | % | FEMALE | % | MALE | % | FEMALE | % | MALE | % | |
| 9 | – | – | – | – | – | – | – | – | – | – | – | – | 10 | 30.0 | 7 | 42.9 |
| 10 | – | – | – | – | – | – | – | – | 18 | 38.9 | 10 | 20.0 | 14 | 21.4 | 8 | 37.5 |
| 11 | – | – | – | – | – | – | – | – | 45 | 24.4 | 33 | 24.2 | 4 | 25.0 | 7 | 42.9 |
| 12 | 13 | 0.0 | 3 | 0.0 | 12 | 25.0 | 1 | 0.0 | 40 | 15.0 | 23 | 13.0 | 4 | 25.0 | 9 | 44.4 |
| 13 | 27 | 7.4 | 5 | 0.0 | 25 | 8.0 | 3 | 0.0 | 37 | 18.9 | 29 | 17.2 | 9 | 22.2 | 8 | 0.0 |
| 14 | 35 | 2.9 | 8 | 0.0 | 23 | 0.0 | 9 | 11.1 | 25 | 8.0 | 17 | 17.6 | 5 | 60.0 | 2 | 100.0 |
| 15 | 26 | 3.8 | 6 | 0.0 | 20 | 5.0 | 15 | 13.3 | 8 | 0.0 | 9 | 0.0 | 4 | 100.0 | 1 | 100.0 |
| 16 | 36 | 2.8 | 10 | 0.0 | 25 | 4.0 | 16 | 12.5 | 5 | 20.0 | 7 | 0.0 | – | – | – | – |
| 17 | 10 | 0.0 | 6 | 0.0 | 15 | 0.0 | 13 | 15.4 | – | – | – | – | – | – | – | – |
| 18 | 7 | 0.0 | 2 | 0.0 | 3 | 33.3 | 2 | 0.0 | – | – | – | – | – | – | – | – |
| 19 | 6 | 0.0 | 1 | 0.0 | – | – | – | – | – | – | – | – | – | – | – | – |
| Total | 160 | 3.1 | 41 | 0.0 | 123 | 6.5 | 59 | 11.9 | 178 | 19.1 | 128 | 16.4 | 50 | 34.0 | 42 | 38.1 |
| All (female + male) | 201 (2.5%) | 182 (8.2%) | 306 (18.0%) | 92 (35.9%) | ||||||||||||
[i] N/B: Percentages are calculated as per place of residence.