
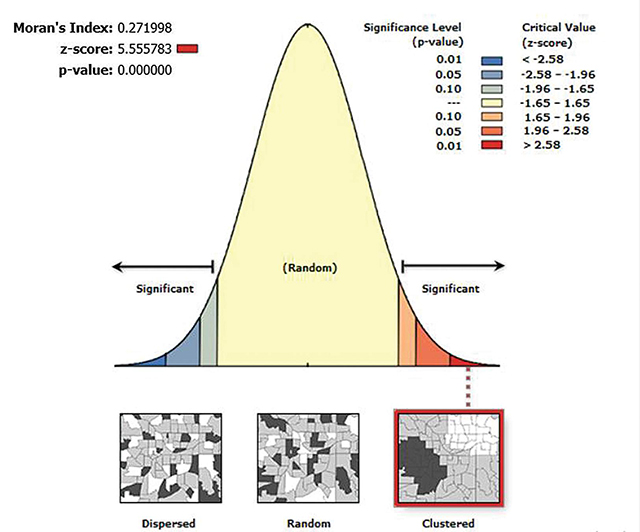
Figure 1
Spatial autocorrelation result of inadequate meal frequency among young children aged 6–23 months in Ethiopia.
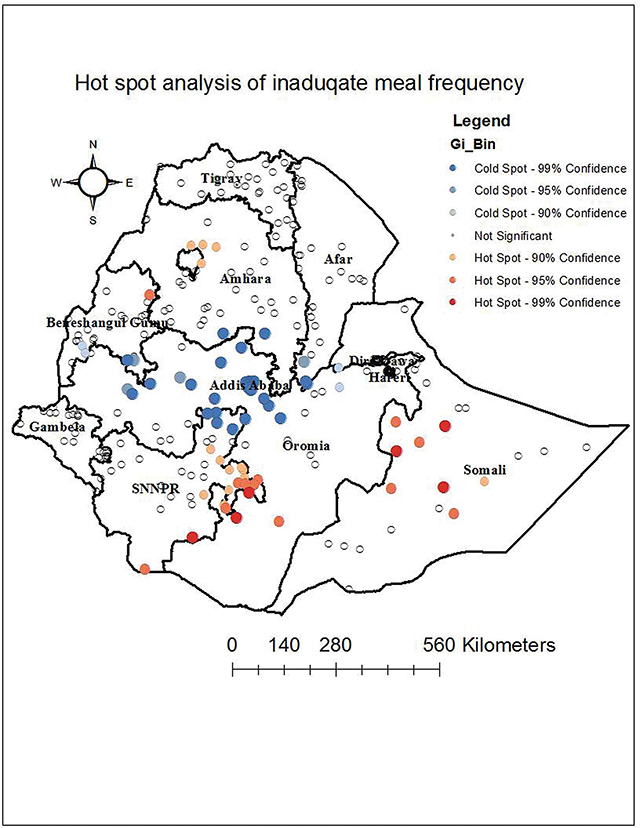
Figure 2
Hot-spot analysis of inadequate meal frequency among children aged 6–23 months in Ethiopia.
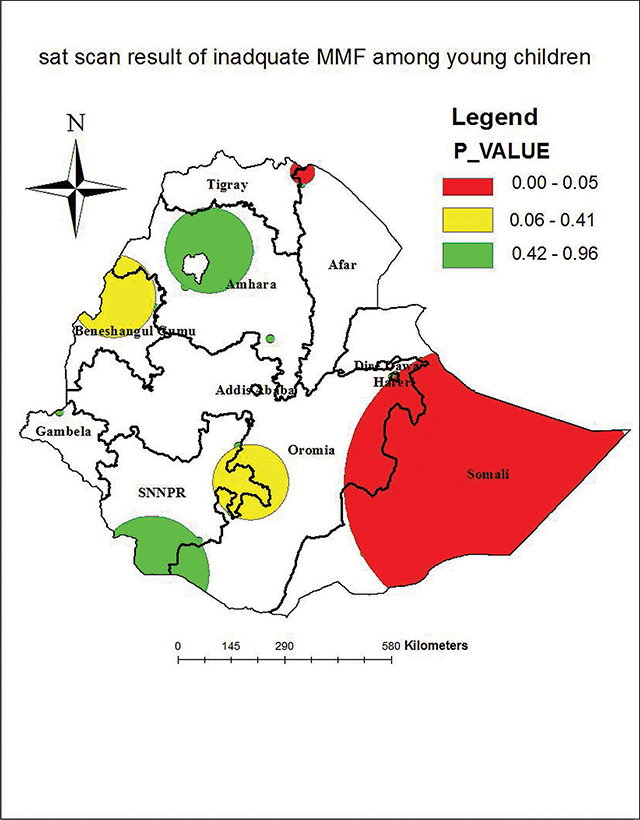
Figure 3
Sat Scan analysis maps of inadequate meal frequency among children aged 6–23 months in Ethiopia.
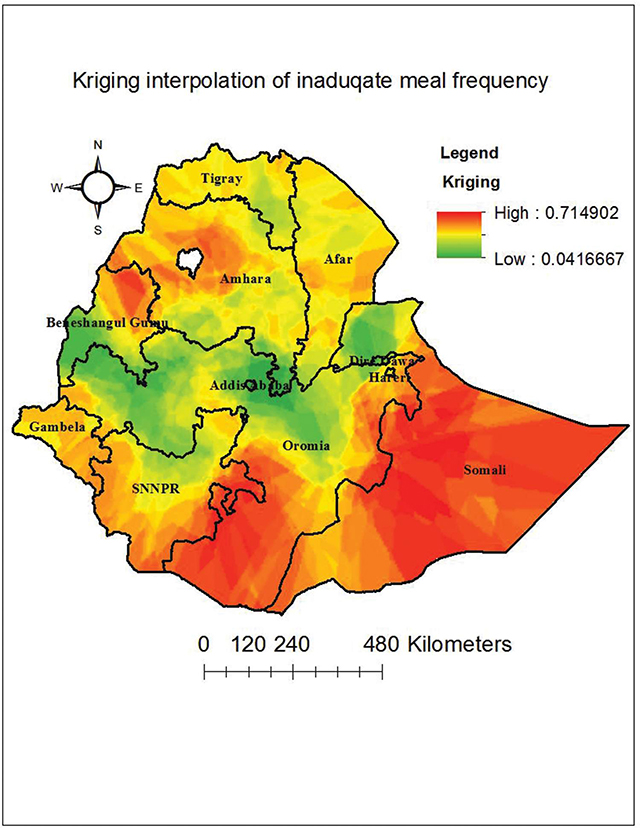
Figure 4
Kriging interpolation map of inadequate meal frequency among children aged 6–23 months in Ethiopia.
Table 1
Significant Spatial Clusters of Inadequate Meal Frequency among Children in Ethiopian Mini Demography Health Survey, 2019 (n = 1,610).
| CLUSTER | ENUMERATION AREAS | COORDINATE (RADIUS) | POPULATION | CASES | RR | LLR | P-VALUE |
|---|---|---|---|---|---|---|---|
| 1 | 135, 123, 140, 137, 138, 124, 131, 145, 132, 122, 134, 136, 142, 133, 139, 129, 121, 130, 107, 250, 141, 128, 248, 249, 255, 254, 247 | (6.639662 N, 44.465855 E) / 390.28 km | 170 | 115 | 1.51 | 15.9 | 0.0001 |
| 2 | 39, 35 | (14.300432 N, 39.911831 E) / 32.54 km | 19 | 18 | 2.03 | 10.3 | 0.087 |
| 3 | 181, 186, 182, 185, 187, 183, 117, 113, 184, 115, 178, 116, 172, 188, 203 | (6.721681 N, 38.648685 E) / 102.43 km | 90 | 61 | 1.48 | 8.12 | 0.075 |
| 4 | 159, 160, 158, 161, 162 | (11.267438 N, 35.292873 E) / 112.65 km | 31 | 24 | 1.66 | 6.00 | 0.4 |
| 5 | 193, 202 | (4.495034 N, 36.230625 E) / 155.19 km | 17 | 14 | 1.75 | 4.5 | 0.82 |
| 6 | 67 | (10.236394 N, 39.142029 E) / 0 km | 6 | 6 | 2.2 | 4.5 | 0.89 |
| 7 | 218 | (8.436117 N, 33.991501 E) / 0 km | 10 | 9 | 1.91 | 4.15 | 0.93 |
| 8 | 82, 84, 83, 57, 56, 59, 74, 54, 81, 58, 78, 75 | (12.387114 N, 37.630096 E) / 116.41 km | 73 | 46 | 1.35 | 3.8 | 0.96 |
Table 2
Random effect and model fitness for the assessment of inadequate minimum meal frequency among young children in Ethiopia (n = 1,610).
| PARAMETER | NULL MODEL | MODEL I | MODEL II | MODEL III |
|---|---|---|---|---|
| Variance | 0.69 | 0.43 | 0.34 | 0.43 |
| ICC | 17.29% | 11.55% | 9.26% | 9.84% |
| MOR | 2.20 | 1.87 | 1.73 | 1.86 |
| PCV | Reference | 37.56% | 51.16% | 37.8% |
| Log likelihood | –1086.35 | –1006.89 | –1039.39 | 1000.41 |
| Deviance | 2,172.69 | 2013.77 | 2.078.78 | 2000.82 |
Table 3
Socio-demographic characteristics of mother–infant pairs for inadequate meal frequency among young infants aged 6–23 months in Ethiopia, EMDHS 2019 (n = 1,610).
| VARIABLE | RESPONSE | FREQUENCY | PERCENT (%) |
|---|---|---|---|
| Child age | 6–8 9–11 12–23 | 285 257 1,066 | 17.72 15.98 66.29 |
| Child sex | Male Female | 807 767 | 51.27 48.73 |
| Birth order | 1 2–3 ≥4 | 512 623 475 | 31.80 38.69 29.51 |
| Mother's education | No education Primary Secondary Higher | 771 551 144 108 | 48.98 35.01 9.15 6.86 |
| Maternal age | 15–19 20–34 ≥35 | 118 1,201 255 | 7.5 76.3 16.2 |
| ANC visit | No Once Twice Three times Four & above | 400 57 131 306 641 | 26.06 3.71 8.53 19.93 41.76 |
| PNC visit | No Yes | 1,331 201 | 86.88 13.12 |
| Marital status | Unmarried Married | 106 1502 | 6.59 93.41 |
| Dietary diversity | Poor Good | 1,191 318 | 78.93 21.07 |
| Wealth index | Poorest Poor Middle Rich Richest | 489 262 236 218 403 | 30.41 16.29 14.68 13.56 25.06 |
| Place of delivery | Home Health institution | 703 907 | 43.66 56.34 |
| No. of household members | ≤5 ≥6 | 789 785 | 50.13 49.87 |
| Household head sex | Male Female | 1,229 345 | 78.08 21.92 |
| No. of children under age 5 | ≤2 ≥3 | 1,358 216 | 86.28 13.72 |
| Counseling on breastfeeding | No Yes | 917 630 | 59.28 40.72 |
| Community-level factors | |||
| Residence | Urban Rural | 25.6 1,171 | 25.6 74.4 |
| Community poverty level | Low High | 737 837 | 46.82 53.18 |
| Community illiteracy level | Low High | 854 720 | 54.26 45.74 |
| Region | Tigray Afar Amhara Oromia Somali Benishangul SNNPR Gambela Harari Addis Ababa Dire Dawa | 128 166 162 189 143 145 180 122 122 92 125 | 21.09 44.58 23.46 24.87 50.35 24.14 40.00 28.69 32.79 15.22 21.60 |
Table 4
Multivariable multilevel logistic regression analysis result of both individual- and community-level factors associated with minimum meal frequency among young infants in Ethiopia.
| INDIVIDUAL- AND COMMUNITY- LEVEL FACTORS | MODEL I AOR (95% CL) | MODEL II AOR (95% CL) | MODEL III AOR (95% CL) | |
|---|---|---|---|---|
| Child age | 6–8 9–11 12–23 | 1.5 (1.09–2.04)* 1.42 (1.02–1.98)* 1 | 1.47 (1.06–2.02)* 1.48 (1.05–2.08)* 1 | |
| Child sex | Male Female | 1 0.88 (0.7–1.01) | 1 0.89 (0.71–1.02) | |
| Birth order | 1 2–3 ≥4 | 0.9 (0.63–1.27) 0.89 (0.67–1.18) 1 | 0.88(0.61–1.26) 0.85(0.64–1.15) 1 | |
| Mother's education | No education Primary Secondary Higher | 1 0.75 (0.56–1.00) 0.7 (0.43–1.14) 0.54 (0.29–0.99)* | 1 1.65(0.88–2.5) 1.22(0.67–2.2) 1.24(0.63–2.4) | |
| Maternal age | 15–19 20–34 ≥35 | 0.91 (0.85–1.32) 1 0.92 (0.87–1.34) | 0.90 (0.83–1.31) 1 0.93 (0.89–1.37) | |
| ANC visit | No Once Twice Three times Four & above | 1.89 (1.32–2.7)* 2.13 (1.12–4.08)* 1.09 (0.69–1.7) 1.47 (1.00–2.04) 1 | 1.56(1.07–2.29)* 2.32(1.18–4.54)* 0.96(0.59–1.55) 1.34(0.96–1.89) 1 | |
| PNC visit | No Yes | 1 0.92 (0.63–1.34) | 1 0.95(0.64–1.41) | |
| Marital status | Unmarried Married | 1 0.56 (0.32–1.00) | 1 0.5(0.28–0.92)* | |
| Dietary diversity | Poor Good | 1 0.84 (0.57–1.23) | 1 0.99 (0.66–1.49) | |
| Wealth index | Poorest Poor Middle Rich Richest | 1 0.7 (0.48–1.03) 0.66 (0.44–0.99)* 0.52 (0.34–0.80)* 0.52 (0.34–0.79)* | 1 0.76 (0.44–1.31) 0.65 (0.38–1.03) 0.51 (0.32–0.78)* 0.50 (0.30–0.75)* | |
| Place of delivery | Home Health institution | 1 1.06 (0.78–1.44) | 1 0.75 (0.55–1.01) | |
| Number of household members | ≤5 ≥5 | 1 0.95 (0.90–1.01) | 1 0.96 (0.92–1.21) | |
| Household head sex | Male Female | 1 0.89 (0.85–1.88) | 1 0.88 (0.85–2.00) | |
| Number of children under age 5 | ≤2 ≥3 | 1 0.86 (0.81–1.84) | 1 0.85 (0.81–1.83) | |
| Counseling on breastfeeding | No Yes | 1 0.79 (0.59–1.05) | 1 0.75 (0.55–1.01) | |
| Community-level factors | ||||
| Region | Tigray Afar Amhara Oromia Somali Benshagul SNNPR Gambela Harari Dire Dewa Addis Ababa | 1.41 (0.7–2.760) 1.55 (0.81–2.98) 1.31 (0.68–2.54) 1.32 (0.69–2.52) 2.00 (1.01–3.97) 1.57 (0.83–3.07) 1.79 (0.93–3.43) 1.19 (0.60–2.36) 1.40 (0.73–2.70) 1.15 (0.59–2.26) 1 | 1.45 (0.68–3.11) 1.65 (0.49–2.24) 1.28 (0.60–2.72) 1.23 (0.58–2.62) 1.38 (0.61–3.08) 1.28 (0.58–2.82) 1.62 (0.75–3.47) 1.17 (0.52–2.62) 1.10 (0.52–2.33) 0.8 (0.35–1.80) 1 | |
| Residence | Urban Rural | 0.9 (0.66–1.26) 1 | 1.07 (0.69–1.68) 1 | |
| Community poverty level | Low High | 1 1.18 (0.9–1.54) | 1 0.83 (0.57–1.22) | |
| Community illiteracy level | Low High | 1 5.5 (4.33–6.96)* | 1 5.68 (4.37–7.39)* | |
| ANC | Antenatal care |
| CI | confidence interval |
| CSA | Central Statistical Agency |
| EA | enumeration area |
| EDHS | Ethiopian Demographic Health Survey |
| GDP | Gross Domestic Product |
| ICC | intra-class correlation coefficient |
| IYCF | infant and young children feeding |
| KR | kids record |
| LR | logistic regression |
| MOR | median odds ratio |
| MMF | minimum meal frequency |
| PNC | prenatal care |
| PHC | primary healthcare |
| PCV | proportional change in variance |