
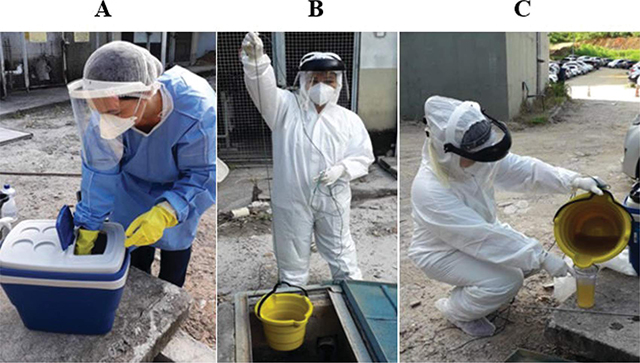
Figure 1
Execution of the sample collection procedures.
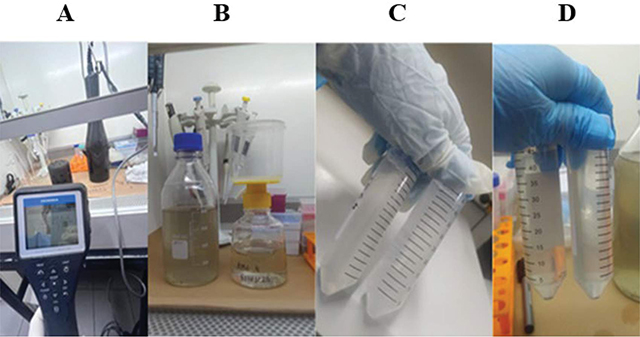
Figure 2
pH determination and concentration of the sewage sample.
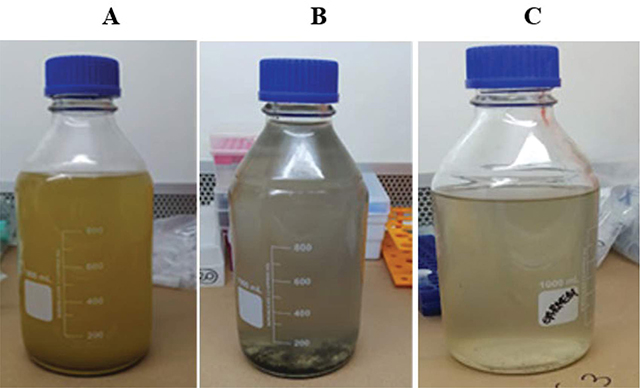
Figure 3
Appearance of the studied sewage samples.
Table 1
Sewage samples collected between February and April 2023 from Cassiano Antonio Moraes University Hospital (HUCAM) and Health Sciences Center (CCS), Brazil.
| SAMPLE | COLLECTION DATE | COLLECTION SITE | CYCLE THRESHOLD (CT) OF GENES | ||
|---|---|---|---|---|---|
| E | RDRP | N | |||
| S1 | February 6 | HUCAM | >40 | >40 | >40 |
| S2* | February 7 | HUCAM | 32.46 | 37.03 | 32.83 |
| S3 | March 10 | CCS | >40 | >40 | >40 |
| S4 | March 27 | CCS | >40 | >40 | >40 |
| S5 | March 27 | CCS | >40 | >40 | >40 |
| S6 | March 28 | CCS | >40 | >40 | >40 |
| S7 | March 28 | CCS | >40 | >40 | >40 |
| S8 | March 29 | CCS | >40 | >40 | >40 |
| S9 | March 29 | CCS | >40 | >40 | >40 |
| S10 | April 4 | CCS | >40 | >40 | >40 |
| S11 | April 4 | CCS | >40 | >40 | >40 |
| S12 | April 6 | CCS | >40 | >40 | >40 |
| S13 | April 6 | CCS | >40 | >40 | >40 |
| S14 | April 11 | CCS | >40 | >40 | >40 |
| S15* | April 12 | CCS | 32.55 | 35.42 | 32.05 |
[i] * Positive samples.