
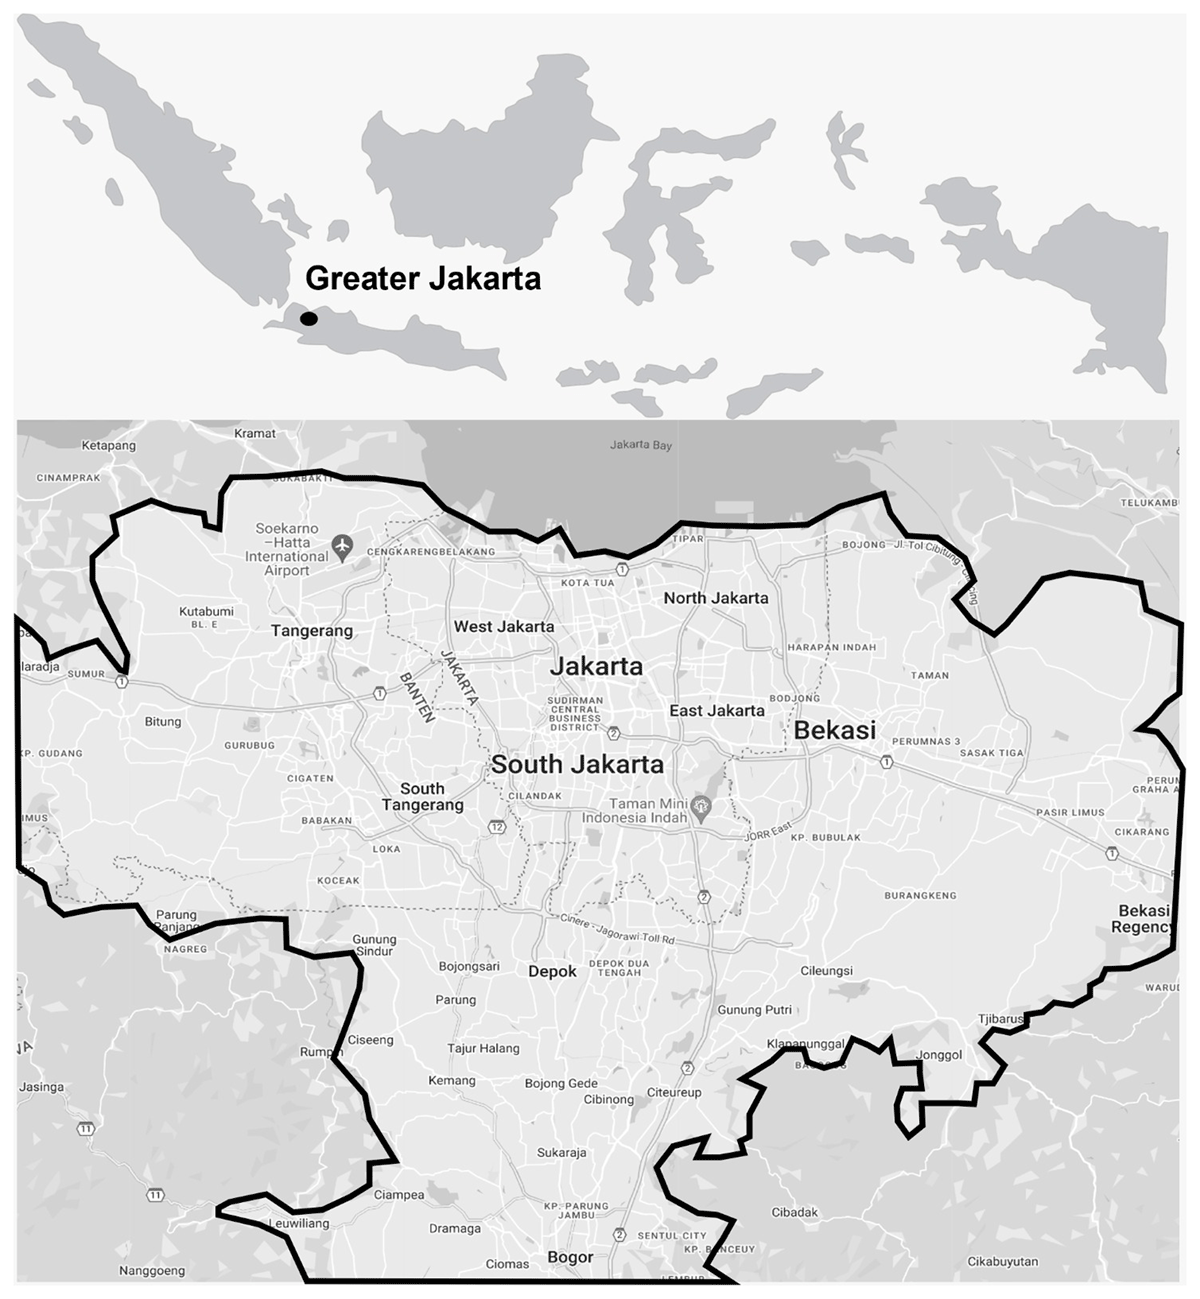
Figure 1
Modified maps indicating the Greater Jakarta (original source from Google Maps).
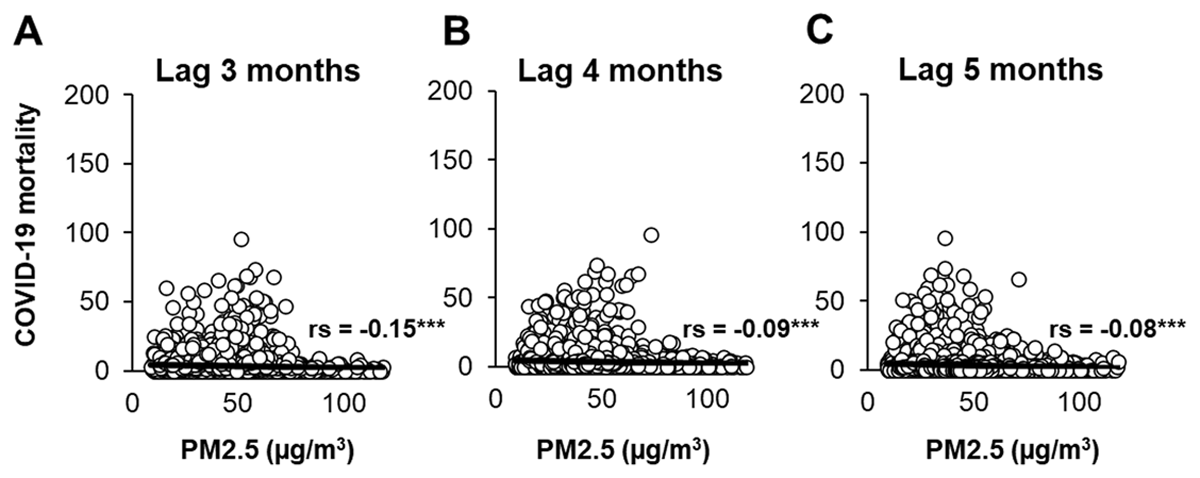
Figure 2
Short-term exposure of PM2.5 and COVID-19 deaths in different time lags.
The correlation between PM2.5 concentration and number of new deaths during COVID-19 in lag 3 months (A), lag 4 months (B), and lag 5 months (C), as presented. Spearman’s rank correlation coefficient (rs) is presented.
Table 1
Correlation between short-term exposure of PM2.5 and COVID-19 deaths in each city or regency in Greater Jakarta.
| City/Regency | Spearman correlationa | |
|---|---|---|
| rs | P-value | |
| Bekasi City | 0.031 | 0.641 |
| Bekasi Regency | –0.089 | 0.197 |
| Tangerang City | 0.203 | 0.003 |
| South Tangerang City | 0.401 | 0.0001 |
| Bogor City | –0.052 | 0.439 |
| Bogor Regency | 0.032 | 0.637 |
| Depok City | –0.242 | 0.0001 |
| West Jakarta | –0.453 | 0.0001 |
| East Jakarta | –0.225 | 0.0001 |
| North Jakarta | –0.239 | 0.0001 |
| Central Jakarta | –0.174 | 0.0001 |
| South Jakarta | –0.163 | 0.0001 |
[i] a Spearman correlation test on 5 months lag.
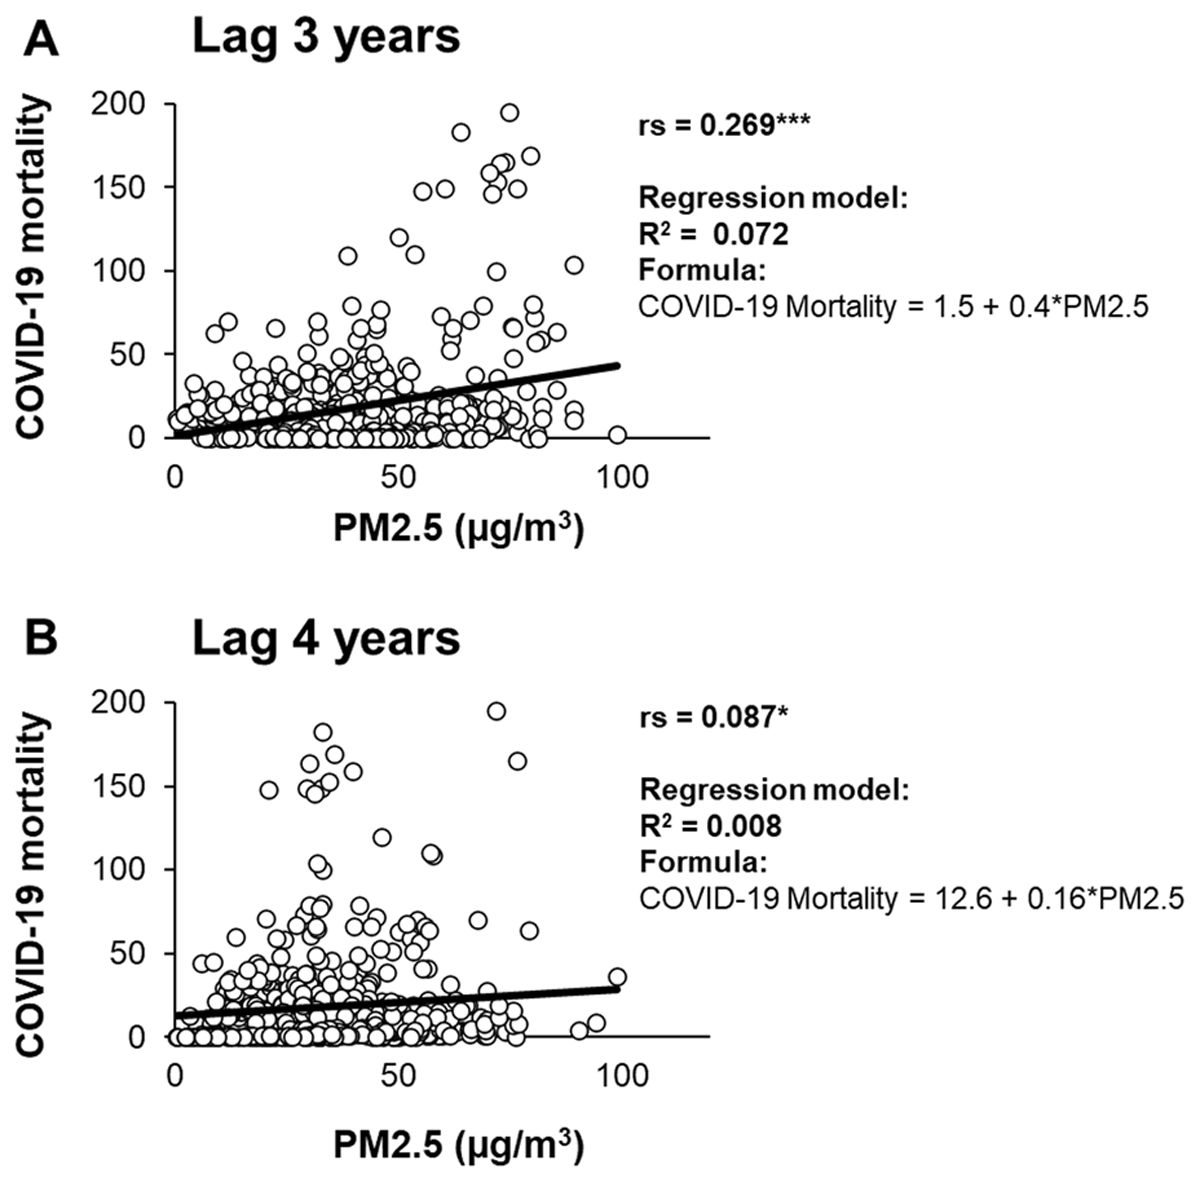
Figure 3
Long-term exposure of PM2.5 and COVID-19 deaths.
The correlation between PM2.5 concentration and the number of new deaths during COVID-19 is examined with lags of 3 years (A) and 4 years (B). Spearman’s rank correlation coefficient (rs) and the coefficient of determination for regression (R2) are presented. Significantly different values denoted as follows: *, p < 0.05; ***, p < 0.001.