
Table 1
Characteristics of the population stratified for subpopulation and return rate.
| OVERALL (N = 149) | SUB-POPULATION | RETURN FOR TEST RESULTS | |||||
|---|---|---|---|---|---|---|---|
| AGRICULTURAL MIGRANT WORKERS (N = 64) | HOMELESS PEOPLE (N = 85) | P-VALUE FOR SETTING | NOT RETURNED (N = 74) | RETURNED (N = 75) | P-VALUE FOR RETURNING | ||
| Age, median [Q1, Q3] | 35 [27, 45] | 34 [26, 42] | 35 [29, 48] | 0.328 | 33.0 [26.3, 41.8] | 36.0 [28.5, 50.0] | 0.171 |
| Gender | |||||||
| F | 29 (19.5%) | 8 (12.5%) | 21 (24.7%) | 0.0982 | 11 (14.9%) | 18 (24.0%) | 0.23 |
| M | 120 (80.5%) | 56 (87.5%) | 64 (75.3%) | 63 (85.1%) | 57 (76.0%) | ||
| Sub-populations | |||||||
| Agricultural migrant workers | 64 (43.0%) | – | – | – | 38 (51.4%) | 26 (34.7%) | 0.0585 |
| Homeless people | 85 (57.0%) | – | – | 36 (48.6%) | 49 (65.3%) | ||
| Marital Status | |||||||
| Divorced | 11 (7.4%) | 3 (4.7%) | 8 (9.4%) | 0.442 | 3 (4.1%) | 8 (10.7%) | 0.478 |
| In an open relationship | 4 (2.7%) | 2 (3.1%) | 2 (2.4%) | 2 (2.7%) | 2 (2.7%) | ||
| Single | 84 (56.4%) | 34 (53.1%) | 50 (58.8%) | 44 (59.5%) | 40 (53.3%) | ||
| Married | 49 (32.9%) | 25 (39.1%) | 24 (28.2%) | 25 (33.8%) | 24 (32.0%) | ||
| Missing | 1 (0.7%) | 0 (0%) | 1 (1.2%) | 0 (0%) | 1 (1.3%) | ||
| Region of origin | |||||||
| Eastern Europe | 10 (6.7%) | 6 (9.4%) | 4 (4.7%) | <0.001 | 4 (5.4%) | 6 (8.0%) | 0.25 |
| Middle East | 10 (6.7%) | 1 (1.6%) | 9 (10.6%) | 8 (10.8%) | 19 (25.3%) | ||
| North Africa | 24 (16.1%) | 13 (20.3%) | 11 (12.9%) | 4 (5.4%) | 6 (8.0%) | ||
| Other | 2 (1.3%) | 1 (1.6%) | 1 (1.2%) | 14 (18.9%) | 10 (13.3%) | ||
| Southeast Asia | 7 (4.7%) | 2 (3.1%) | 5 (5.9%) | 1 (1.4%) | 1 (1.3%) | ||
| Sub-Saharan Africa | 69 (46.3%) | 41 (64.1%) | 28 (32.9%) | 3 (4.1%) | 4 (5.3%) | ||
| Italy | 27 (18.1%) | 0 (0%) | 27 (31.8%) | 40 (54.1%) | 29 (38.7%) | ||
| Education | |||||||
| Primary school | 56 (37.6%) | 29 (45.3%) | 27 (31.8%) | 0.0872 | 33 (44.6%) | 23 (30.7%) | 0.373 |
| Lower secondary school | 36 (24.2%) | 13 (20.3%) | 23 (27.1%) | 15 (20.3%) | 21 (28.0%) | ||
| Higher secondary school | 14 (9.4%) | 4 (6.3%) | 10 (11.8%) | 5 (6.8%) | 9 (12.0%) | ||
| University | 3 (2.0%) | 3 (4.7%) | 0 (0%) | 1 (1.4%) | 2 (2.7%) | ||
| No formal education | 40 (26.8%) | 15 (23.4%) | 25 (29.4%) | 20 (27.0%) | 20 (26.7%) | ||
| Comorbidities | |||||||
| Diabetes | 12 (8.1%) | 2 (3.1%) | 10 (11.8%) | 0.106 | 4 (5.4%) | 8 (10.7%) | 0.379 |
| Hypertension | 9 (6.0%) | 2 (3.1%) | 7 (8.2%) | 0.343 | 4 (5.4%) | 5 (6.7%) | 1 |
| Cardiopathy | 4 (2.7%) | 0 (0%) | 4 (4.7%) | 0.212 | 1 (1.4%) | 3 (4.0%) | 0.622 |
| Pneumopathy | 6 (4.0%) | 0 (0%) | 6 (7.1%) | 0.0803 | 3 (4.1%) | 3 (4.0%) | 1 |
| Neuropsychiatric disorder | 4 (2.7%) | 0 (0%) | 4 (4.7%) | 0.212 | 2 (2.7%) | 2 (2.7%) | 1 |
| Cancer | 2 (1.3%) | 1 (1.6%) | 1 (1.2%) | 1 | 0 (0%) | 2 (2.7%) | 0.482 |
| TB History | 3 (2.0%) | 1 (1.6%) | 2 (2.4%) | 1 | 1 (1.4%) | 2 (2.7%) | 1 |
| Chem sex | 14 (9.4%) | 2 (3.1%) | 12 (14.1%) | 0.0494 | 4 (5.4%) | 10 (13.3%) | 0.177 |
| Missing | 1 (0.7%) | 1 (1.6%) | 0 (0%) | 1 (1.4%) | 0 (0%) | ||
| Consistent condom use | 21 (14.1%) | 10 (15.6%) | 11 (12.9%) | 0.819 | 9 (12.2%) | 12 (16.0%) | 0.662 |
| Access to primary healthcare | 46 (30.9%) | 9 (14.1%) | 37 (43.5%) | <0.001 | 15 (20.3%) | 31 (41.3%) | 0.009 |
| Fear of community exclusion in case of HIV positivity | 88 (59.1%) | 37 (57.8%) | 51 (60.0%) | 0.92 | 43 (58.1%) | 45 (60.0%) | 0.946 |
| Fear of community exclusion in case of HCV positivity | 38 (25.5%) | 16 (25.0%) | 22 (25.9%) | 1 | 16 (21.6%) | 22 (29.3%) | 0.372 |
| Being tested for HIV or HCV in the past | 38 (25.5%) | 14 (21.9%) | 24 (28.2%) | 0.489 | 18 (24.3%) | 20 (26.7%) | 0.889 |
| HCV Knowledge Score, median [Q1, Q3] | 0 [0, 2] | 0 [0, 1] | 1 [0, 3] | 0.001 | 0 [0, 1] | 0 [0, 3] | 0.04 |
| HIV Knowledge Score, median [Q1, Q3] | 2 [0, 4] | 2 [0, 3] | 3 [1, 4] | 0.019 | 2 [0, 3] | 2 [0, 4] | 0.512 |
| Infections | |||||||
| HIV | 3 (2.0%) | 2 (3.1%) | 1 (1.2%) | 0.803 | 1 (1.4%) | 2 (2.7%) | 1 |
| Syphilis | 5 (3.4%) | 2 (3.1%) | 3 (3.5%) | 1 | 5 (6.8%) | 0 (0%) | 0.0665 |
| HCV | 14 (9.4%) | 6 (9.4%) | 8 (9.4%) | 1 | 12 (16.2%) | 2 (2.7%) | 0.01 |
| HBV Infection | 21 (14.1%) | 10 (15.6%) | 11 (12.9%) | 0.819 | 11 (14.9%) | 10 (13.3%) | 0.974 |
| Any infection | 37 (24.8%) | 17 (26.6%) | 20 (23.5%) | 0.816 | 24 (32.4%) | 13 (17.3%) | 0.052 |
| More than one infection | 6 (4.0%) | 3 (4.7%) | 3 (3.5%) | 1 | 5 (6.8%) | 1 (1.3%) | 0.205 |
| Vaccinated against HBV | 21 (14.1%) | 5 (7.8%) | 16 (18.8%) | 0.078 | 7 (9.5%) | 58 (77.3%) | 0.138 |
| Missing | 3 (2.0%) | 0 (0%) | 3 (3.5%) | 0 (0%) | 14 (18.7%) | ||
| Returned for test results | 75 (50.3%) | 26 (40.6%) | 49 (57.6%) | 0.058 | – | – | |
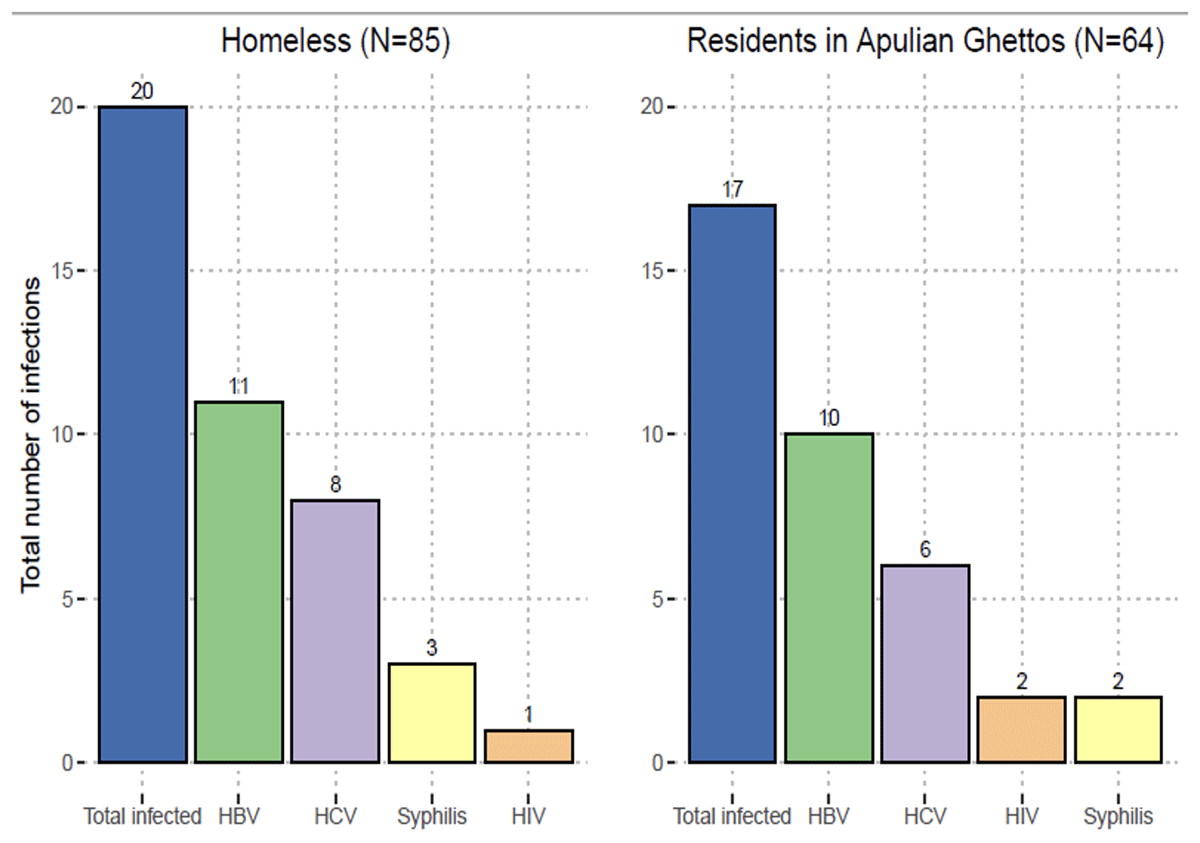
Figure 1
Distribution of infections among migrants and homeless people.
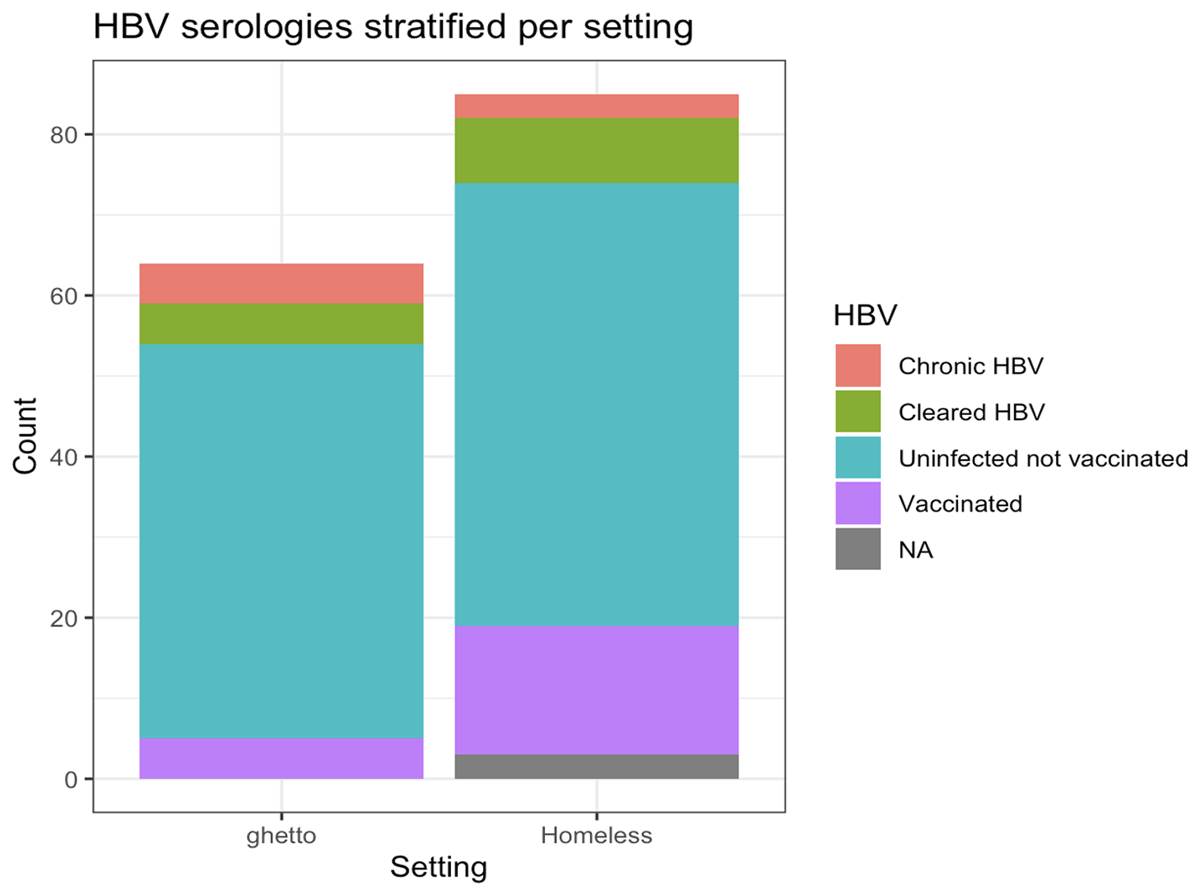
Figure 2
HBV serologies stratified per subpopulation.
Table 2
Multivariable logistic regression model for return for test results.
| FACTOR | aOR | lowCI | highCI | pVALUE |
|---|---|---|---|---|
| (Intercept) | 0.845 | 0.398 | 1.775 | 0.657 |
| Living in Apulian Ghettos | 0.697 | 0.332 | 1.462 | 0.337 |
| Having access to primary healthcare | 2.101 | 0.928 | 4.881 | 0.077 |
| Good HCV knowledge | 2.208 | 0.911 | 5.583 | 0.083 |
| Having contracted HCV | 0.136 | 0.017 | 0.703 | 0.028 |
| Having contracted at least one STD | 0.870 | 0.334 | 2.249 | 0.773 |
| Fear that positive HIV test would result in social exclusion | 1.214 | 0.596 | 2.483 | 0.592 |