
Table 1
Comparing the IORT Course and the UGHE/Harvard Mathematical Modeling (MM) training.
| AREA | IORT | MM TRAINING |
|---|---|---|
| Approach | Deliverable-driven approach to training with intensive mentorship during practicum and in-person sessions. | Deliverable-driven approach to training with intensive mentorship during practicum and in-person sessions. |
| Target trainees | Program and clinical staff | Infectious disease public health professionals |
| Frequency/length of training | Varied, first cohort was 2-day modules, every 4–6 weeks to 3 6-day modules, every 2–5 months, with 3 milestones. | 2 2-week training of four weeks, occurring three months apart. |
| Deliverable | A manuscript submitted to a peer-reviewed journal. | A policy brief and an abstract for conferences. |
| Training advertisement | Advertised within the priority organizations and professional networks. | Advertised within professional networks of the training team and the Training Advisory Committee (TAC), and on social media on LinkedIn, Facebook, and Twitter. |
| Trainee selection and number | Applicants applied in pairs and were selected based on the applications’ strengths and the strategic value of the research. | Applicants applied as individuals or in pairs and were selected upon consultation with TAC based on country, gender, strength of application, and organizational priorities. |
| Training format | Lectures, break-out writing sessions with mentorship, plenary sessions for group feedback and a practicum period to implement skills. | Lectures, class activities to work on their models, presentations for peer and expert feedback, and practicum to implement skills. |
| Facilitation and Mentorship | 2 mentors, 4 project mentors, and 5 junior mentors for the first cohort. In-person mentorship was offered during training and practicums. | 3 core trainers for all four weeks of the training. Three technical experts- one for the 2 weeks of the first session, 1 for each week of the second session of the training. Two training advisors. In-person intensive mentorship offered during training and remote mentorship during practicum. |
| Projects | Simple, descriptive projects, which could be completed within 8 months using routine program data. Trainees were mentored from peer review process to journal acceptance. | Infectious disease program priority questions using parameter values identified from literature, which could be completed during the duration of the training. |
| Data analysis | Data was analyzed in STATA. | Mathematical model was developed and analyzed in Berkeley Madonna, a beginner user friendly differential equation solving tool [17]. |
| Costs | Full scholarship provided to participants including tuition fees, travel, expenses and full accommodation, publication, and conference attendance support, and research fieldwork related costs. | Full scholarship provided to participants including tuition fees, travel, expenses and full accommodation, conference attendance support, and stipend at the end of each session. |
| Monitoring and evaluation | Participants’ appraisal of the training workshop about their background, motivation, and structure of the course. | Participants evaluated the structure and content of the training at the end of each week of training to inform subsequent sessions. Also, trainees provided overall evaluation of the course at the end of the training including training logistics. |
Table 2
Overview of curriculum.
| WEEK | TITLE | LEARNING OUTCOMES | MILESTONES |
|---|---|---|---|
| One | Introduction to infectious disease modeling |
|
|
| Two | Building mathematical models to answer research questions |
|
|
| Three | Incorporating complexity into mathematical models |
|
|
| Four | Communicating and disseminating model findings |
|
|
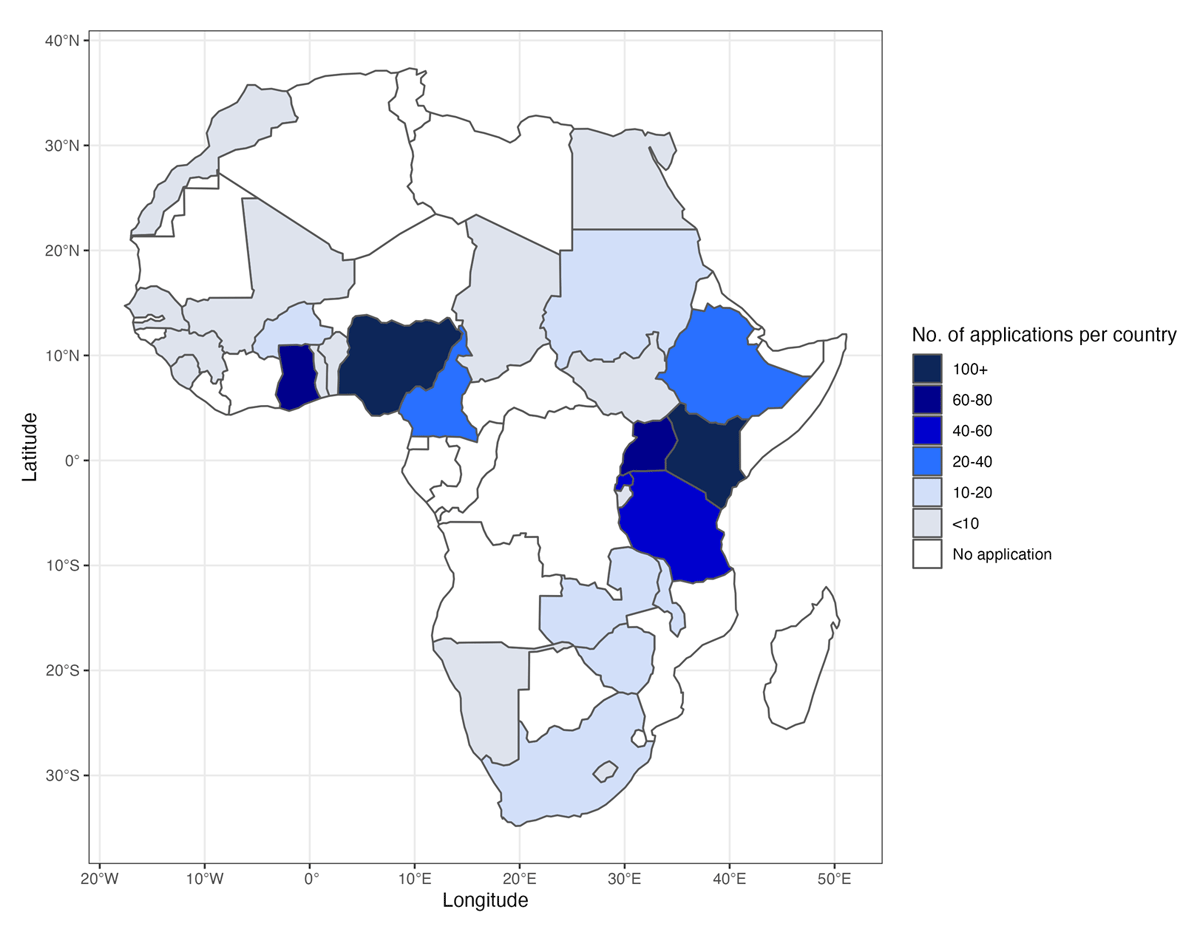
Figure 1
Number of applications per African country.
Table 3
Description of trainees.
| VARIABLE | TRAINEES (n = 10 (%)) |
|---|---|
| Gender | |
| Male | 6 (60%) |
| Female | 4 (40%) |
| Highest education | |
| Bachelors | 1 (10%) |
| Masters | 7 (70%) |
| Doctorate | 2 (20%) |
| Country | |
| Rwanda | 6 (60%) |
| Uganda | 2 (20%) |
| Kenya | 2 (20%) |
| Type of organization | |
| Government | 9 (90%) |
| Academia | 1 (10%) |
| Background | |
| Research | 6 (60%) |
| Policy/program | 4 (40%) |
| Ever taken a course in infectious disease epidemiology | |
| Yes | 5 (50%) |
| No | 5 (50%) |
| Ever taken a course in mathematical modeling of infectious diseases? | |
| No | 10 (100%) |
| Relevance of course to current work | |
| Extremely relevant | 7 (70%) |
| Very relevant | 3 (30%) |
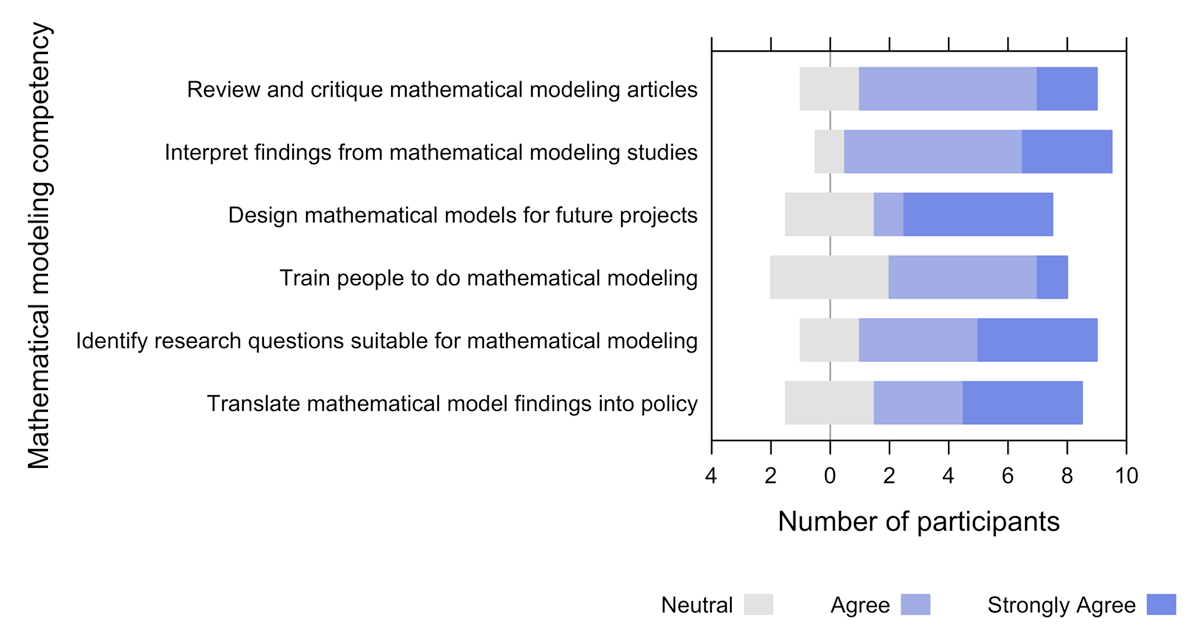
Figure 2
Assessment of mathematical modeling capacity competency using data from the ten participants.
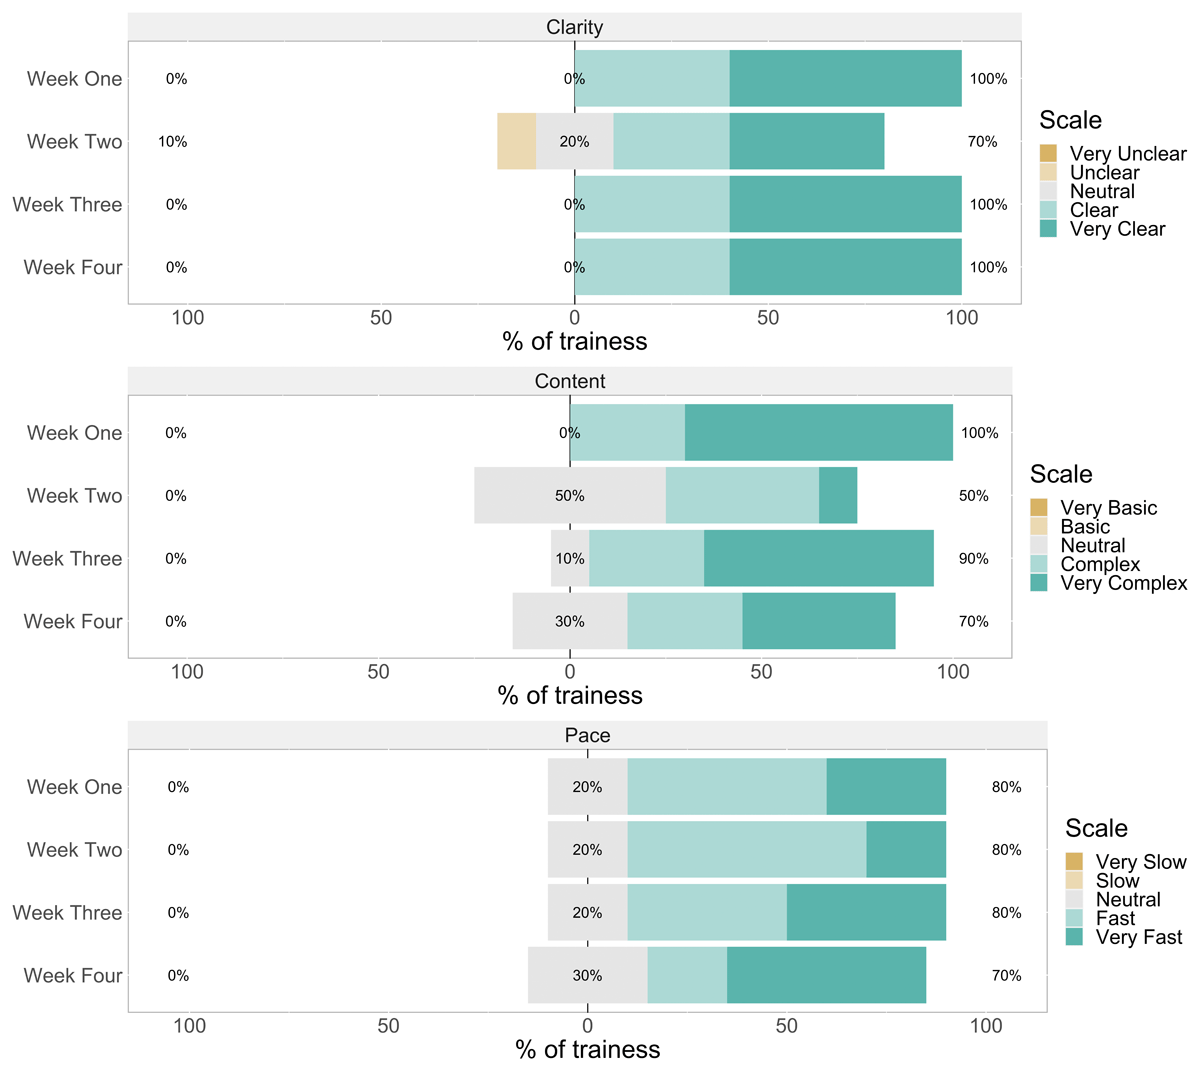
Figure 3
Bar charts of rating of clarity (upper panel), content (middle panel), and pace (lower panel) of lectures at the end of each training week (n = 10).
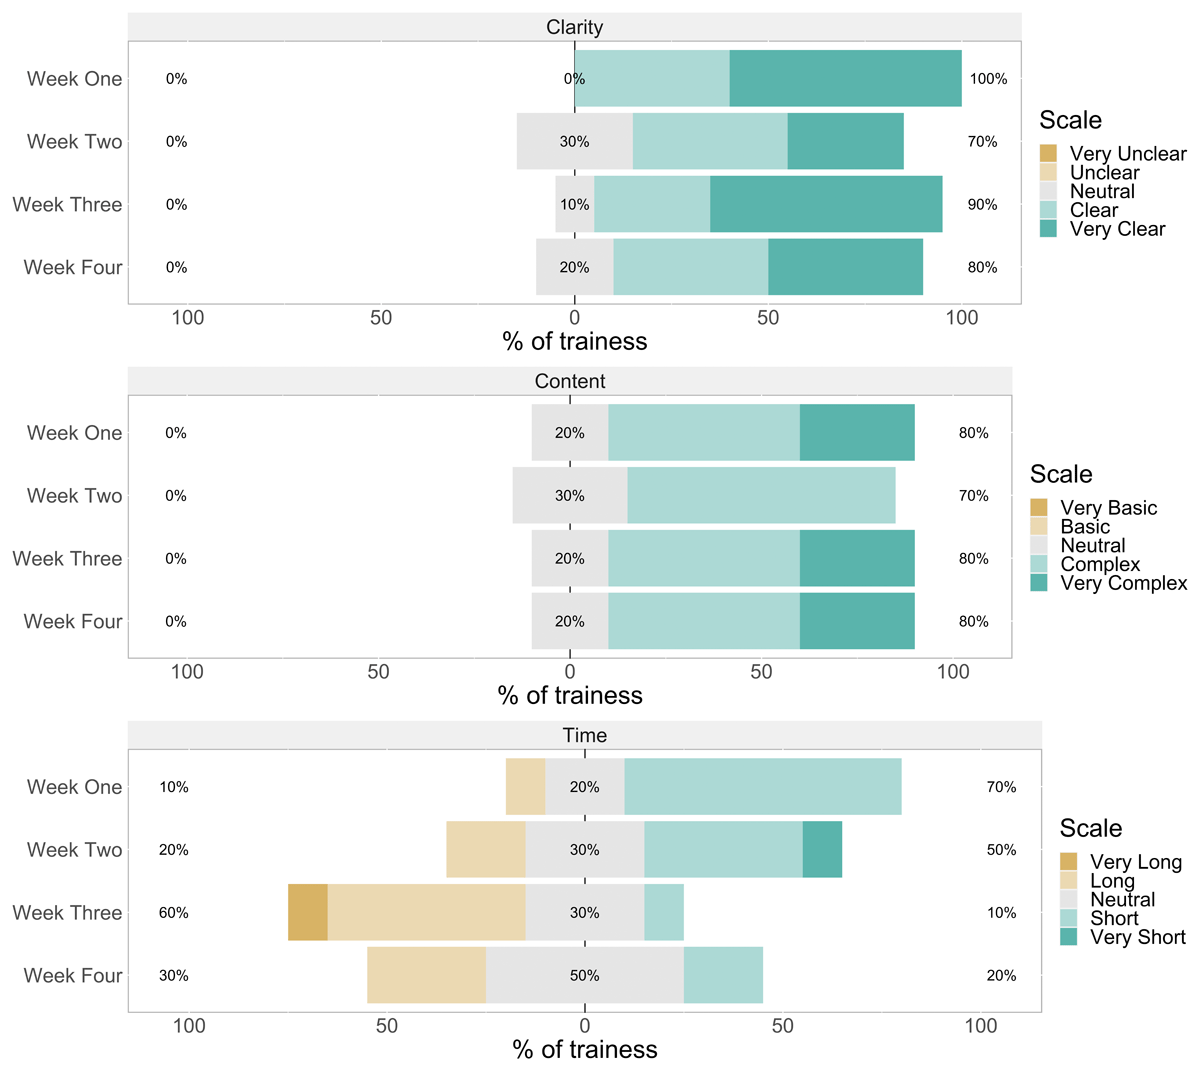
Figure 4
Bar charts of rating of clarity (upper panel), content (middle panel), and time allocation (lower panel) of activities at the end of each training week (n = 10).