
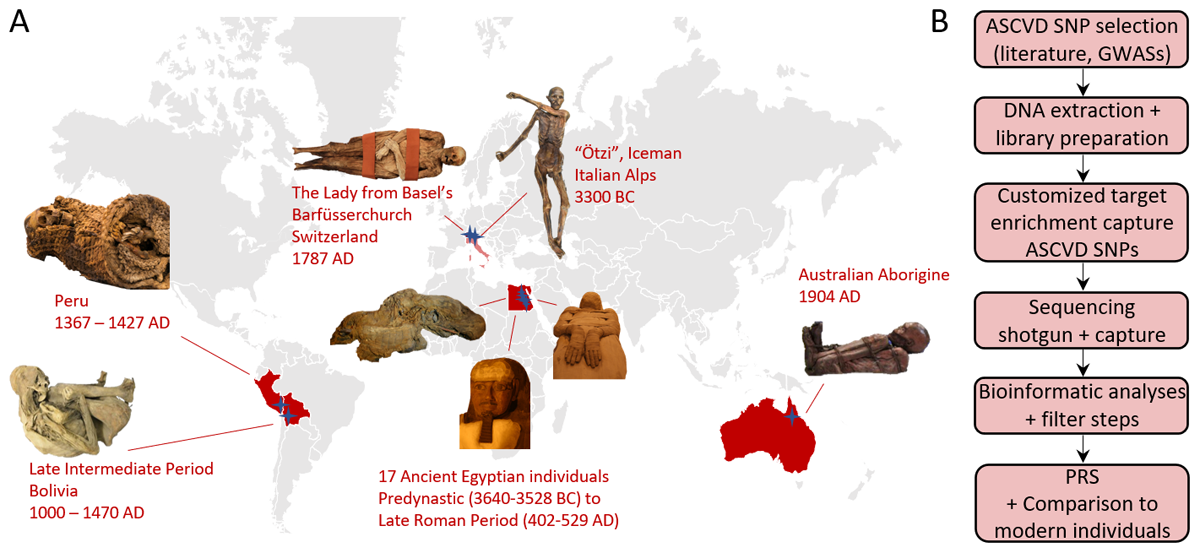
Figure 1
Mummified individuals and workflow of this study. (A) Human remains from four different continents were analyzed covering a time span of about 5,500 years of human history. Stars represent the finding sites. (B) The workflow containing in silico, laboratory, and bioinformatic analyses with the final evaluation of polygenic risk scores (PRS).

Figure 2
Study design and SNP coverage. (A) Filter steps to receive the final number of ASCVD-associated SNPs for the calculation of the weighted risk score. (B) Comparison between achieved numbers of the 163 targeted SNPs of shotgun datasets and the normalized captured datasets. Colored symbols indicate the four individuals with a few covered target SNPs already after shotgun sequencing. (C) Sequenced SNPs of the final 87 SNP collection were divided in a coverage below 5 (blue) and 5 and above (red). The latter are used for the calculation of PRSs.
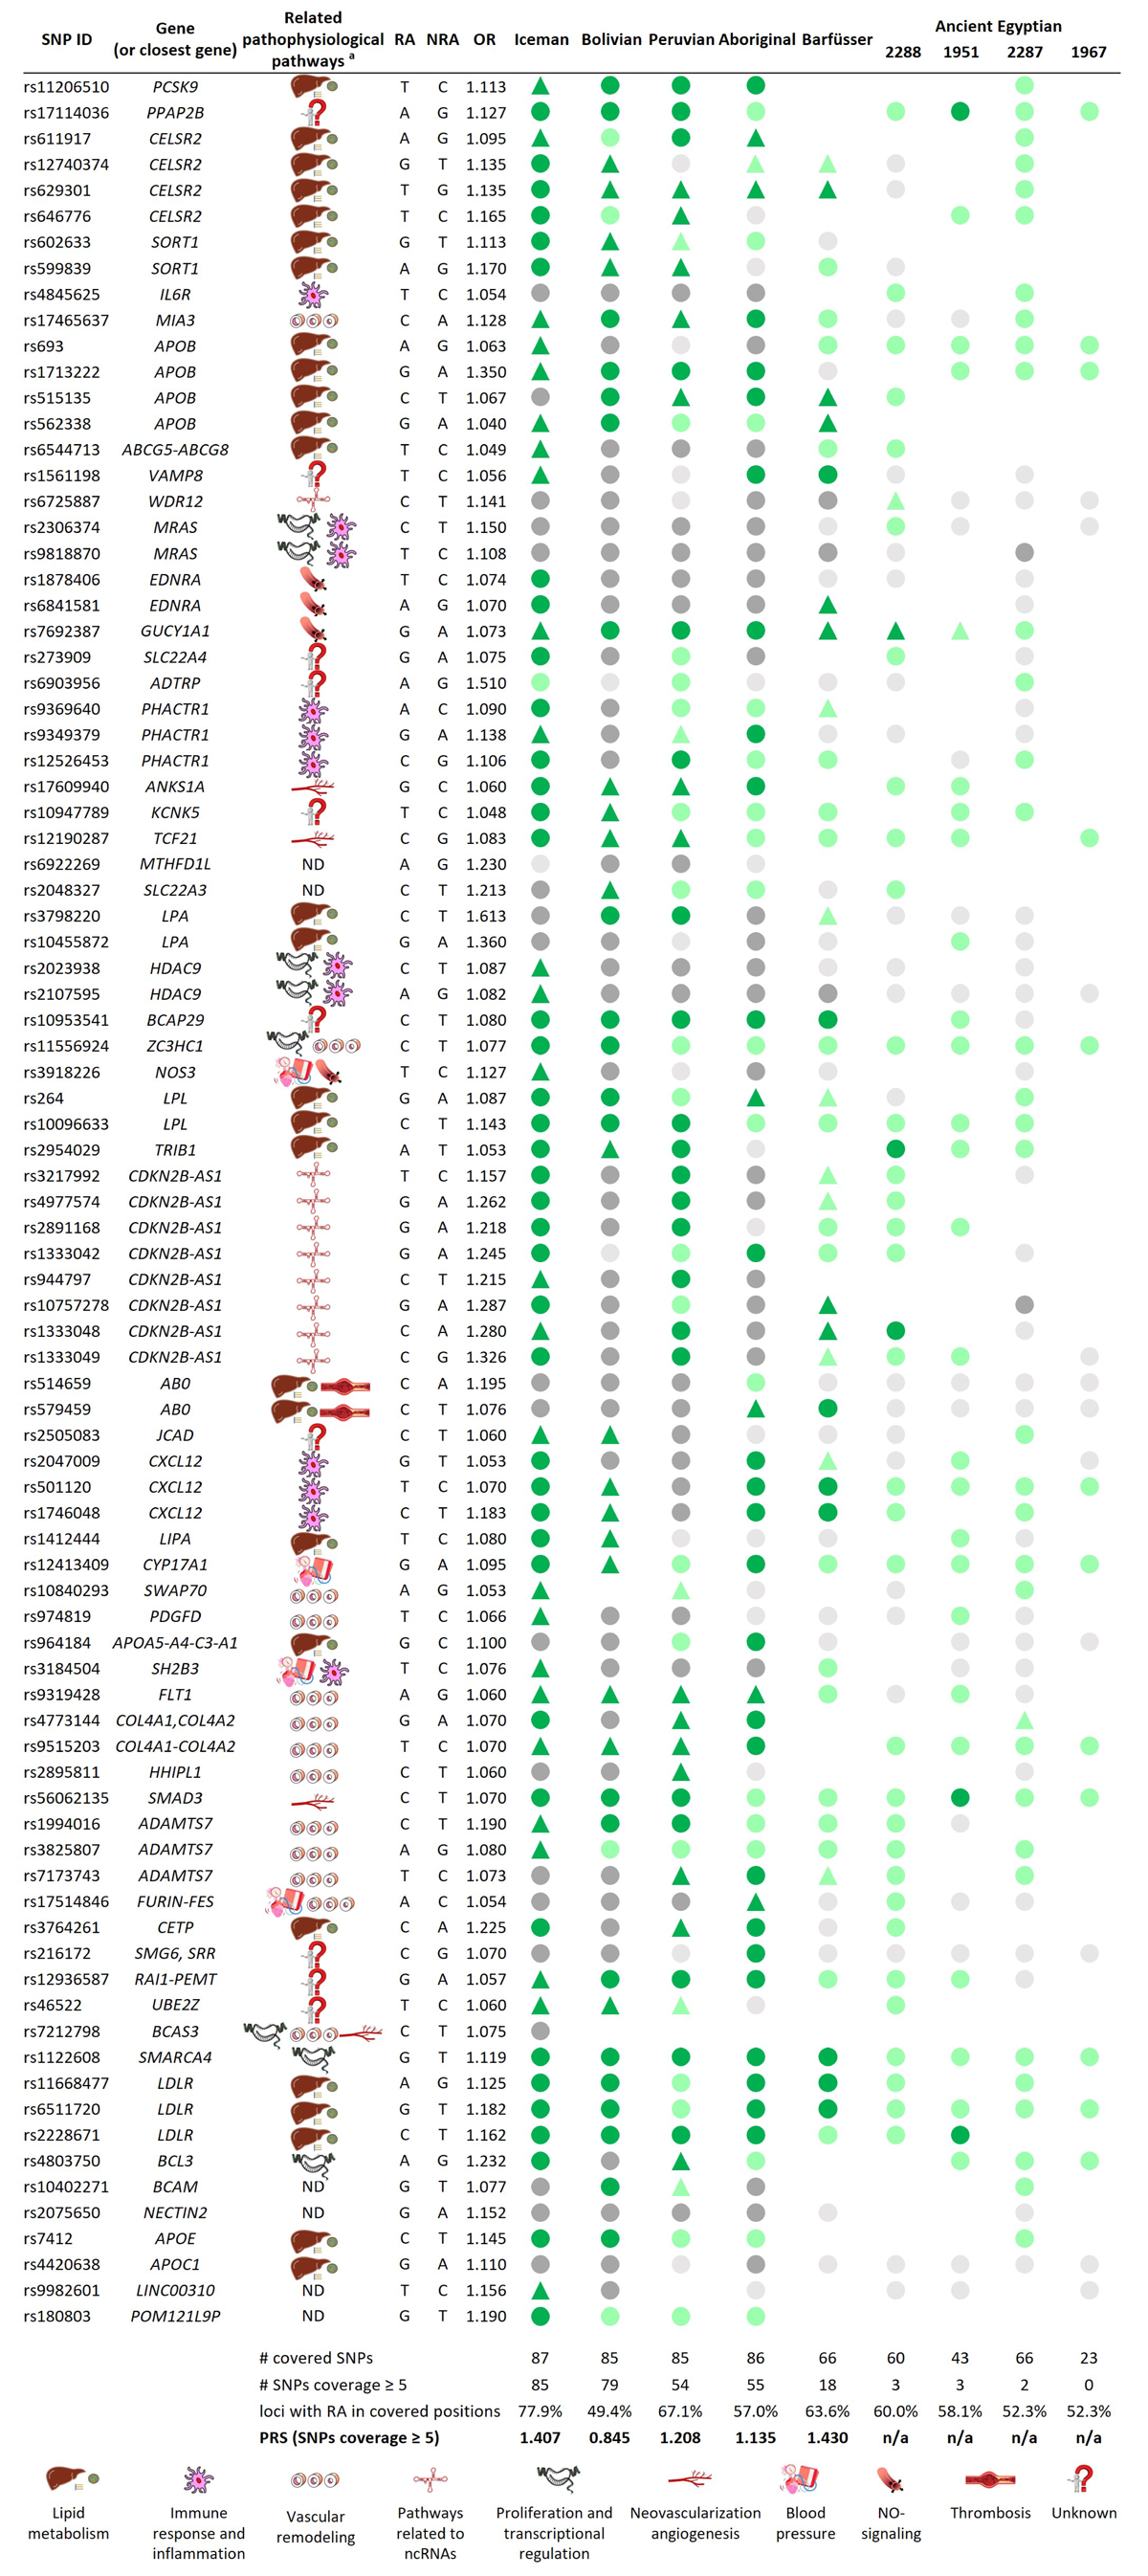
Figure 3
Overview of the 87 final SNPs and calculated PRSs. RA = risk allele, NRA = non-risk allele, circles = homozygote state, triangle = heterozygote state, green = RA is present, grey = RA is not present, dark color = coverage ≥ 5; light color = coverage < 5; empty spot = locus has not been covered, ND = not determined, n/a = not applicable.aRelated pathophysiological pathways based on [43839].
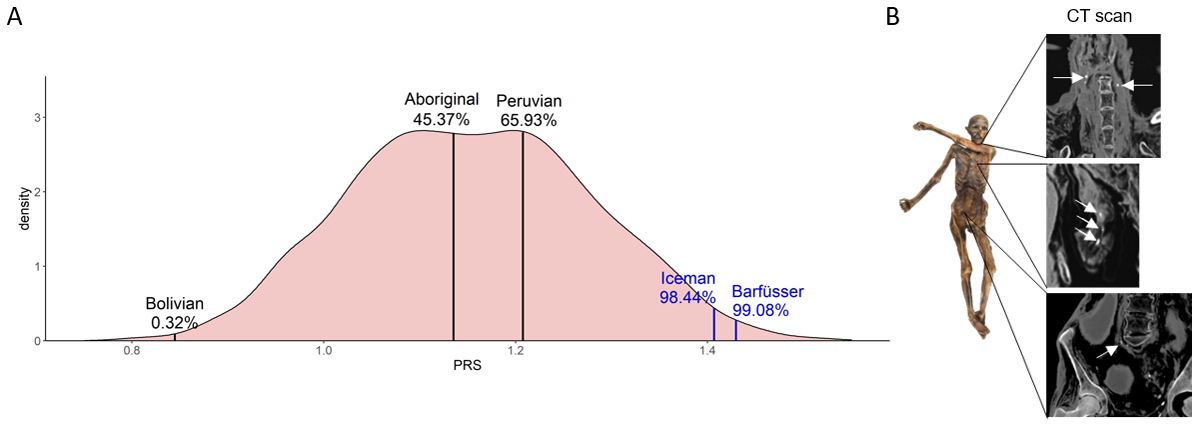
Figure 4
Comparison of PRSs of modern and ancient individuals. (A) Density curve of PRSs of 2504 unrelated modern individuals from 26 populations from all over the world. PRSs of ancient individuals are plotted on top of the modern individuals. The percentage displays the number of modern individuals with a lower PRS than the ancient individual. In blue: Individuals with calcified plaques identified on CT scans. (B) In CT scans of the Iceman calcifications were found within the carotid artery, the area of the heart, and the right iliac artery.