
Table 1
Demographic data of respondents.
| VARIABLES | FREQUENCY | PERCENTAGE (%) |
|---|---|---|
| Sex | ||
| Male | 318 | 51.7 |
| Female | 297 | 48.3 |
| Total | 615 | 100 |
| Age (years) | ||
| 18–44 | 490 | 82.9 |
| 45–60 | 90 | 15.2 |
| >60 | 11 | 1.9 |
| Total | 591 | 100 |
| Marital status | ||
| Single | 281 | 45.7 |
| Married | 270 | 43.9 |
| Divorced | 17 | 2.8 |
| Widow(er) | 8 | 1.3 |
| Cohabiting | 39 | 6.3 |
| Total | 615 | 100 |
| Employment status | ||
| Unemployed | 208 | 33.9 |
| Self-employed | 290 | 47.2 |
| Employed by others | 116 | 18.9 |
| Total | 614 | 100 |
| Educational qualification | ||
| None | 30 | 4.9 |
| Primary | 27 | 4.4 |
| Secondary | 319 | 52.3 |
| Tertiary | 206 | 33.8 |
| Vocational/Technical | 28 | 4.6 |
| Total | 610 | 100 |
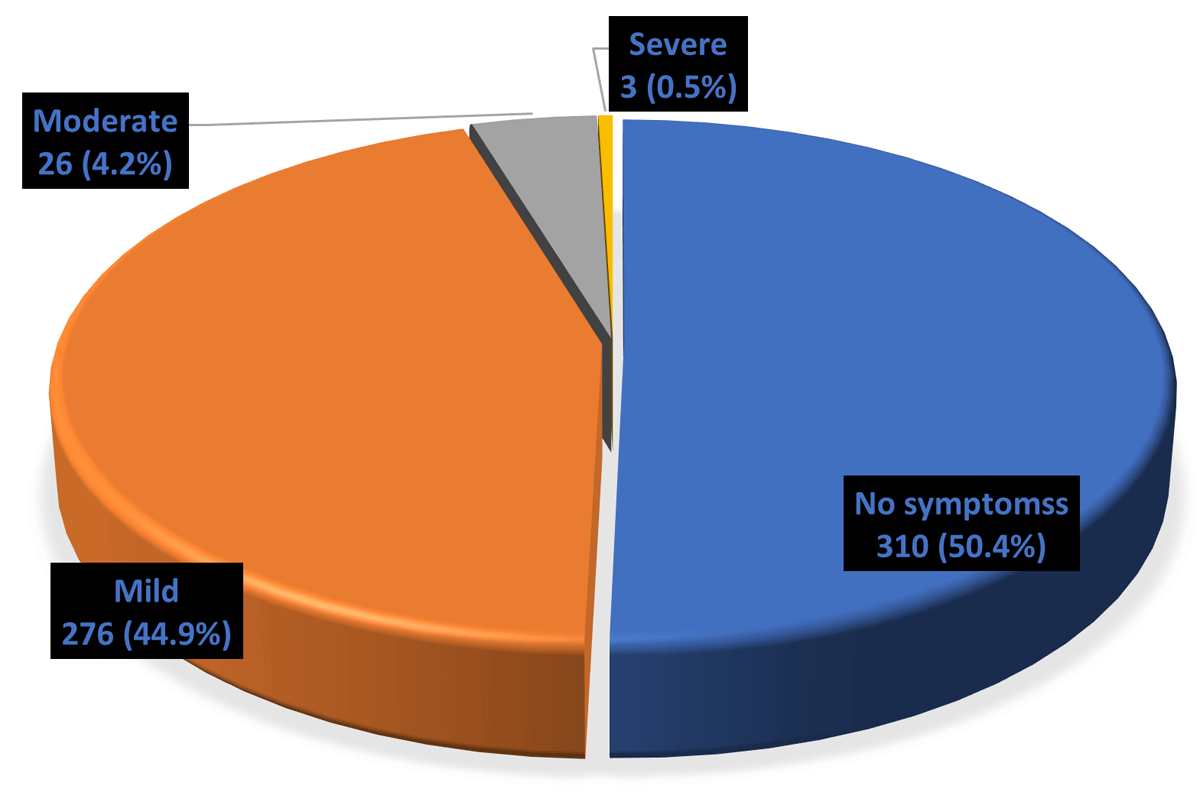
Figure 1
Resp disease symptoms.
Table 2
Prevalence of respiratory disease symptoms according to communities.
| VARIABLES | SAMPOU | NEMBE | GBARAIN | TOTAL | X2 (p-VALUE) |
|---|---|---|---|---|---|
| SYMPTOMS OF RESPIRATORY DISEASE | FREQ (%) | FREQ (%) | FREQ (%) | FREQ (%) | df |
| No symptoms | 95 (30.6) | 98 (31.6) | 117 (37.7) | 310 (50.4) | 6.673 (0.154) |
| Mild symptoms | 102 (37.0) | 95 (34.4) | 79 (28.6) | 276 (44.9) | df = 4 |
| Moderate to severe symptoms | 8 (27.6) | 12 (41.4) | 9 (31.0) | 29 (4.7) | |
| Total | 205 (33.3) | 205 (33.3) | 205 (33.3) | 615 (100.0) |
[i] X2: Chi-squared.
Table 3
Prevalence of specific respiratory disease symptoms (multiple responses were given).
| VARIABLES | SAMPOU | NEMBE | GBARAIN | TOTAL | X2 (p-VALUE) |
|---|---|---|---|---|---|
| FREQ (%) | FREQ (%) | FREQ (%) | FREQ (%) | ||
| Chest pain with deep breathing | 75 (34.8) | 73 (34.0) | 67 (31.2) | 215 (35.0) | 0.744 (0.689) |
| Coughing that produces thick sputum | 73 (49.3) | 39 (26.4) | 36 (24.3) | 148 (24.1) | 22.548 (<0.001)* |
| Coughing that occurs mostly when lying down | 21 (28.8) | 35 (47.9) | 17 (23.3) | 73 (11.9) | 8.331 (0.016)* |
| Coughing up blood | 0 (0.0) | 5 (55.6) | 4 (44.4) | 9 (1.5) | 4.736 (0.094) |
| Coughing that wakes early in the morning | 23 (38.3) | 25 (41.7) | 12 (20.0) | 60 (9.8) | 5.430 (0.066) |
| Difficulty breathing | 15 (41.7) | 13 (36.1) | 8 (22.2 | 36 (5.9) | 2.301 (0.316) |
| Breathlessness when walking fast | 14 (29.2) | 20 (41.7) | 14 (29.2) | 48 (7.8) | 1.627 (0.443) |
| Breathlessness when walking normally | 2 (10.0) | 6 (30.0) | 12 (60.0) | 20 (3.3) | 7.855 (0.02)* |
| Breathlessness when working | 15 (40.5) | 9 (24.3) | 13 (35.1) | 37 (6.0) | 1.610 (0.447) |
| Persistent stuffy nose | 12 (33.3) | 16 (44.4) | 8 (22.2) | 36 (5.9) | 2.832 (0.243) |
| Persistent running nose | 28 (54.9) | 18 (35.3) | 5 (9.8) | 51 (8.3) | 17.062 (<0.001)* |
| Thick mucus production without coughing | 6 (16.2) | 19 (51.4) | 12 (32.4) | 37 (6.0) | 7.304 (0.026)* |
| Whistling sounds from chest | 1 (5.8) | 8 (47.1) | 8 (47.1) | 17 (2.8) | 5.929 (0.05)* |
| Chest tightness | 8 (21.6) | 16 (43.2) | 13 (35.1) | 37 (6.0) | 2.818 (0.244) |
| Episodes of struggling to breathe | 5 (29.4) | 6 (35.3) | 6 (35.3) | 17 (2.8) | 0.121 (0.941) |
Table 4
Logistic regression of the prevalence of respiratory symptoms relative to the study community.
| VARIABLE | CATEGORIES | p-VALUE | ODDS RATIOS | 95% CONFIDENCE INTERVAL | |
|---|---|---|---|---|---|
| LOWER | UPPER | ||||
| Community | Sampou | 1 | |||
| Gbarain | 0.261 | 0.768 | 0.485 | 1.216 | |
| Nembe | 0.596 | 1.127 | 0.725 | 1.751 | |
| Age | 0.839 | 0.998 | 0.981 | 1.016 | |
| Sex | Females | 1 | |||
| Males | 0.037* | 0.679 | 0.472 | 0.976 | |
| Employment status | Unemployed | 1 | |||
| Self employed | 0.665 | 1.103 | 0.708 | 1.718 | |
| Working for another | 0.362 | 1.335 | 0.717 | 2.487 | |
| Educational status | None | 1 | |||
| Primary | 0.078 | 3.345 | 0.874 | 12.807 | |
| Secondary | 0.348 | 0.657 | 0.273 | 1.580 | |
| Tertiary | 0.275 | 0.598 | 0.237 | 1.505 | |
| Vocational/Technical | 0.736 | 0.815 | 0.248 | 2.675 | |
| Alcohol consumption | None | 1 | |||
| Occasional | 0.381 | 1.557 | 0.579 | 4.190 | |
| Habitual | 0.697 | 1.221 | 0.447 | 3.333 | |
| Perception of health risk score | High | 0.002* | 0.935 | 0.895 | 0.976 |
| Low | 1 | ||||
| No smoking | 1 | ||||
| Smoking | Past smoker | 0.189 | 1.623 | 0.788 | 3.343 |
| Present smoker | 0.002* | 4.279 | 1.680 | 10.898 | |