
Table 1
Socio-demographic profile of participants.
| VARIABLES | N = 261 |
|---|---|
| Age (a) | 33.38 ± 7.30 |
| Sex | |
| Male | 148 (56.7%) |
| Female | 113 (43.3%) |
| Marital Status | |
| Married | 122 (46.7%) |
| Single | 80 (30.7%) |
| Widow | 52 (19.9%) |
| Other | 7 (2.7%) |
| Country of Origin | |
| Venezuela | 132 (50.6%) |
| Haiti | 115 (44%) |
| Others | 14 (5.4%) |
| Years of Study | 10.42 ± 2.09 |
| Church denomination | |
| Catholic | 156 (59.8%) |
| Other | 65 (24.9%) |
| Evangelic | 40 (15.3%) |
| Language | |
| Spanish | 143 (54.8%) |
| French | 109 (41.8%) |
| Creole | 89 (64.1%) |
| English | 8 (3.1%) |
[i] ** Multiple choice response because, in the language variable, participants reported fluency in more than one option.
[ii] (a) Results expressed as mean ± standard deviation.
Other results through frequency analysis.
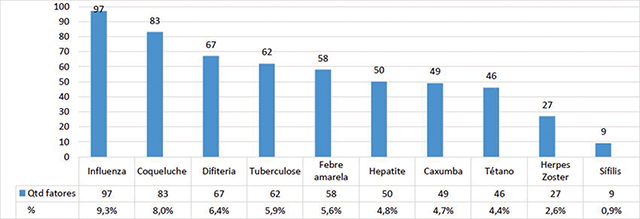
Figure 1
Prevalence of infectious diseases among refugees at Porto Alegre.
Table 2
Association of risk factors for influenza, pertussis, diphtheria and tuberculosis with the other study variables.
| Influenza | Muscle Pain | Fever | Nasal Discharge | Weakness | ||||||||
| No | Yes | p | No | Yes | P | No | Yes | p | No | Yes | p | |
| Age (a) | 33.51 ± 7.43 | 33.59 ± 6.56 | 00.85 | 33.42 ± 7.41 | 33.88 ± 5.6 | 00.71 | 33.07 ± 6.62 | 36.45 ± 11.90 | 00.18 | 36.45 ± 7.24 | 32.52 ± 8.6 | 00.66 |
| Sex (b) | 00.2 | 00.46 | 00.18 | 00.17 | ||||||||
| Female | 99 (44.6%) | 14 (35.9%) | 105 (43%) | 8 (47.1%) | 100 (42.2) | 13 (54.2%) | 108 (44.3%) | 5 (29.4%) | ||||
| Male | 123 (55.4%) | 25 (64.1%) | 139 (57%) | 9 (52.9%) | 137 (57.8) | 11 (45.8%) | 136 (55.7%) | 12 (70.6%) | ||||
| Country of origin | 00.04** | 00.03** | 00.23 | 00.04** | ||||||||
| Haiti | 93 (41.9%) | 22 (56.4%) | 101 (41.4) | 14 (82.4) | 104 (43.9) | 11 (45.8%) | 102 (41.8%) | 13 (76.5%) | ||||
| Venezuela | 93 (41.9%) | 13 (33.3%) | 130 (53.3) | 2 (11.8%) | 122 (51.5) | 10 (41.7%) | 130 (5.3%) | 2 (11.8%) | ||||
| Others | 10 (4.5%) | 4 (10.3%) | 13 (5.3%) | 1 (5.9%) | 11 (4.6%) | 3 (12.5%) | 12 (4.9%) | 2 (11.8%) | ||||
| Pertussis | Frequent Sneezing | Fever | Nasal Discharge | Watery Eyes | ||||||||
| No | Yes | p | No | Yes | P | No | Yes | p | No | Yes | p | |
| Age (a) | 33.12 ± 6.81 | 34.92 ± 9.65 | 00.27 | 33.42 ± 7.41 | 32.88 ± 5.6 | 00.71 | 33.10 ± 6.61 | 36.41 ± 12.39 | 00.23 | 33.36 ± 7.34 | 4.33 ± 5.27 | 00.67 |
| Sex (b) | 00.14 | 00.46 | 00.18 | 00.47 | ||||||||
| Female | 100 (44.8%) | 13 (34.2%) | 105 (43%) | 8 (47.1%) | 101 (42.3) | 12 (54.5%) | 111 (43.5%) | 2 (33.3%) | ||||
| Male | 123 (55.2%) | 25 (65.8%) | 139 (57%) | 9 (52.9%) | 138 (57.7) | 10 (45.5%) | 144 (56.5%) | 4 (66.7%) | ||||
| Country of origin | 00.1 | 00.03** | 00.12 | 00.06 | ||||||||
| Haiti | 95 (42.6%) | 20 (52.6%) | 101 (41.54) | 14 (82.4) | 104 (43.5) | 11 (50%) | 112 (43.9%) | 3 (50%) | ||||
| Venezuela | 118 (52.9%) | 14 (36.8%) | 130 (53.3) | 2 (11.8%) | 124 (51.9) | 8 (36.4%) | 131 (51.4%) | 1 (16.7%) | ||||
| Others | 10 (4.5%) | 4 (10.5%) | 13 (5.3%) | 1 (5.9%) | 11 (4.6%) | 3 (13.6%) | 12 (4.7%) | 2 (33.3%) | ||||
| Diphtheria | Frequent Sneezing | Fever | Nasal Discharge | Watery Eyes | ||||||||
| No | Yes | p | No | Yes | p | No | Yes | p | No | Yes | p | |
| Age (a) | 33.12 ± 6.81 | 34.92 ± 9.65 | 00.27 | 33.42 ± 7.41 | 32.88 ± 5.56 | 0.71 | 33.10 ± 6.61 | 36.41 ± 12.39 | 00.23 | 33.36 ± 7.34 | 4.33 ± 5.27 | 00.67 |
| Sex (b) | 00.14 | 00.46 | 00.18 | 00.47 | ||||||||
| Female | 100 (44.8%) | 13 (34.2%) | 105 (43%) | 8 (47.1%) | 101 (42.3) | 12 (54.5%) | 111 (43.5%) | 2 (33.3%) | ||||
| Male | 123 (55.2%) | 25 (65.8%) | 139 (57%) | 9 (52.9%) | 138 (57.7) | 10 (45.5%) | 144 (56.5%) | 4 (66.7%) | ||||
| Country of origin | 00.1 | 00.03** | 00.12 | 00.06 | ||||||||
| Haiti | 95 (42.6%) | 20 (52.6%) | 101 (41.54) | 14 (82.4%) | 104 (43.5) | 11 (50%) | 112 (43.9%) | 3 (50%) | ||||
| Venezuela | 118 (52.9%) | 14 (36.8%) | 130 (53.3) | 2 (11.8%) | 124 (51.9) | 8 (36.4%) | 131 (51.4%) | 1 (16.7%) | ||||
| Others | 10 (4.5%) | 4 (10.5%) | 13 (5.3%) | 1 (5.9%) | 11 (4.6%) | 3 (13.6%) | 12 (4.7%) | 2 (33.3%) | ||||
| Tuberculosis | Muscle Pain | Fever | Nasal Discharge | Weakness | ||||||||
| No | Yes | p | No | Yes | p | No | Yes | p | No | Yes | p | |
| Age (a) | 33.39 ± 7.39 | 33.22 ± 4.29 | 33.61 ± 7.42 | 30.60 ± 4.1 | 33.42 ± 7.40 | 32.80 ± 5.3 | 33.44 ± 7.38 | 32.61 ± 6.4 | ||||
| Sex (b) | 00.17 | 00.52 | 00.14 | 00.26 | ||||||||
| Female | 111 (44%) | 2 (22.2%) | 104 (43.2) | 9 (45%) | 109 (44.3%) | 4 (26.7%) | 107 (44%) | 6 (33.3%) | ||||
| Male | 141 (56%) | 7 (77.8%) | 137 (58.8) | 11 (55%) | 137 (55.7%) | 11 (73%) | 136 (56%) | 12 (66.7) | ||||
| Country of origin | 00.11 | 00.04** | 00.01** | 00.01** | ||||||||
| Haiti | 108 (42.9%) | 7 (77.8%) | 101 (41.9) | 14 (70%) | 108 (43.9%) | 7 (46.7%) | 102 (42%) | 13 (72.2) | ||||
| Venezuela | 130 (5.6%) | 2 (22.2%) | 127 (52.7) | 5 (25%) | 129 (52.4%) | 3 (20%) | 129 (53.1%) | 3 (16.7%) | ||||
| Others | 14 (5.6%) | 0 (0%) | 13 (5.4%) | 1 (5%) | 9 (3.7%) | 5 (33%) | 12 (4.9%) | 2 (11.1%) | ||||
[i] (a) t-test for independent samples.
[ii] (b) Fischer’s exact test.
[iii] ** Significance level 0.05.