
Table 1
Socio-demographic characteristics of mothers of infants in Mangu LGA (N = 200, Females = 145; Males = 55).
| VARIABLES | FEMALE F (%) | MALE F (%) | TOTAL F (%) | P-VALUE |
|---|---|---|---|---|
| Age Group | 0.651 | |||
| <6 months | 115 (79.3) | 42 (76.4) | 157 (78.5) | |
| 6–12 months | 30 (20.7) | 13 (23.6) | 43 (21.5) | |
| Mother’s Occupation | 0.884 | |||
| Student | 28 (19.3) | 8 (14.5) | 36 (18.0) | |
| Civil servant | 28 (19.3) | 11 (20.0) | 39 (19.5) | |
| Trader | 71 (49.0) | 30 (54.5) | 101 (50.5) | |
| Farmer | 3 (2.1) | 1 (1.9) | 4 (2.0) | |
| Unemployed | 15 (10.3) | 5 (9.1) | 20 (10.0) | |
| Mother’s Educational Level | 0.093 | |||
| No formal education | 1 (0.7) | 2 (3.6) | 3 (1.5) | |
| Primary school uncompleted | 1 (0.7) | 1 (1,8) | 2 (1) | |
| Primary school completed | 7 (4.8) | 3 (5.5) | 10 (5) | |
| Secondary school uncompleted | 21 (14.5) | 9 (16.4) | 30 (15) | |
| Secondary school completed | 73 (50.3) | 20 (36.4) | 93 (46.5) | |
| Tertiary | 42 (29.0) | 20 (36.4) | 62 (31.0) | |
| Parent’s Marital Status | 0.522 | |||
| Married | 127 (87.7) | 49 (89.1) | 176 (88.0) | |
| Single | 6 (4.1) | 2 (3.6) | 8 (4.0) | |
| Widow/widower | 5 (3.4) | 3 (5.5) | 8 (4.0) | |
| Divorced | 1 (0.7) | 1 (1.8) | 2 (1.0) | |
| Separated | 6 (4.1) | 0 (0.0) | 6 (3.0) | |
| Religion | 0.046 | 0.831 | 0.831 | |
| Christianity | 114 (78.6) | 44 (80.0) | 158 (79.0) | |
| Islam | 31 (21.4) | 11 (20.0) | 42 (21.0) | |
Table 2
Infant feeding practices of Mothers in Mangu LGA, Plateau State (N = 200, Females = 145; Males = 55).
| VARIABLE | FREQUENCY (%) |
|---|---|
| Breastfeeding Initiation | |
| Within 1 hour | 78 (39.0%) |
| Within 24 hours and above | 122 (61.0%) |
| Practiced Prelacteal Feeding | |
| Yes | 76 (38.0%) |
| No | 124 (62.0%) |
| First Food/Fluid Given to the Infants | |
| Breastmilk only | 124 (62.0%) |
| Warm water | 62 (31.0%) |
| Glucose water | 14 (7.0%) |
| Ever Breastfed | |
| Yes | 200 (100.0%) |
| No | 0 (0.0%) |
| Practiced Exclusive Breastfeeding | |
| Yes | 57 (28.5%) |
| No | 143 (71.5%) |
| Age of Complementary Food Introduction | |
| 0–3 months | 35 (17.5%) |
| >3 months – <6 months | 32 (16.0%) |
| At 6 months | 57 (28.5%) |
| 7–12 months | 32 (16.9%) |
| >12 months | 2 (1.0%) |
Table 3
Prevalence of adolescent motherhood in Mangu LGA, Plateau State (N = 200, Females = 145; Males = 55).
| VARIABLES | FEMALE F (%) | MALE F (%) | TOTAL F (%) | P-VALUE |
|---|---|---|---|---|
| Adolescent motherhood at first childbirth | 0.653 | |||
| 10–15 years | 7 (4.8) | 1 (1.8) | 8 (4.0) | |
| 16–19 years | 46 (31.8) | 21 (38.2) | 67 (33.5) | |
| >19 years | 92 (63.4) | 33 (60.0) | 125 (62.5) | |
| Adolescent motherhood at present child | 0.279 | |||
| 10–15 years | 2 (1.4) | 0 (0) | 2 (1.0) | |
| 16–19 years | 18 (12.4) | 11 (20.0) | 29 (14.5) | |
| >19 years | 125 (86.2) | 44 (80.0) | 122 (84.5) | |
Table 4
Prevalence of malnutrition among infants in Mangu LGA (N = 200, Females = 145; Males = 55).
| VARIABLE | FEMALE F (%) | MALE F (%) | TOTAL F (%) | P-VALUE |
|---|---|---|---|---|
| Length-for-Age | 0.112 | |||
| Severe stunting | 13 (9.0) | 5 (9.1) | 18 (9.0) | |
| Moderate stunting | 35 (24.1) | 6 (10.9) | 41 (20.5) | |
| Normal | 97 (66.9) | 44 (80.0) | 141 (70.5) | |
| Weight-for-Length | 1.000 | |||
| Severe wasting | 5 (3.4) | 2 (3.6) | 7 (3.5) | |
| Moderate wasting | 13 (9.0) | 4 (7.3) | 17 (8.5) | |
| Normal | 127 (87.6) | 49 (89.1) | 176 (88.0) | |
| Weight-for-Age | 0.573 | |||
| Severe underweight | 1 (0.7) | 1 (1.8) | 2 (1.0) | |
| Moderate underweight | 12 (8.3) | 3 (5.5) | 15 (7.5) | |
| Normal | 132 (91.0) | 51 (92.7) | 183 (91.5) | |
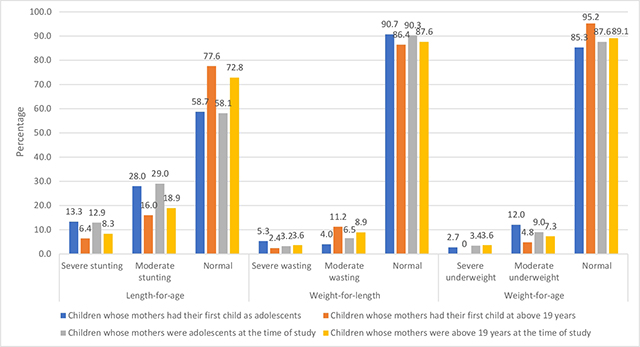
Figure 1
Prevalence of Malnutrition among Children of Adolescent Mothers (N = 200, Females = 145; Males = 55).
The results of the correlation analysis indicated a significant positive correlation (r = 0.252; p = 0.000) between the weight of infants and the duration of breastfeeding.
Table 5
The statistical relationship between the nutrition indices of children of adolescent mothers and mothers above 19 years of age (N = 200, Females = 145; Males = 55).
| NUTRITION INDICES | AGE OF MOTHER AT FIRST CHILDBIRTHχ2 (P-VALUE) | AGE OF MOTHER AT THE TIME OF STUDYχ2 (P-VALUE) |
|---|---|---|
| Length-for-age | 8.180 (0.017*) | 2.729 (0.256) |
| Weight-for-length | 4.108 (0.128) | 0.900 (0.211) |
| Weight-for-age | 7.072 (0.029*) | 5.932 (0.052) |
[i] The statistical relationship is significant (*) when p < 0.05.