
Table 1
Sociodemographic characteristics of respondents and their spouses according to groups of women in two communities in the Kembata Tembaro zone, Southern Ethiopia, November 2021.
| SOCIOECONOMIC VARIABLES | PARTICIPANT’S CATEGORY | TOTAL PARTICIPANTS | |
|---|---|---|---|
| GOLDEN HAND | NON-GOLDEN HAND | ||
| Wealth index | |||
| 1st quintile | 150 (82.4%) | 32 (17.6%) | 182 (15.04%) |
| 2nd quintile | 104 (82.5%) | 22 (17.5%) | 126 (10.04%) |
| 3rd quintile | 94 (55.0%) | 77 (45.0%) | 171 (14.13%) |
| 4th quintile | 63 (29.3%) | 152 (70.7%) | 215 (17.77%) |
| 5th quintile | 29 (5.6%) | 487 (94.4%) | 516 (42.64%) |
| Residence | |||
| Urban | 399 (65.6%) | 209 (34.4) | 602 (49.75%) |
| Rural | 41 (6.8%) | 561 (93.2%) | 608 (50.25%) |
| Respondent’s occupation | |||
| Government employed | 16 (3.8%) | 408 (96.2%) | 697 (57.60%) |
| Housewife | 377 (57.1%) | 283 (42.9%) | 412 (34.05%) |
| NGO | 12 (48.0%) | 13 (52.0%) | 69 (5.70%) |
| Merchant/self-employed | 21 (30.9%) | 47 (69.1%) | 20 (1.65%) |
| Students | 13 (40.6%) | 20 (60.3%) | 33 (2.73%) |
| Spouse’s occupation | |||
| Government employed | 3 (0.8%) | 389 (99.2%) | 392 (32.59%) |
| Farmer/housewife | 140 (51.5%) | 132 (48.5%) | 272 (22.52%) |
| NGO employee | 9 (13.01%) | 60 (86.99%) | 69 (5.74%) |
| Merchant/self-employed | 231 (58.6%) | 163 (41.4%) | 394 (32.61%) |
| Student | 1(25%) | 3 (75%) | 4 (0.25%) |
| Others | 64 (87.7%) | 9 (12.3%) | 73 (6.07%) |
| Respondent’s education | |||
| No formal education | 332 (72.2%) | 128 (27.8%) | 468 (38.68%) |
| Primary education | 90 (48.4%) | 96 (51.6%) | 187 (15.45%) |
| Secondary education | 9 (5.5%) | 156 (94.5%) | 165 (13.64%) |
| College and above | 9 (2.3%) | 390 (97.7%) | 390 (32.23%) |
Table 2
Summary statistics of ANC service utilization of the study participants by socioeconomic variables in the Kembata Tembaro zone, Southern Ethiopia, 2022.
| SOCIOECONOMIC VARIABLES | TOTAL NUMBER IN EACH CATEGORY | ANC UTILIZATION |
|---|---|---|
| Community subgroups | ||
| Golden hand subgroups | 440 | 56 (12.73%) |
| Non-golden hand subgroups | 770 | 629 (81.69%) |
| Wealth index | ||
| 1st quintile | 182 | 42 (23.08%) |
| 2nd quintile | 126 | 22 (17.46%) |
| 3rd quintile | 171 | 67 (39.18%) |
| 4th quintile | 215 | 121 (56.28%) |
| 5th quintile | 516 | 433 (83.91%) |
| Residence | ||
| Urban | 602 | 503 (83.55%) |
| Rural | 608 | 182 (29.93%) |
| Respondent’s occupation | ||
| Housewife | 660 | 247 (37.42%) |
| Government employed | 424 | 365 (86.08%) |
| Merchant/self-employed | 68 | 44 (64.71%) |
| NGO | 25 | 11 (44.00%) |
| Students | 33 | 18 (54.55%) |
| Respondent’s education | ||
| No formal education | 460 | 121 (26.30%) |
| Primary education | 186 | 69 (37.10%) |
| Secondary education | 165 | 149 (90.30%) |
| College and above | 399 | 346 (86.72%) |
Table 3
Rate-ratio (rich/poor), concentration indices, standard error, and p-value for maternal and reproductive health services in Kembata Tembaro, Southern Ethiopia, 2021.
| INDICATORS | RATE-RATIO (RICH/POOR) | COMBINED CONCENTRATION INDEX (CI) | STANDARD ERROR | P-VALUE | DIFFERENCE IN CI BETWEEN GOLDEN HAND AND OTHERS | P-VALUE FOR TEST OF STATISTICALLY SIGNIFICANT DIFFERENCE (HO: — DIFFERENCE = 0 IF p > 0.05) |
|---|---|---|---|---|---|---|
| ANC service utilization* | 3.64 | 0.29 | 0.014 | 0.001 | 0.09 | 0.0001 |
| Good knowledge of ANC service* | 4.02 | 0.15 | 0.015 | 0.001 | 0.15 | 0.001 |
| Positive attitude toward ANC service | 2.11 | 0.04 | 0.02 | 0.030 | -0.01 | 0.884 |
[i] * Indicates significant at p < 0.05.
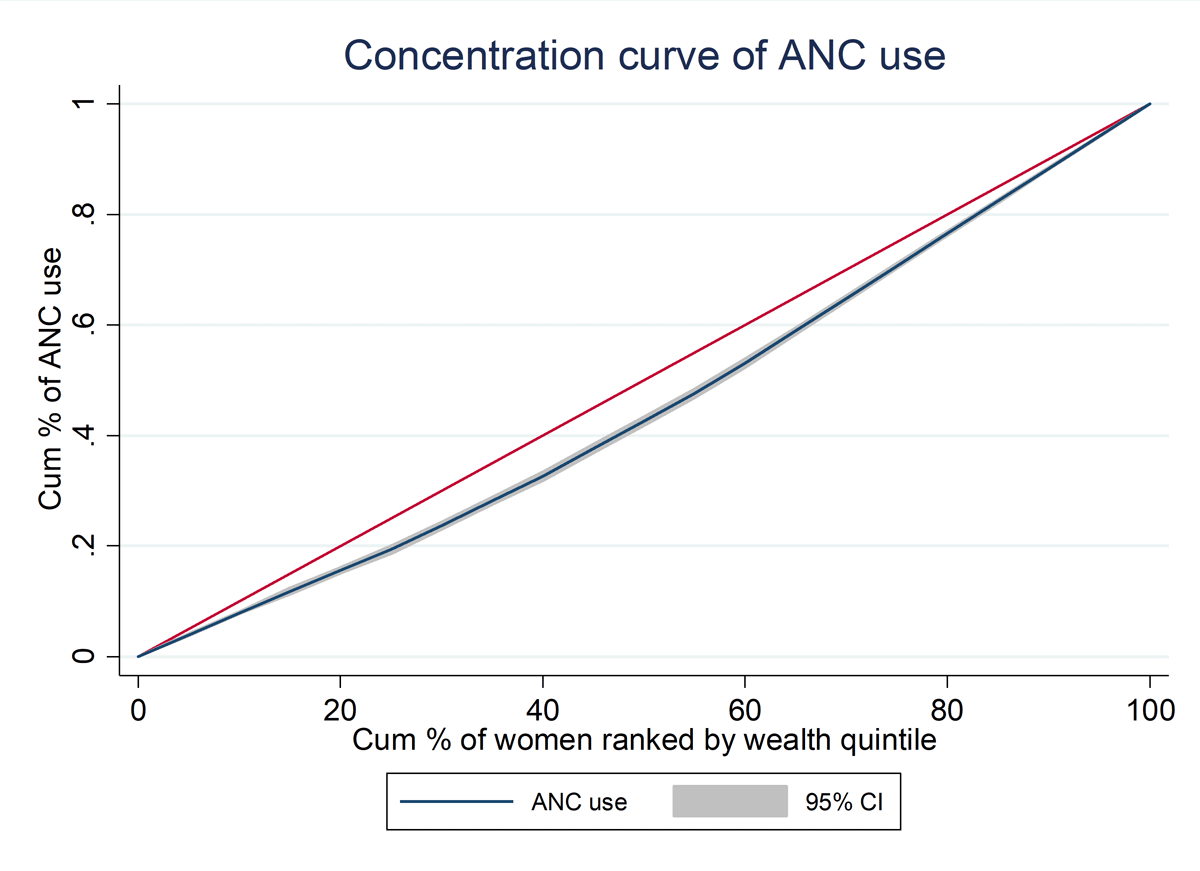
Figure 1
Concentration curve of ANC utilization by wealth quantiles between golden hand and non-golden hand women in the Kembata Tembaro zone, 2021.
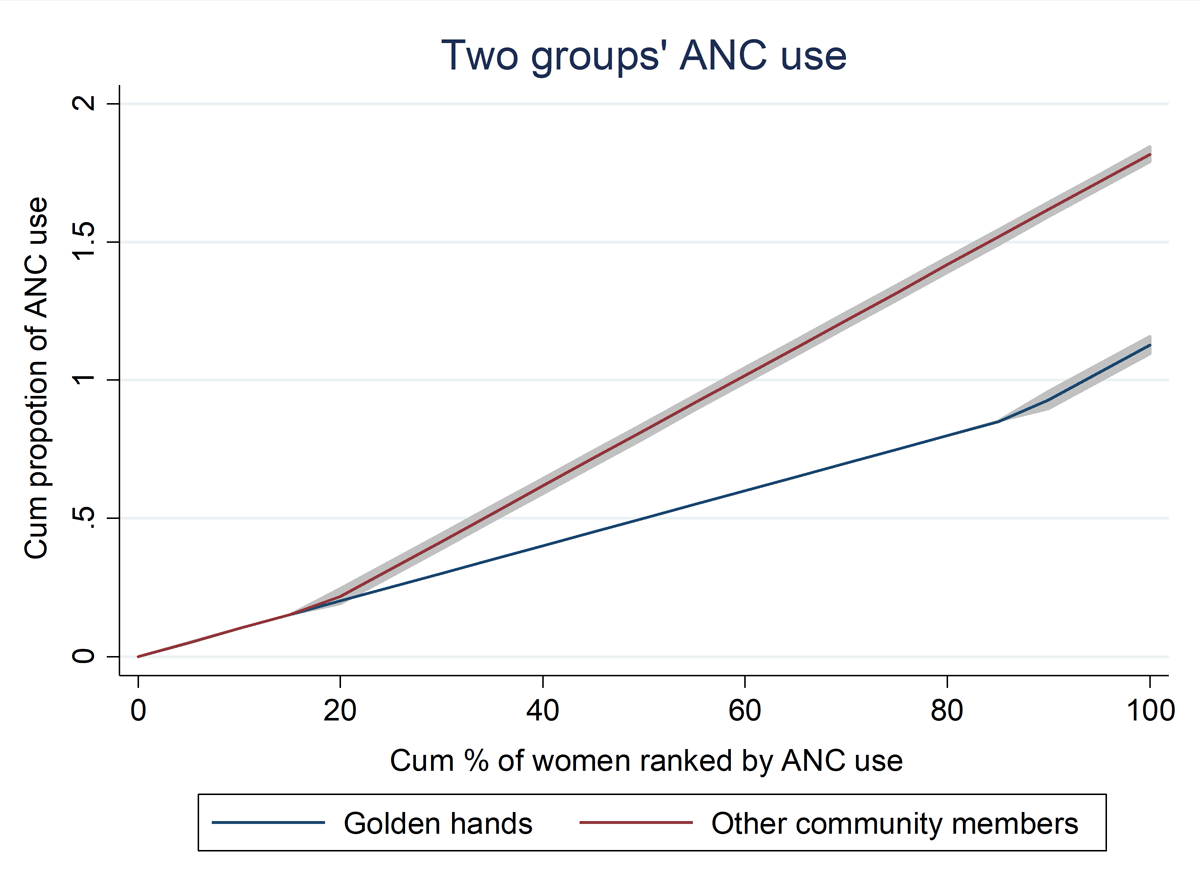
Figure 2
Generalized Lorenz curve showing inequality in ANC service utilization between golden hand and non-golden hand women in the Kembata Tembaro zone, 2021.
Table 4
Overall logistic multivariate decomposition analysis of ANC service utilization in the Kembata Tembaro zone, Southern Ethiopia, 2021.
| DECOMPOSITION | ANTENATAL CARE (ANC) | |
|---|---|---|
| COEFFICIENT | PCT | |
| Endowments (E) | 0.27 (0.17, 0.36)* | 39.47 |
| Coefficients (C) | 0.41 (0.31, 0.52)** | 60.23 |
| Gap (E+C) | 0.68 (0.65, 0.72)* | 100 |
[i] Note: * p < 0.05, ** p < 0.01.