
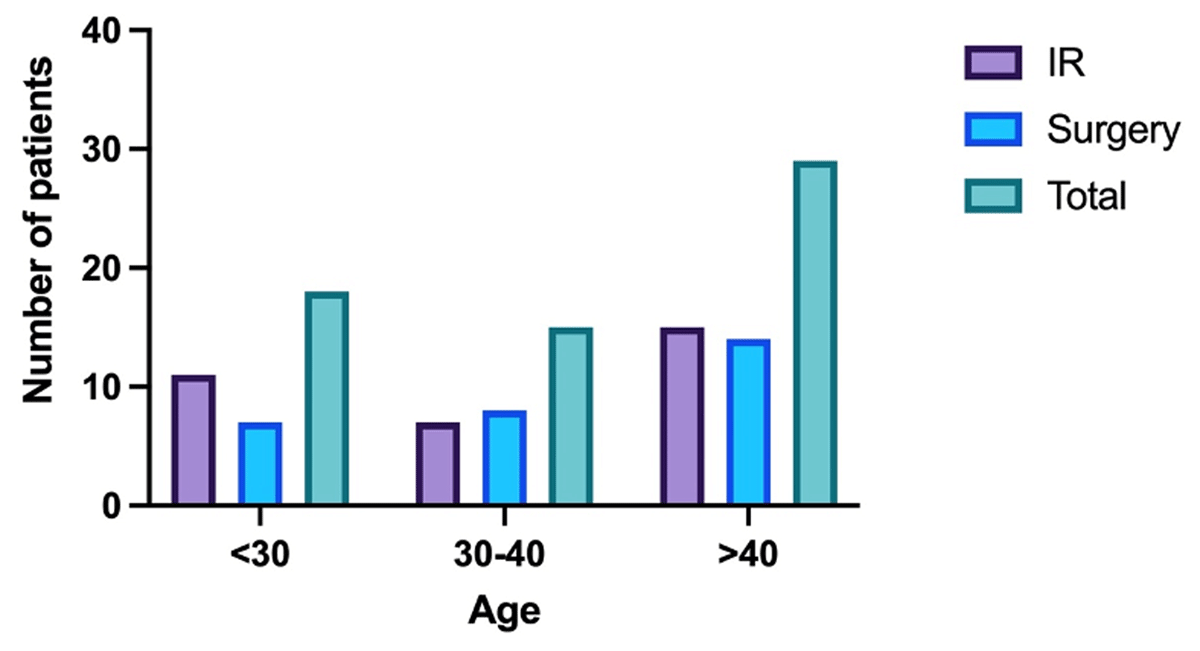
Figure 1
Summary of number of patients and Treatment type in different age groups.
Table 1
Demographics of the PAD and SAD groups (sex and age).
| OVERALL [N (%)]/[MEAN (SD)] | PAD [N (%)]/[MEAN (SD)] | SAD [N (%)]/[MEAN (SD)] | P-VALUE | |
|---|---|---|---|---|
| Sex | ||||
| Male | 40 (63.5) | 21 (65.6) | 19 (61.3) | 0.050 |
| Female | 23 (36.5) | 11 (34.4) | 12 (38.7) | |
| Age (years) | 40.8 (19.5) | 39.5 (21.5) | 42.1 (17.6) | 0.128 |
Table 2
Baseline disease presentation of the PAD and SAD groups (abscess volume, level of care, and leukocyte count).
| OVERALL [N (%)]/[MEAN (SD)] | PAD [N (%)]/[MEAN (SD)] | SAD [N (%)]/[MEAN (SD)] | P-VALUE | |
|---|---|---|---|---|
| Abscess Volume (mL) | ||||
| <500 | 24 (38.1) | 21 (65.6) | 3 (9.7) | <0.001 |
| 500 – 1000 | 27 (42.9) | 9 (28.1) | 18 (58.1) | |
| >1000 | 12 (19.0) | 2 (6.3) | 10 (32.3) | |
| Level of Care | ||||
| Inpatient | 51 (81.0) | 20 (62.5) | 31 (100.0) | <0.001 |
| Outpatient | 12 (19.0) | 12 (37.5) | 0 (0.0) | |
| WBC (Thousands) | 12.80 (6.37) | 11.18 (6.10) | 14.48 (6.30) | 0.039 |
Table 3
Clinical outcomes of patients in the PAD and SAD groups (technical success, complications, and leukocytosis).
| OVERALL [N (%)]/[MEAN (SD)] | PAD [N (%)]/[MEAN (SD)] | SAD [N (%)]/[MEAN (SD)] | P-VALUE | |
|---|---|---|---|---|
| Technical Success | ||||
| Yes | 52 (82.5) | 32 (100.0) | 20 (64.5) | <0.001 |
| No | 11 (17.5) | 0 (0.0) | 11 (35.5) | |
| Complications | ||||
| Death | 10 (15.9) | 0 (0.0) | 10 (32.3) | <0.001 |
| Major Therapy | 1 (1.6) | 0 (0.0) | 1 (3.2) | |
| Leukocytosis (72 hrs.) | ||||
| Yes | 13 (20.6) | 0 (0.0) | 13 (41.9) | <0.01 |
| No | 50 (79.4) | 32 (100.0) | 18 (58.1) | |