
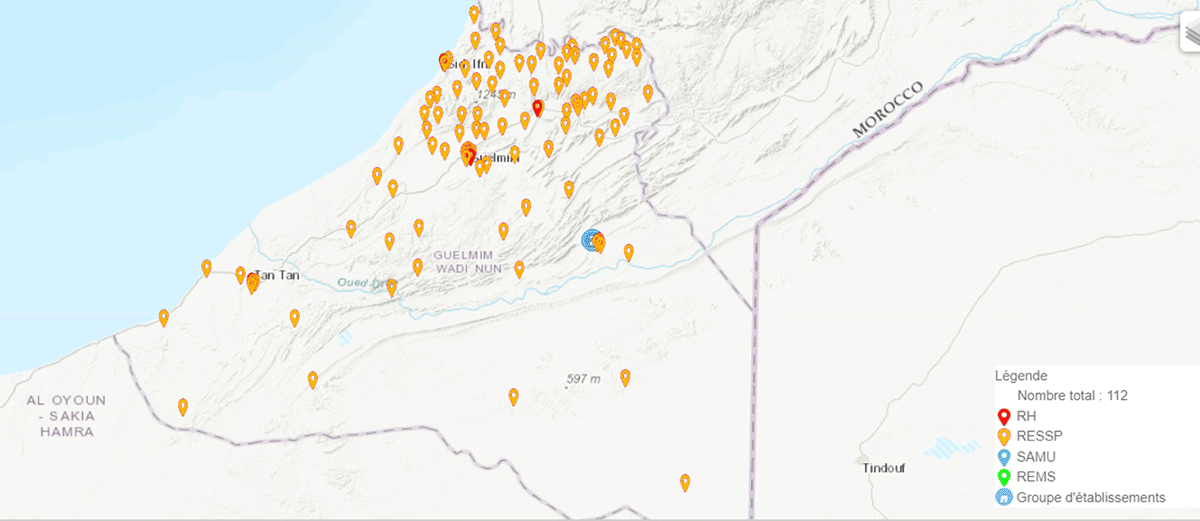
Figure 1
Healthcare facilities in the region Guelmim Oued Noun.
Source: Ministery of health and social protection, Morocco.
Table 1
Variables Approaching Transportation Factors.
| GROUPE 2: | VARIABLES | REFERENCES | |
|---|---|---|---|
| Transportations Factors | Travel Distance Km: (Continuous) | The length covered between two points or locations during a journey or transportation activity, specifically between residence areas and healthcare facilities. It is typically measured in units such as miles or kilometers | [31] [44] [45] [4647] |
| Availability of transportation: (Liker scale of 5 points) | The extent or degree to which various modes of transportation are accessible and ready for use within the region, measured by a Likert scale. | ||
| Number of Transportation Modes: (Discrete) | The count or quantity of different modes of transportation available for use within a given system or network in the region of Guelmim Oued Noun | ||
| Cost of Transportation (MAD): (Continous) | The monetary expense associated with utilizing various modes of transportation for reaching healthcare facilities. | ||
| Waiting Time (min) (Continuous) | The amount of time an outpatient spends waiting for and anticipating the arrival of transportation mode | ||
Table 2
Sample Characteristic (n = 328).
| VARIABLES | CATEGORY | COUNT (N = 328) | FREQUENCY (%) | |
|---|---|---|---|---|
| Gender | Female | 173 | 52.7% | |
| Male | 155 | 47.3% | ||
| Age (Years) Median | [Q1; Q3] | 37 [28–52 years] | ||
| Size Household Median | [Q1; Q3] | 4 [3–6 persons] | ||
| Matrimonial Status | Single | 89 | 27.1% | |
| Divorced | 14 | 4.3% | ||
| Married | 199 | 60.7% | ||
| Widowed | 26 | 7.9% | ||
| Level of instruction | Analphabet | 88 | 26.8% | |
| Coranic school | 45 | 13.7% | ||
| Primary school | 68 | 20.7% | ||
| Secondary school | 74 | 22.6% | ||
| University | 53 | 16.2% | ||
| Employment Status | Employed | 85 | 25.9% | |
| Not employed | 243 | 74.1% | ||
| Residence Area | Suburban | 26 | 8.0% | |
| Rural | 162 | 49.5% | ||
| Urban | 139 | 42.5% | ||
| Medical Coverage | Obligatory insurance Disease | 35 | 10.7% | |
| Others | 18 | 5.5% | ||
| Private insurance | 14 | 4.3% | ||
| MASSEU [26] | 173 | 52.7% | ||
| Without | 88 | 26.8% | ||
| Monthly Income | Without | 46 | 14.0% | |
| Less than 2000 Dhs | 156 | 47.6% | ||
| 2000–3000 Dhs | 45 | 13.7% | ||
| 3000–5000 Dhs | 59 | 18.0% | ||
| More than 5000 Dhs | 22 | 6.7% | ||
| Level life Perception | Very low | 28 | 8.6% | |
| Low | 76 | 23.3% | ||
| Average | 180 | 55.2% | ||
| Good | 42 | 12.9% | ||
| Percieved Difficulty accessing transportation | Yes | 184 | 56.1% | |
| No | 144 | 43.9% | ||
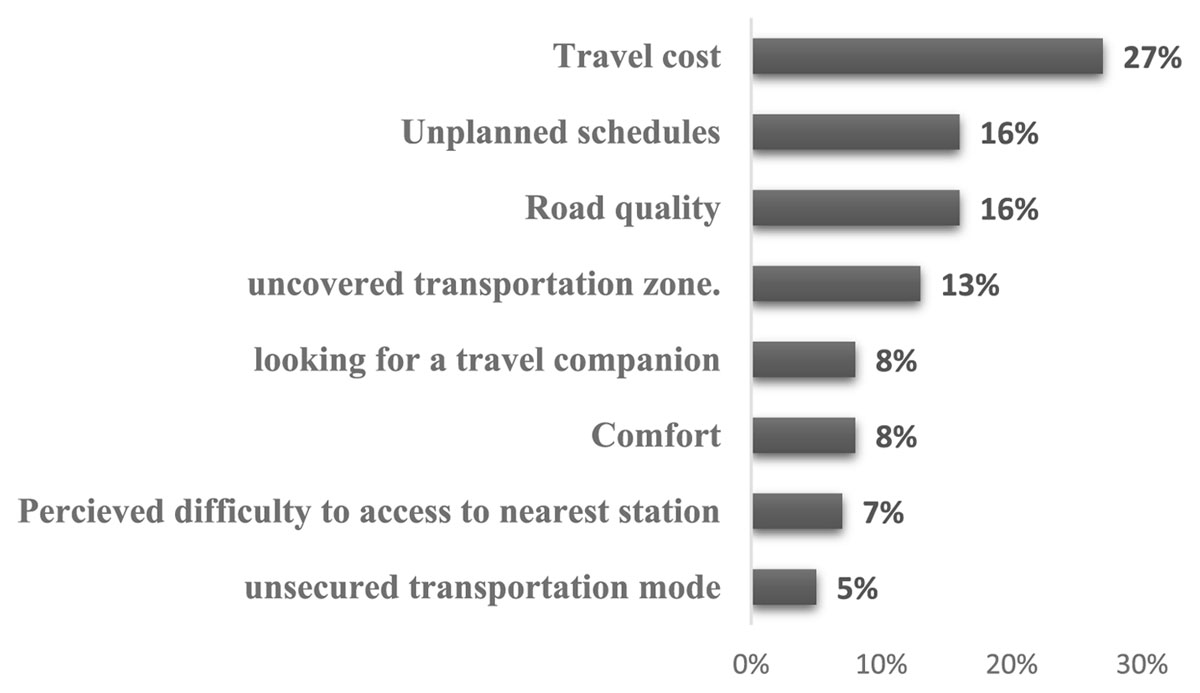
Figure 2
Transportation barriers most experienced by outpatients.
Table 3
Matrix Correlation Between Transportation Related Barriers and Access to Healthcare Facilities.
| VARIABLES | Y1 | Y2 | X1 | X2 | X3 | X4 | X5 | X6 |
|---|---|---|---|---|---|---|---|---|
| Difficult to access to healthcare services (Y1) | 1 | |||||||
| Number of medical visits (Y2) | 0.07 | 1 | ||||||
| Mode of transportation (X1) | 0.07 | 0.25 | 1 | |||||
| Number of mode of transportation (X2) | 0.32*** | 0.17*** | 0.045*** | 1 | ||||
| Waitin time (X3) | –0.09 | –0.06 | 0.07 | –0.11** | 1 | |||
| Level of availability of transportation (X4) | –0.08 | –0.07 | –0.07 | –0.16*** | 0.04 | 1 | ||
| Travel cost (X5) | 0.22 *** | 0.21*** | 0.04*** | 0.42*** | –0.01 | –0.21*** | 1 | |
| Distance (X6) | 0.03 | –0.03 | 0 | 0.28*** | –0.01 | –0.06 | 0.35 | 1 |
[i] P < 0.05: * (significant at the 0.05 level) ; P < 0.01: ** (significant at the 0.01 level); P < 0.001: *** (significant at the 0.001 level).
Table 4
Multivariate Tests of Significance.
| TEST NAME | VALUE | APPROX.F | HYPOTHESIS DEGREES OF FREEDOM | ERROR DEGREES OF FREEDOM | SIGNIFICANCE OF F |
|---|---|---|---|---|---|
| Pillai’s | 0.36555 | 11.96549 | 12 | 642 | 0.000 |
| Hotelling’s | 0.46450 | 13.34791 | 12 | 638 | 0.000 |
| Wilks | 0.66320 | 12.15701 | 12 | 640 | 0.000 |
| Roys | 0.25103 |
[i] Note: F statistic for WILKS ‘Lambda is exact.
Table 5
Eigenvalues and Canonical Correlation.
| TEST NAME | EIGENVALUE | % | CUMULATIVE % | CANONICAL CORRELATION | SQUARE CORRELATION |
|---|---|---|---|---|---|
| 1 | 0.33516 | 72.16 | 72.16 | 0.50 | 0.25 |
| 2 | 0.12934 | 27.84 | 100 | 0.34 | 0.14 |
Table 6
Dimension Reduction Analysis.
| ROOTS | WILKS L | F | HYPOTHESIS DEGREES OF FREEDOM | ERROR DEGREES OF FREEDOM | SIGNIFICANCE OF F |
|---|---|---|---|---|---|
| 1 to 2 | 0.66320 | 12.15701 | 12 | 640 | 0.000 |
| 2 to 2 | 0.88548 | 8.30333 | 5 | 321 | 0.000 |
Table 7
Correlations Between Access to Healthcare Facilities and Canonical Variables.
| ACCESS TO HEALTHCARE FACILITIES | FUNCTION 1 | FUNCTION 2 |
|---|---|---|
| Percieved Difficulty Access to healthcare services during the pandemic of Covid-19. | 0.97796 | –0.20879 |
| Number of medical visits during the last 12 months. | 0.33726 | 0.94141 |
Table 8
Correlations Between Transportation Barriers and Canonical Variables.
| COVARIATE | FUNCTION 1 | FUNCTION 2 |
|---|---|---|
| Mode of Transportation | 0.26784 | 0.63414 |
| Number of Transportations | 0.89116 | 0.05492 |
| Time Waiting Transportation | –0.39614 | 0.02546 |
| Availability of Transportation | –0.39671 | 0.34929 |
| Affordability (Cost) | 0.60584 | 0.33303 |
| Distance from Nearest Stop | 0.29650 | –0.25829 |