
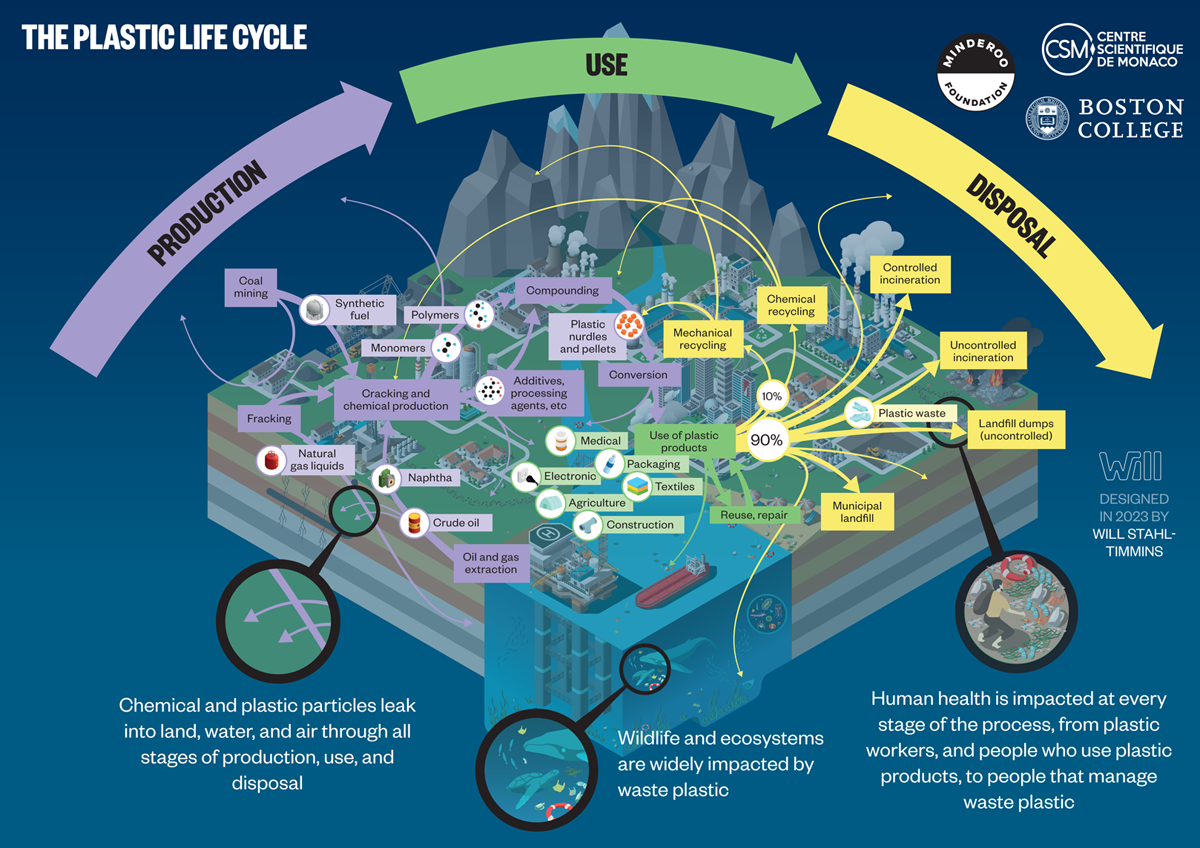
Figure 2.1
The plastic life cycle. The plastic life cycle is long and complex spanning multiple countries. There are three major phases. During production, carbon feedstocks – derived 99% from coal, oil and gas – are transformed through energy-intensive, catalytic processes into a vast array of products. Plastic is used in virtually every aspect of modern life and has provided many benefits. Single-use plastic constitutes the largest market share followed by synthetic fibers, building and construction, transport, electrical, agriculture and medical. Recycling is minimal. Disposal involves landfilling as well as controlled and uncontrolled burning. Plastic-laden e-waste is particularly problematic. Transnational environmental leakage of chemicals and plastic waste occurs throughout the life cycle resulting in extensive pollution and health hazards.
Credit: Designed in 2022 by Will Stahl-Timmins.

Figure 2.2
Throwaway Living – Disposable items cut down household chores. A family tossing single-use products through the air illustrating how society has turned into a disposable society with throwaway products, New York, NY, July 7 1955 (Life Magazine August 1st, 1955).
Credit: Peter Stackpole/The LIFE Picture Collection/Shutterstock.
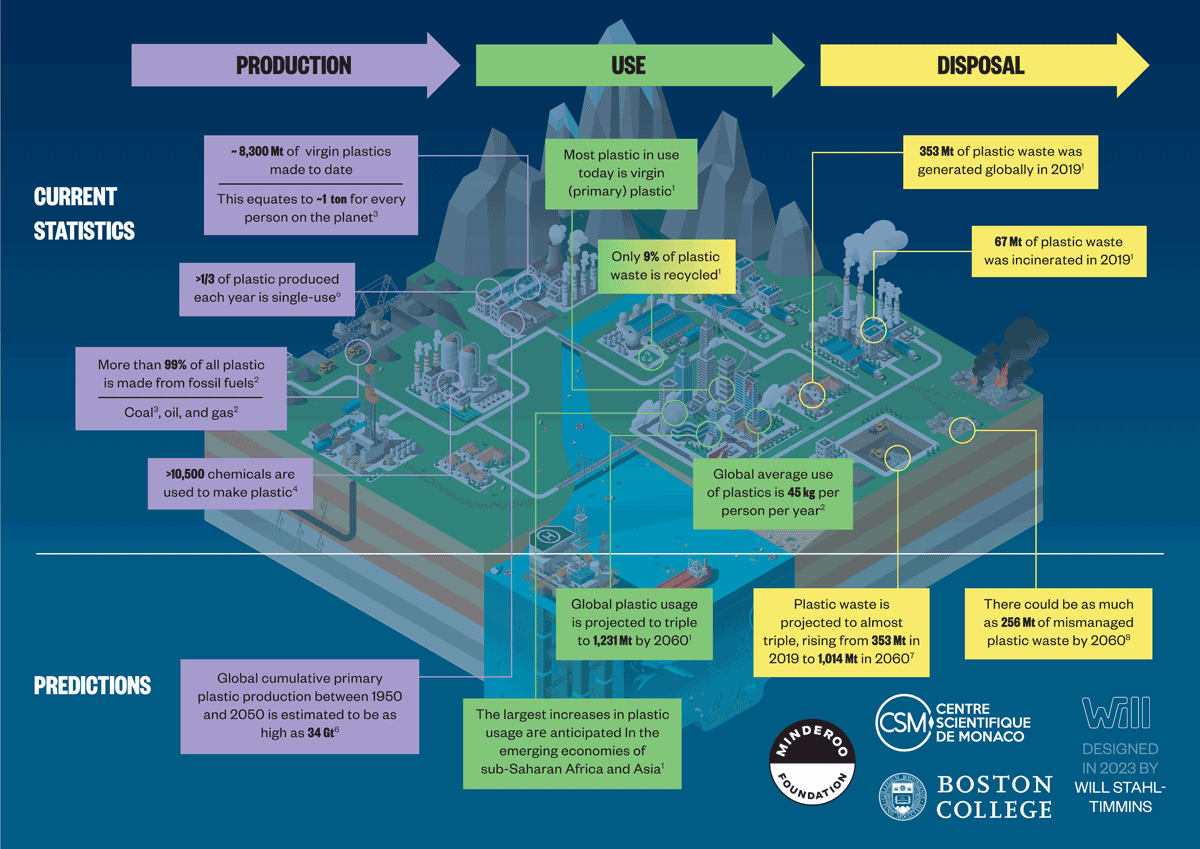
Figure 2.3
Plastic life cycle: Production and market predictions. Large volumes of plastic have been made since production started in 1950s with continuing predicted increases. Mt, Megatons; Gt, Gigatons. References: [1](Organisation for Economic Co-operation and Development (OECD), 2022a); [2](European Environment Agency (EEA), 2021); [3](Cabernard et al., 2022); [4](Wiesinger, Wang and Hellweg, 2021); [5](Charles, Kimman and Saran, 2021); [6](Geyer, 2020); [7](Organisation for Economic Co-operation and Development (OECD), 2022b); [8](Lebreton and Andrady, 2019).
Credit: Designed in 2022 by Will Stahl-Timmins.
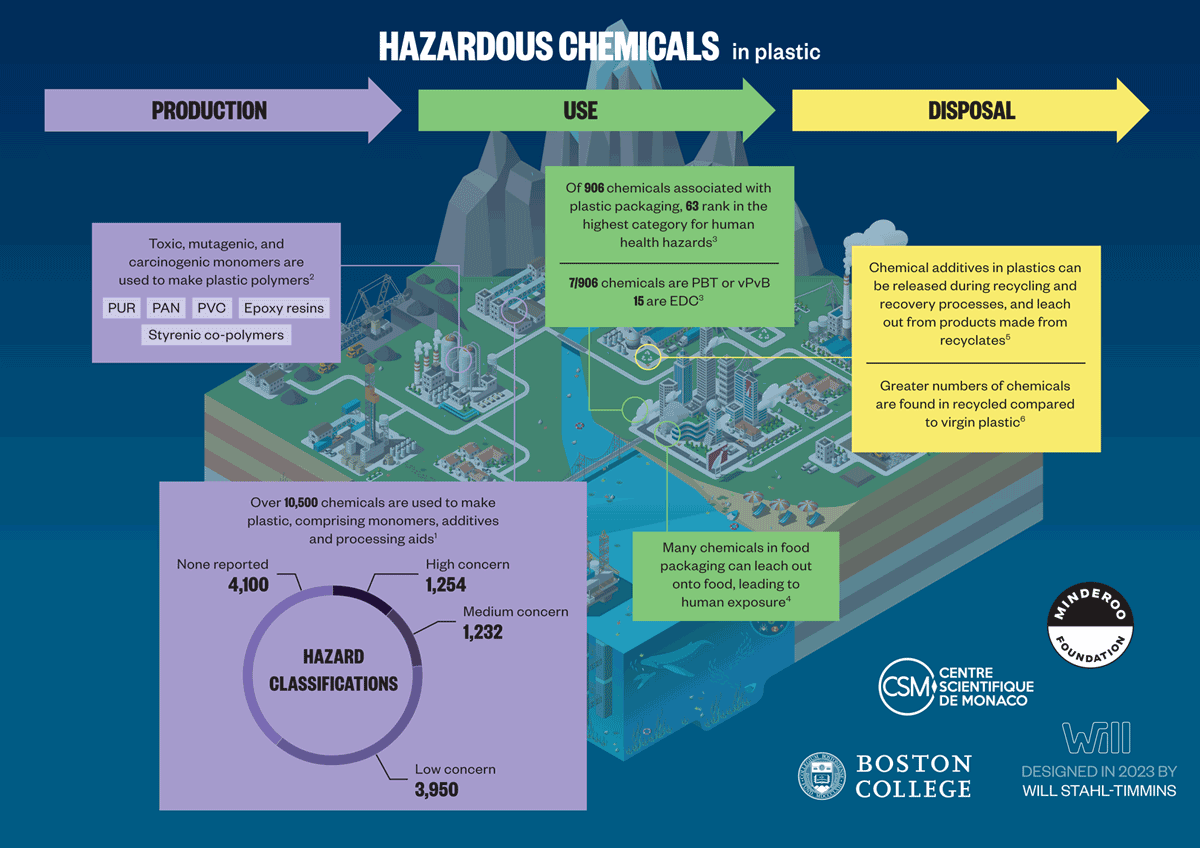
Figure 2.4
A multitude of hazardous chemicals are used, present, and released across all stages of the plastic life cycle. PUR, polyurethane; PAN, polyacrylonitrile; PVC, polyvinyl chloride; PBT, persistent, bioaccumulative and toxic; vPvB, very persistent/very bioaccumulative; EDCs, endocrine disrupting chemicals. References: [1](Wiesinger, Wang and Hellweg, 2021); [2](Lithner, Larsson and Dave, 2011); [3](Groh et al., 2019); [4](Food Packaging Forum Foundation, 2022); [5](Hahladakis et al., 2018); [6](Lowe et al., 2021).
Credit: Designed in 2022 by Will Stahl-Timmins.
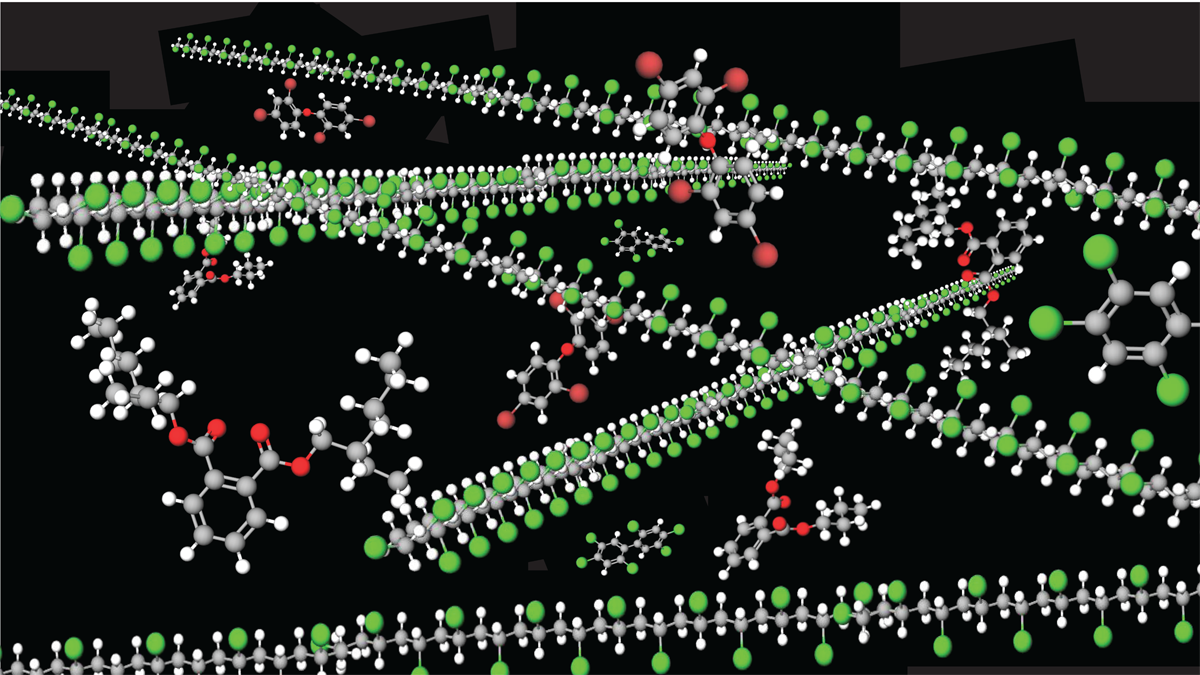
Figure 2.5
Plastic is a complex chemical mixture of inter-twined polymers comprising multiple monomeric units joined by carbon-carbon bonds and multiple chemicals added to enhance production and impart properties such as flexibility, strength and durability. Straight chains are polyvinyl chloride (PVC) polymers. Additives depicted are di(2-ethylhexyl) phthalate (DEHP), di-n-butyl phthalate (DnBP), a polybrominated diphenyl ether congener (PBDE-47) and a polychlorinated biphenyl congener (PCB-153).
Credit: Manuel Brunner, co-author.
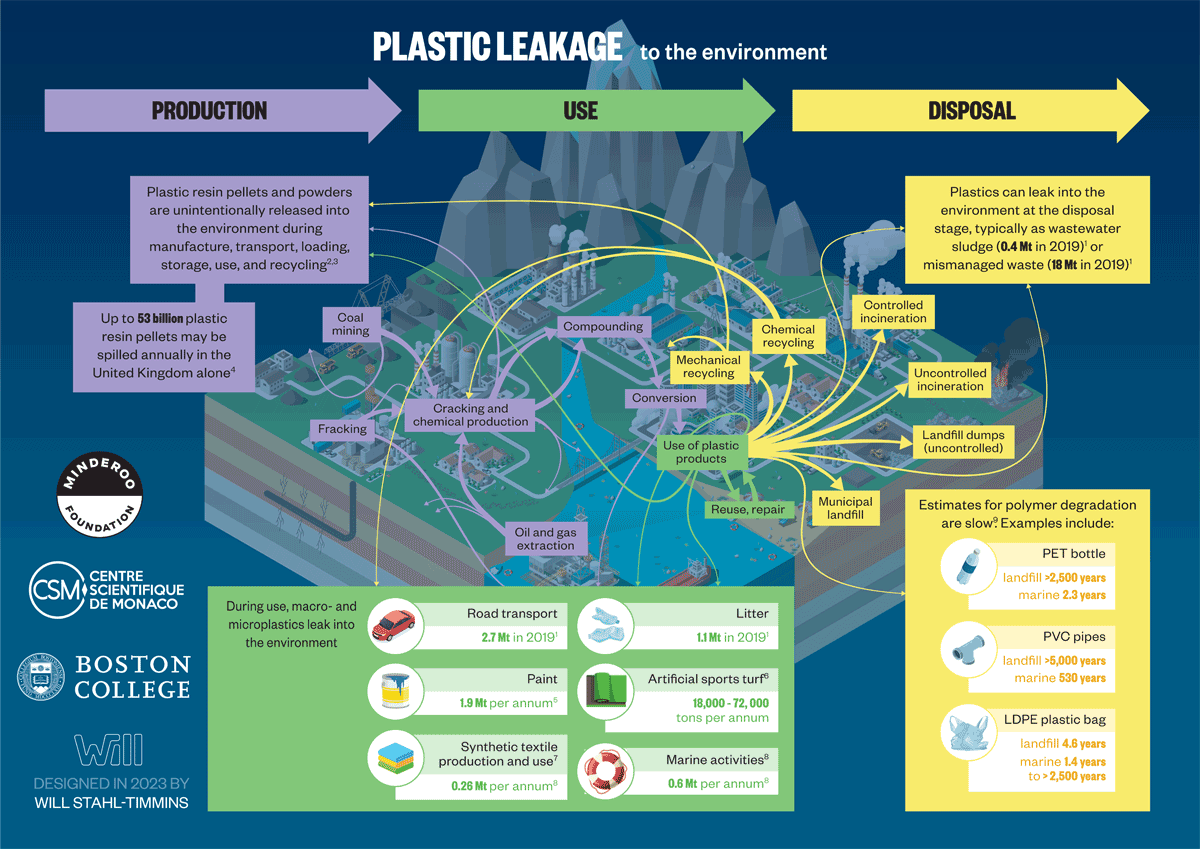
Figure 2.6
Plastic life cycle: Plastic leakage. Plastic and plastic-associated chemicals leak into the environment across all stages of the plastic life cycle. Chemical-laden macroplastics constitute the bulk of plastic leakage. Plastic polymers can take many years to degrade in the environment with the rate of degradation depending on many factors such as temperature, light and mechanical action.[9] Mt, Megatons; PET, polyethylene terephthalate; PVC, polyvinyl chloride;LDPE, low-density polyethylene. References: [1](Organisation for Economic Co-operation and Development (OECD), 2022a); [2](Karlsson et al., 2018); [3](Organisation for Economic Co-operation and Development (OECD), 2021); [4](Cole and Sherrington, 2016); [5](Paruta, Pucino and Boucher, 2022); [6](Hann et al., 2018); [7](Periyasamy and Tehrani-Bagha, 2022); [8](Ryberg, Laurent and Hauschild, 2018); [9](Chamas et al., 2020).
Credit: Designed in 2022 by Will Stahl-Timmins.
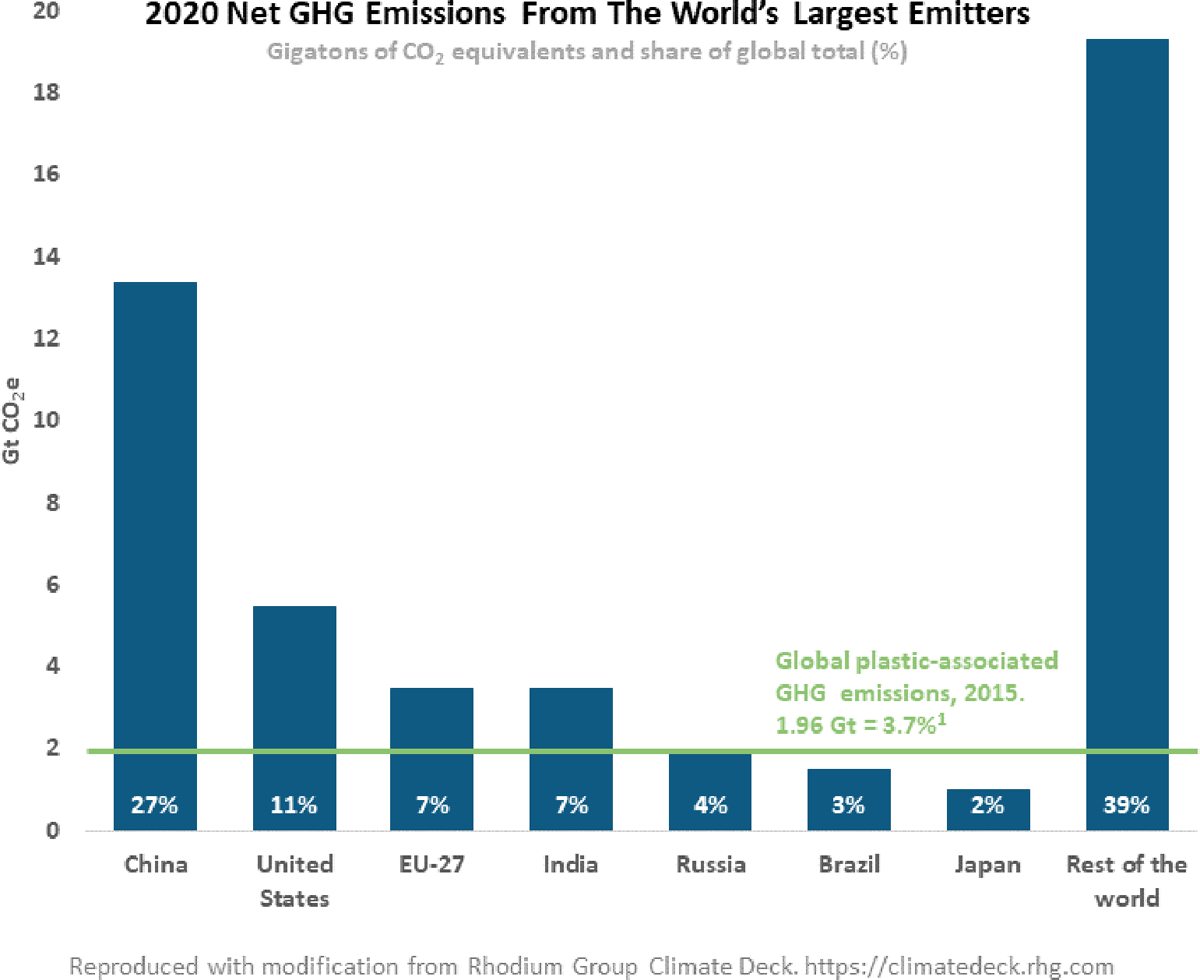
Figure 2.7
2020 net greenhouse gas (GHG) emissions from the world’s largest emitters. Gigatons (Gt) of carbon dioxide equivalents (CO2e), including land use, land-use change and forestry, and share of global total (%). In 2015, the annual emissions of CO2 and other greenhouse gas from plastics production was 1.96 Gt of CO2e, or 3.7% of total emissions (Cabernard et al., 2022)[1].
Source & Permissions: Adapted from Rhodium Group ClimateDeck.
https://rhg.com/research/preliminary-2020-global-greenhouse-gas-emissions-estimates/
Table 3.1
Estimates of the amounts of plastic debris floating at the ocean surface. Global estimates range from 0.09% to 12% of the 4.8–12.7 million metric tons of plastic waste estimated to enter the ocean in [24] Regarding debris size, most plastics collected in plankton nets are millimeters in size or smaller, although many studies do not report particle size distribution. Here, “nominal” refers to all plastic debris collected in plankton nets, the majority of which is likely to be microplastic (<5 mm in size).
| ESTIMATED MASS | MEASUREMENT METHOD | DEBRIS SIZE | REGION(# MEASUREMENTS) | STUDY |
|---|---|---|---|---|
| 1,100 tons | Plankton net(0.335 mm mesh) | Microplastic (nominal) | Western North Atlantic Ocean (6,136) | (Law et al., 2010) [600] |
| 21,290 tons | Plankton net(0.335 mm mesh) | Microplastic (nominal) | Eastern North and South Pacific Ocean (2,529) | (Law et al., 2014) [607] |
| 6,350–31,750 tons | Plankton nets(0.2 mm–1 mm mesh) | Microplastic (nominal) | Global (3,070) | (Cózar et al., 2014) [601] |
| 66,140 tons | Plankton net(0.33 mm mesh) | 0.33–200 mm | Global (680) | (Eriksen et al., 2014) [602] |
| 202,800 tons | Visual survey transects | >200 mm | Global (891) | (Eriksen et al., 2014) [602] |
| 93,000–236,000 tons | Plankton nets(0.15–3 mm mesh) | Microplastic (nominal) | Global (11,854) | (van Sebille et al., 2015) [1561] |
| 82,000–578,000 tons | Plankton nets & filtered continuous seawater intake(0.1–0.3 mm mesh) | Microplastic (nominal) | Global (8,209) | (Isobe et al., 2021) [541] |
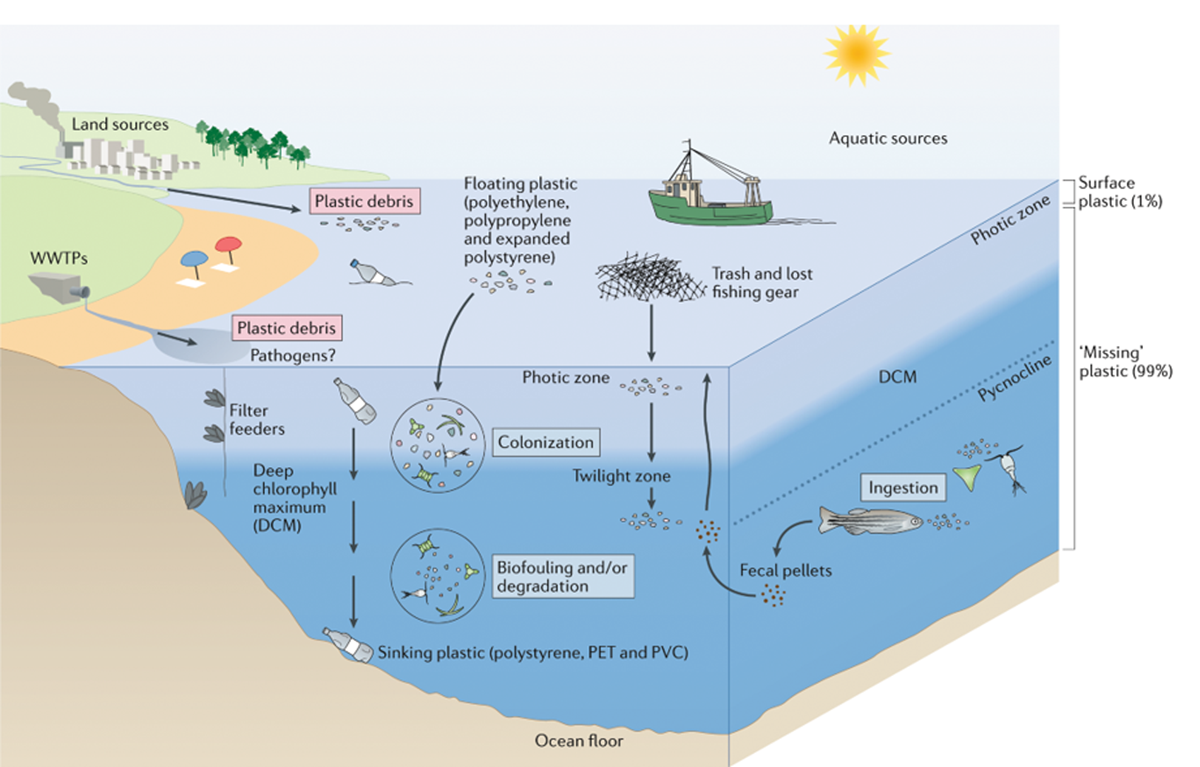
Figure 3.1
Fate of plastic debris in the environment. Diagram illustrating many of the possible pathways over the lifecycle of plastic litter on its journey from land to sea. Plastic debris enters the ocean through both aquatic (rivers, accidental escape at sea) and land-based sources (littering, escape from municipal waste management such as wastewater treatment plants (WWTPs)). Depending on the density of the plastic material, plastic items will remain afloat for a given part of their lifecycle or, as they become weighted down by biofouling, will begin to sink into the water column, ultimately to the ocean bottom. Changes in biofouling with depth may lead to depth oscillations (not shown) before particles end up on the seafloor (Kooi et al., 2017; Rummel et al., 2017; Royer et al., 2021). Mechanical, photochemical and biological forces break down plastic debris into microplastics and nanoplastics that subsequently become incorporated into the marine food web. Organisms such as filter feeders may further concentrate these smaller particles, given their capacity to filter large volumes of water. Microorganisms begin to attach, colonizing plastic in the water within hours, and can include potentially harmful microorganisms, such as disease-causing pathogens. PET, polyethylene terephthalate; PVC, polyvinyl chloride. Figure reproduced from (Amaral-Zettler, Zettler and Mincer, 2020) [641], with permission from Springer Nature and the Copyright Clearance Center. The reproduced figure is not part of the open access license governing the current paper.
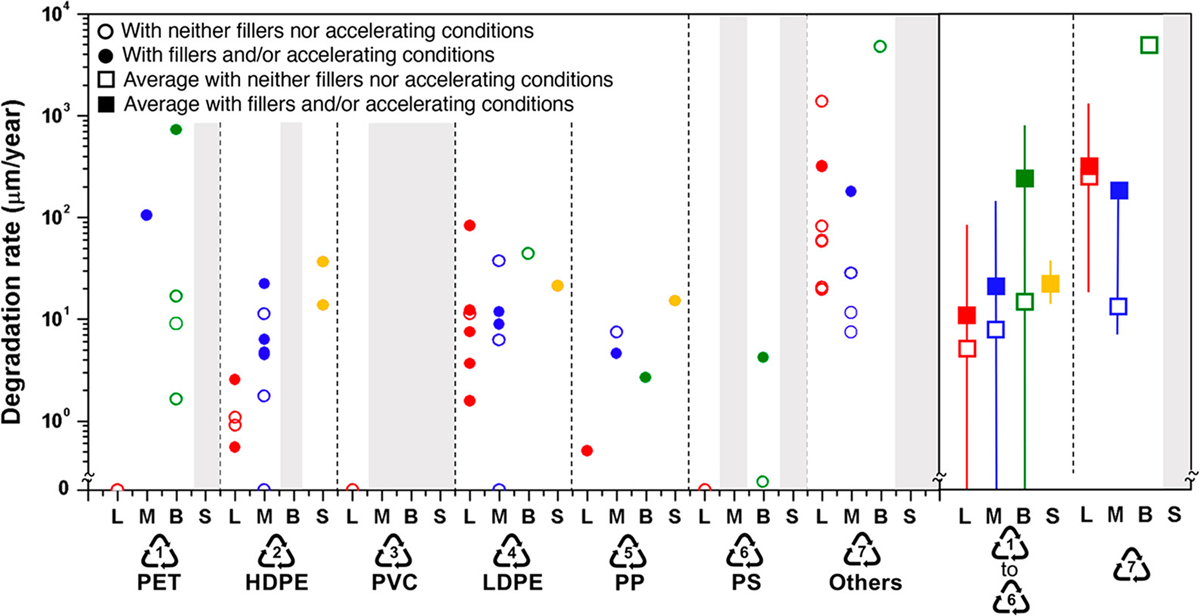
Figure 3.2
Degradation rates for various plastics. “Vertical columns represent different environmental conditions (L, landfill/compost/soil; M, marine; B, biological; S, sunlight) and plastic types (represented by their resin identification codes). Plastics type 7, “others”, corresponds to various nominally biodegradable plastics. The range and average value for plastic types 1–6 are shown on the right as lines and squares, respectively, as well as for biodegradable “others”. Data points representing degradation rates that were unmeasurably slow are shown on the x-axis. Gray columns represent combinations for which no data were found.” PET, polyethylene terephthalate; HDPE, high-density polyethylene; PVC, polyvinyl chloride; LDPE, low-density polyethylene; PP, polypropylene; PS, polystyrene. Figure caption and figure reprinted with permission from (Chamas et al., 2020) [240] (CC BY 4.0).
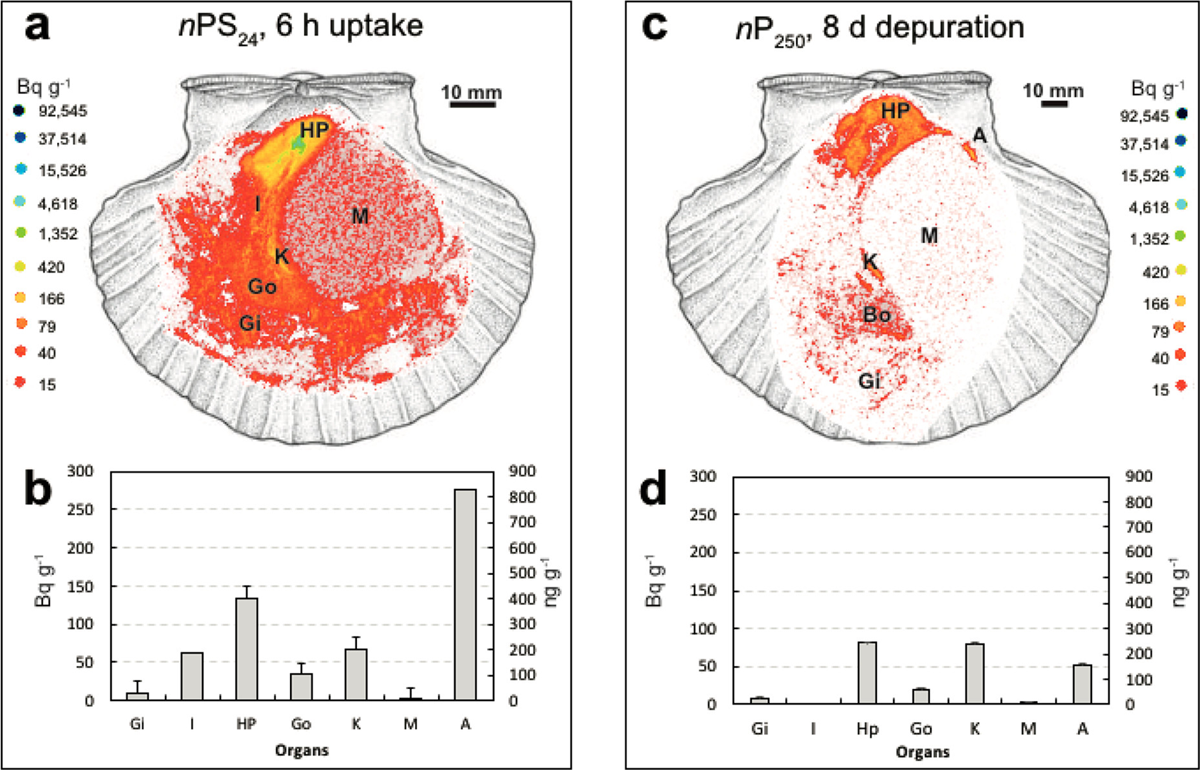
Figure 3.3
Uptake and depuration of 24 nm polystyrene nanoparticles. (a) Tissue distributions shown by Quantitative Whole Body Autoradiography (QWBA) in Pecten maximus after 6 h uptake with (b) quantification of radioactivity levels measured in tissues (left axis; Bq g–1, S/Nnorm; right axis ng g–1), (c) Tissue distributions shown by QWBA in Pecten maximus after 8 days of depuration, with (d) quantification after 8 days of depuration (left axis Bq g–1, S/Nnorm; right axis, ng g–1). Each bar represents the mean value measured in 3–6 different sections of a given individual. No bar = radioactivity < LOD. nPS24 and nP250 are spherical polystyrene nanoparticles with sizes of approximately 24 ± 13 and 248 ± 21 nm respectively. HP, Hepatopancreas; Gi, Gills; Go, Gonad; I, Intestine; K, Kidney; M, Muscle; A, Anus. Figure caption and figure reprinted from (Al-Sid-Cheikh et al., 2018) [764] (CC BY 4.0).
Table 3.2
Estimates of microplastics consumption (annual particle intake per capita) from seafood versus other sources. Numbers represent average or ranges of annual intake (particle numbers) per capita. For additional discussion of human exposure, see (Ramsperger et al., 2022) [1198] and (Lusher and Covernton, 2022) [790].
| (DANOPOULOS ET AL., 2020) [786] | (CATARINO ET AL., 2018) [802] | (VAN CAUWENBERGHE AND JANSSEN, 2014) [767] | (HANTORO ET AL., 2019) [784] | (BARBOZA ET AL., 2020) [785] | (COX ET AL., 2019) [783] | (DOMENECH AND MARCOS, 2021) [788] | (ZHANG ET AL., 2020) [1562] | |
|---|---|---|---|---|---|---|---|---|
| mollusks | 2,067(0–27,825) | 123–4,620 | 1,800–11,000 | 500–32,750 | ||||
| Crustaceans | 206–17,716 | 322–19,511 | ||||||
| Shellfish | 0–1.3 × 10⁴ | |||||||
| Fish | 31–8,323 | 25–32,375 | 112–3,078 | |||||
| Total seafood | 17,448 | 22,000 | ||||||
| Fruits & vegetables | 19 × 109 | |||||||
| Bottled water | 15,156 | 2.61 × 10³–3.96 × 10¹⁰ | ||||||
| Tap water | 3,358 | 0–4.7 × 10³ | ||||||
| Total water | 0–2.8 × 10¹⁰ | |||||||
| Salt | 86 | 261 | 0–7.3 × 10⁴ | |||||
| Alcohol | 294 | 26 | ||||||
| Honey | 73 | |||||||
| Sugar | 8,319 | |||||||
| Dust ingestion | 100–1.9 × 10⁴ | |||||||
| Air (inhaled) | 46,501 | 2,160 | ||||||
| Indoor air | 1.9 × 10³–1 × 10⁵ | |||||||
| Outdoor air | 0–3 × 10⁷ |
Table 3.3
List of anthropogenic organic chemicals found adsorbed to plastic pellets. *Representative references only. ** Higher brominated diphenyl ethers such as PBDE-209 excluded, because of possible contribution of additives compounded to pellets.*** “Drins” such as aldrin, dieldrin included.**** Potential contribution of additives compounded to pellets, especially sporadically high concentrations.
| NAME OF CHEMICAL(S) | ABBREVIATIONS (WHERE APPLICABLE) | REFERENCES* |
|---|---|---|
| Polychlorinated biphenyls | PCBs | (Ogata et al., 2009 [1316]; Taniguchi et al., 2016 [1563]; Camacho et al., 2019 [1564]; Yamashita et al., 2019 [819]; Arias et al., 2023 [1565]) |
| Polybrominated diphenyl ethers** | PBDEs | (Taniguchi et al., 2016 [1563]; Camacho et al., 2019 [1564]; Pozo et al., 2020 [1566]; Ohgaki et al., 2021 [1567]) |
| Polycyclic aromatic hydrocarbons | PAHs | (Taniguchi et al., 2016 [1563]; Yeo et al., 2017 [1568]; Camacho et al., 2019 [1564]; Arias et al., 2023 [1565]) |
| Dichlorodipheyltrichloroethane and its metabolites | DDTs | (Ogata et al., 2009 [1316]; Taniguchi et al., 2016 [1563]; Camacho et al., 2019 [1564]; Pozo et al., 2020 [1566]; Arias et al., 2023 [1565]) |
| Hexachlorocyclohexanes | HCHs | (Ogata et al., 2009 [1316]; Taniguchi et al., 2016 [1563]; Camacho et al., 2019 [1564]; Pozo et al., 2020 [1566]; Arias et al., 2023 [1565]) |
| Cyclodiene pesticides*** | (Taniguchi et al., 2016 [1563]; Camacho et al., 2019 [1564]) | |
| Chlordanes | (Taniguchi et al., 2016 [1563]) | |
| Mirex | (Taniguchi et al., 2016 [1563]; Camacho et al., 2019 [1564]) | |
| Hexachlorobenzene | HCB | (Taniguchi et al., 2016 [1563]; Camacho et al., 2019 [1564]; Pozo et al., 2020 [1566]) |
| Pentachlorobenzene | PeCB | (Pozo et al., 2020 [1566]) |
| Benzotriazole-type UV stabilizers**** | BUVSs | (Camacho et al., 2019 [1564]; Karlsson et al., 2021 [1569]) |
| Organophosphorus flame retardants**** | OPFRs | (Camacho et al., 2019 [1564]) |
| Triclosan**** | H. Takada, personal communication | |
| Sterols | H. Takada, personal communication | |
| Hopanes | (Alidoust et al., 2021 [1570]) |
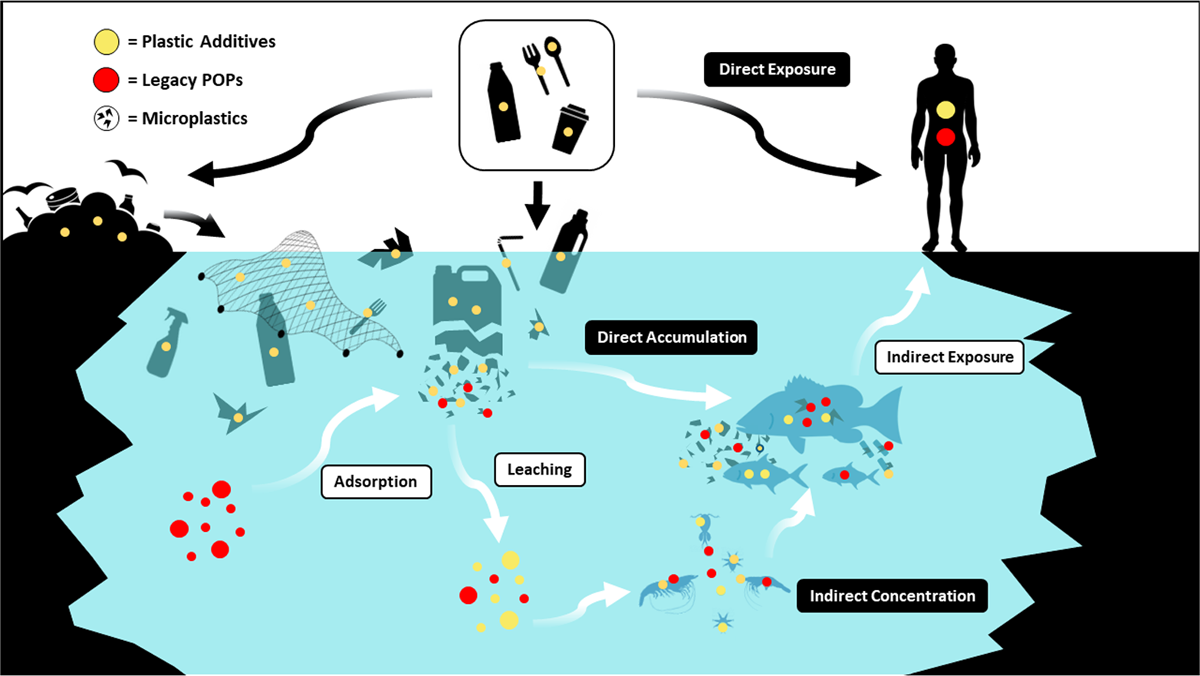
Figure 3.4
Conceptual model of microplastic-mediated transfer of additives and POPs to marine animals and humans. Conceptual model of microplastic-mediated transfer of additives and persistent organic pollutants (POPs) persistent to marine animals and humans. Plastic additives and legacy POPs accumulate in the ocean through leaching from waste virgin and recycled plastic; similarly, microplastics, which also contain additives, accumulate as a result of fragmentation. Plastic additives and legacy POPs can be adsorbed to microplastics. Humans can be directly exposed to plastic additives and legacy POPs from use of plastic products as well as indirectly via the food chain. Human exposure to microplastics via the food chain may also occur.
Credit: Shige Takada and Manuel Brunner (co-authors).
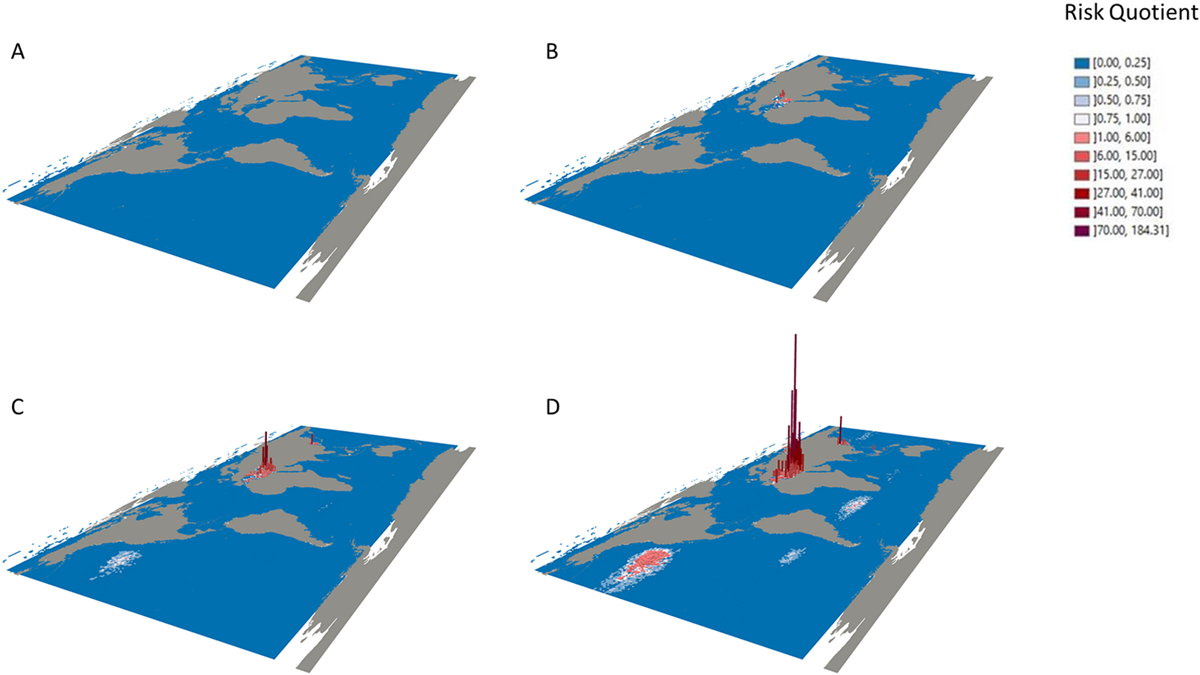
Figure 3.5
Global risks of microplastic pollution based on worst case scenario (unacceptable level (PNEC) = 7.99 *103 MP m–3) displayed in a four-panel plot, in which each panel corresponded to a specific year: 1970 (A), 2010 (B), 2050 (C), and 2100 (D). Cell specific (1° by 1°) risk estimates were calculated, and a 3D visualization of the data was generated. The risk estimates were represented in 3D as elevation values. As long as the risk quotient remains lower than the value of 1 (bluish tones), policy makers consider no risk due to MPs. In case that the risk quotient exceeds the value of 1 (reddish tones), there is a risk. Figure reproduced from (Everaert et al., 2020) [904] (CC BY-NC-ND 4.0).
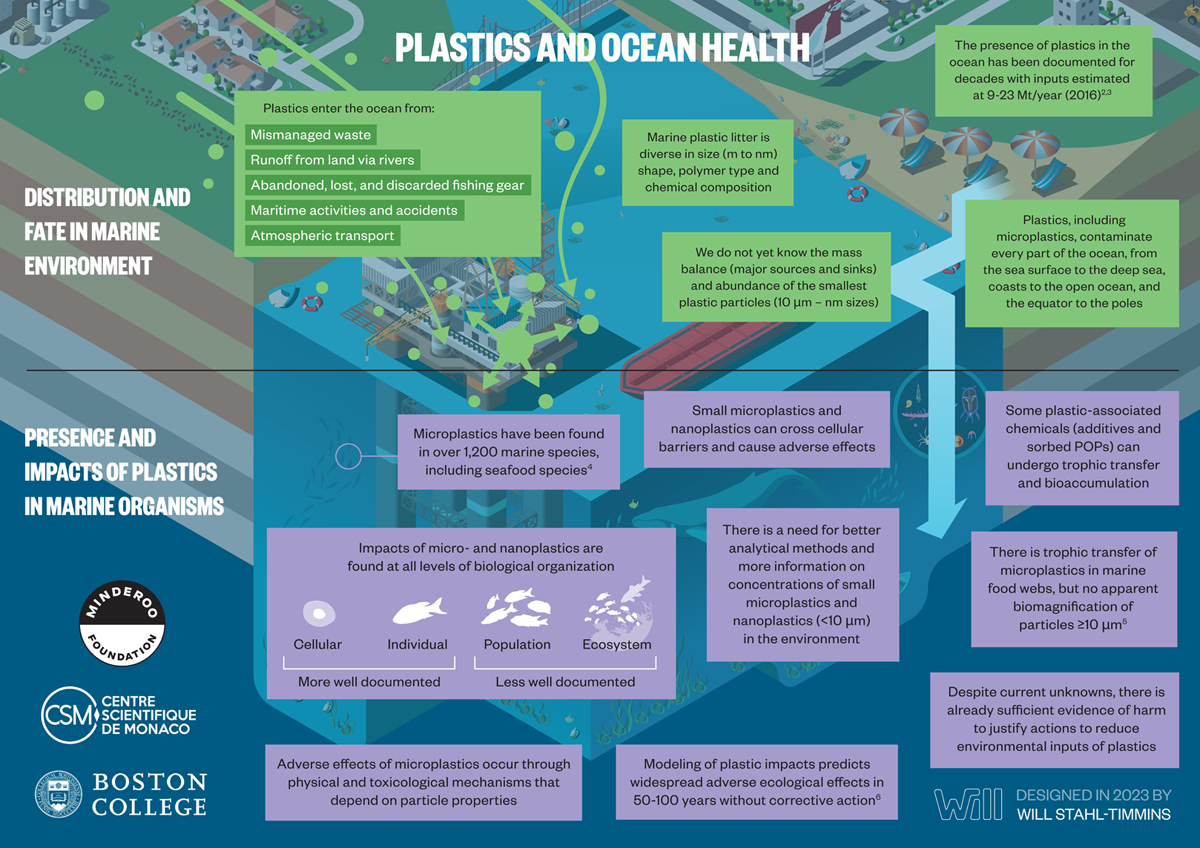
Figure 3.6
Distribution, fate, and impacts of plastics in the ocean. Plastics enter aquatic environments (marine and freshwater), undergo processes that determine their distribution and fate, and impact organisms and ecosystems in a variety of ways. Mt, Megatons; POPs, persistent organic pollutants. References: [1](Rochman et al., 2019); [2](Lau et al., 2020); [3](Borrelle et al., 2020); [4](Santos, Machovsky-Capuska and Andrades, 2021); [5](Pitt, Aluru and Hahn, 2023); [6](Everaert et al., 2020).
Credit: Designed in 2022 by Will Stahl-Timmins.
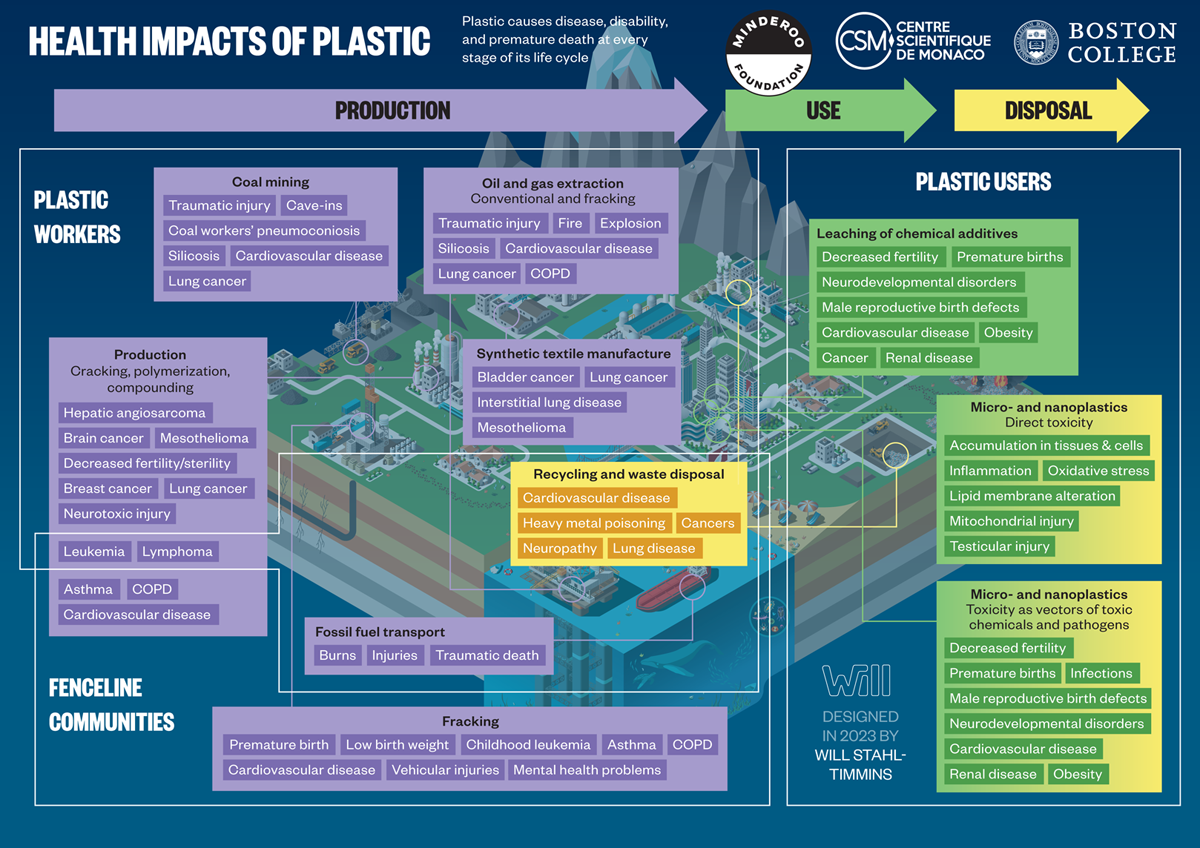
Figure 4.1
Health impacts of plastic. Plastic threatens and harms human health at every stage of its life cycle. COPD is chronic obstructive pulmonary disease.
Credit: Designed in 2022 by Will Stahl-Timmins.
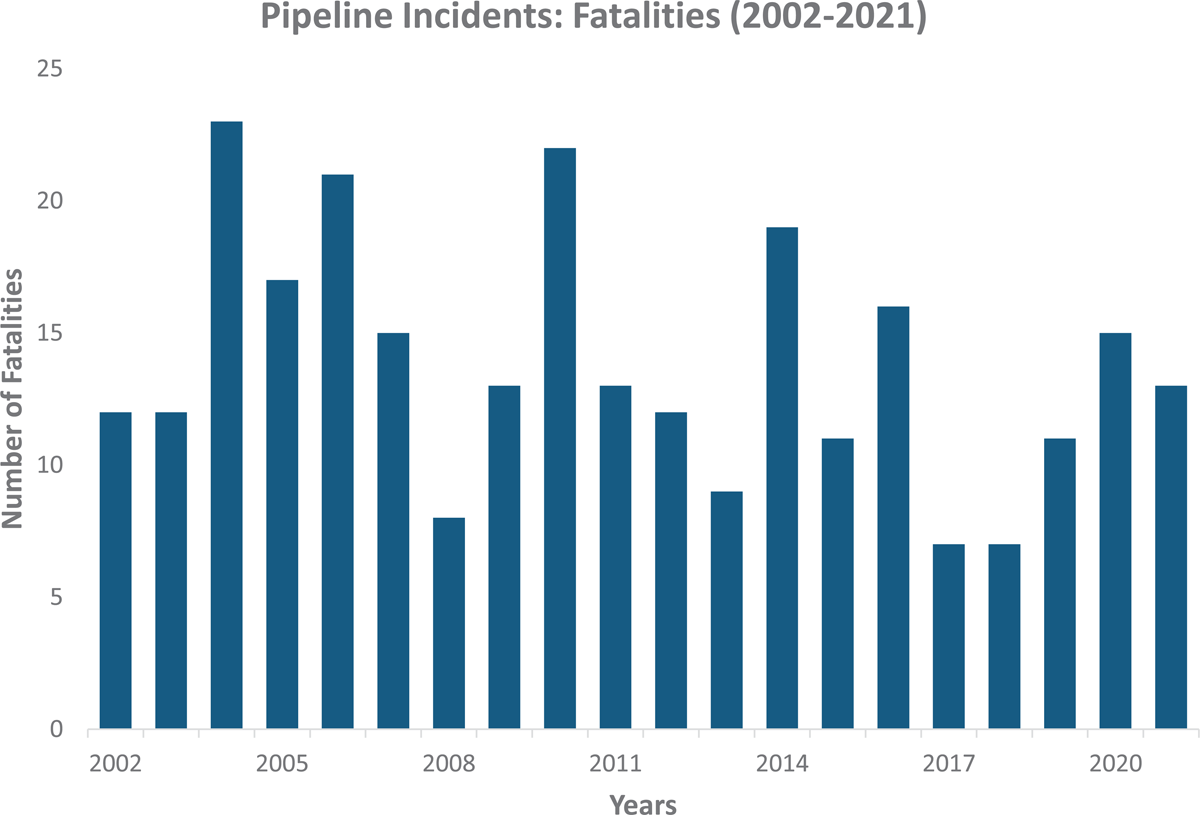
Figure 4.2
Fatalities caused by pipeline incidents.
Permission: Pipeline and Hazardous Materials Safety Administration (no date) Pipeline incident 20-year trends | phmsa. Available at: https://www.phmsa.dot.gov/data-and-statistics/pipeline/pipeline-incident-20-year-trends (Accessed: 24 October 2022).
Figure adapted from (Pipeline and Hazardous Materials Safety Administration (PHMSA), 2022) by Manuel Brunner (co-author).
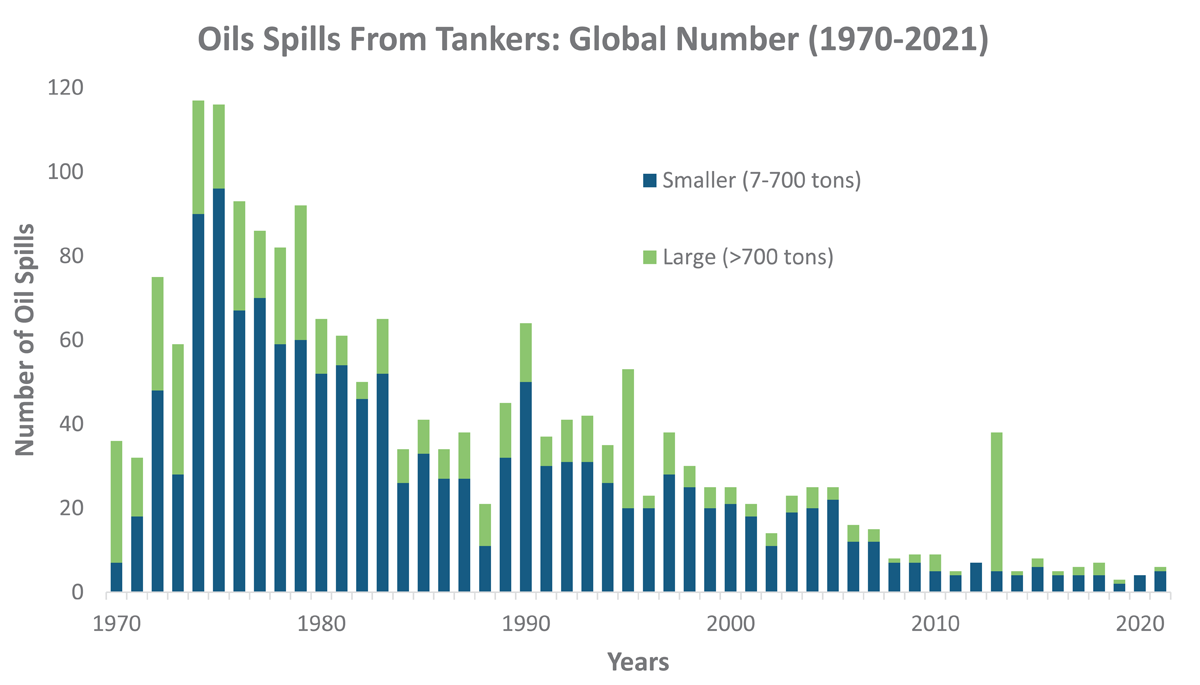
Figure 4.3
Global number of oil spills from tankers from 1970–2021.
Permissions: no special permissions needed. Roser, M. and Ritchie, H. (2022) ‘Oil spills’, Our World in Data [Preprint]. Available at: https://ourworldindata.org/oil-spills (Accessed: 24 October 2022) and: ITOPF (2022). Oil tanker spill statistics 2021. ITOPF Ltd, London, UK. Figure adapted by Manuel Brunner (co-author).
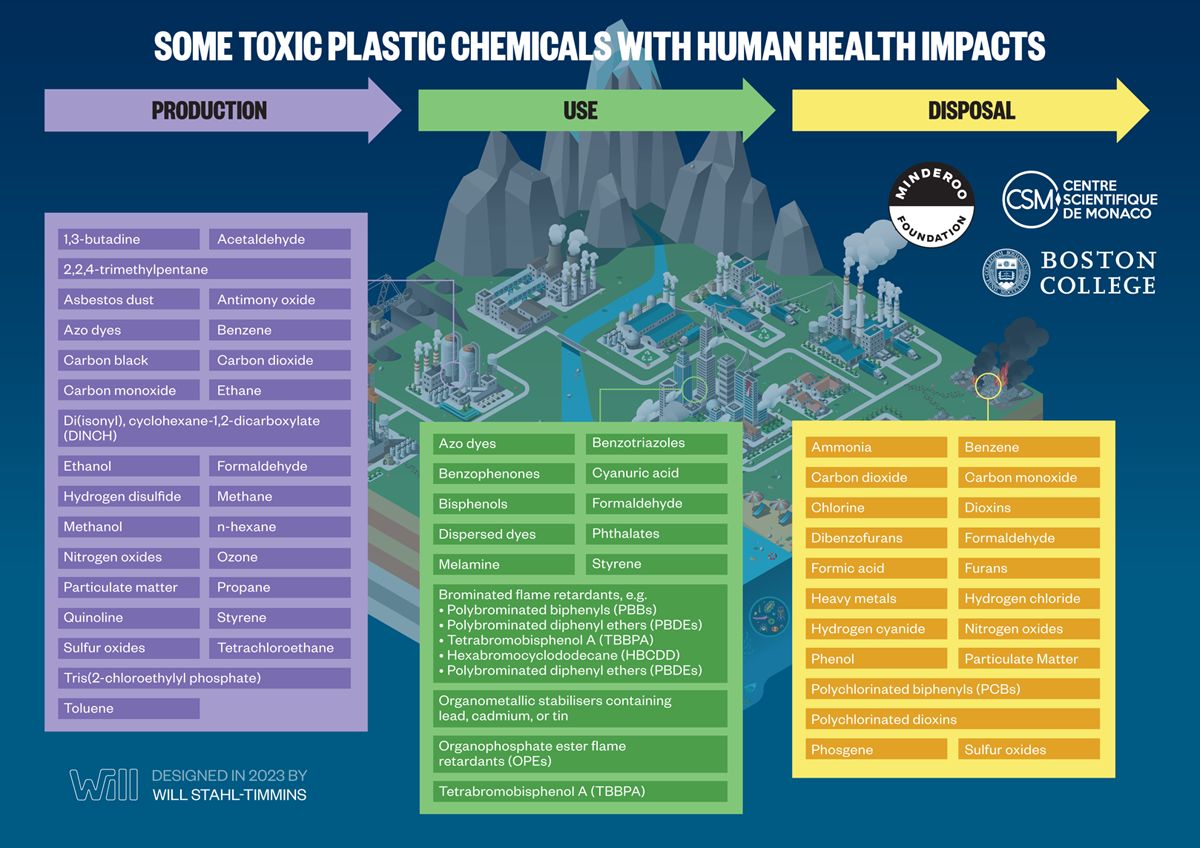
Figure 4.4
Some toxic chemicals with human health impacts. The human health impacts of the chemicals listed in each phase of the plastic life cycle are described in the text.
Credit: Designed in 2022 by Will Stahl-Timmins.
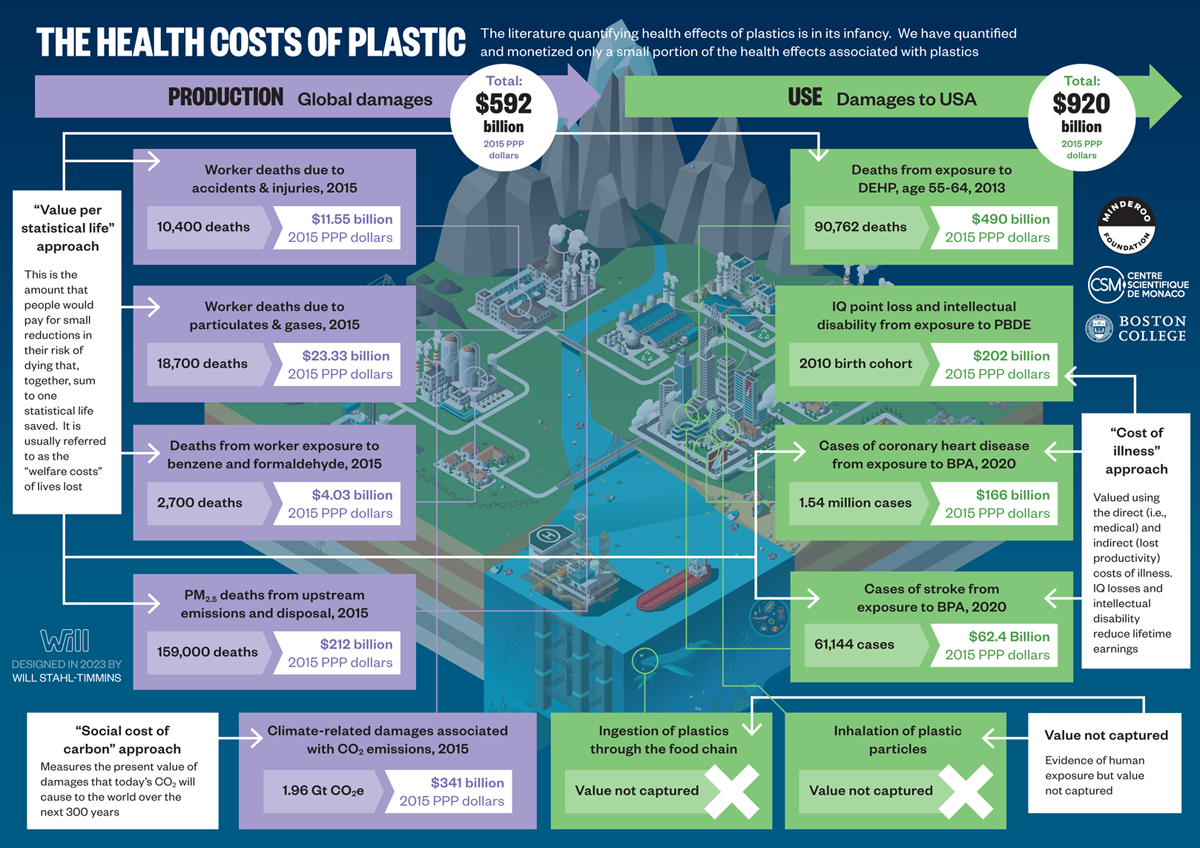
Figure 5.1
Health costs of plastic. Plastic causes significant harm to humans as well as the environment across all stages of its life cycle. Quantifying the human health disease burden and economic costs associated with plastic production, use, and disposal is a complex, and at times difficult, endeavor. Conducting high-quality epidemiological studies will greatly benefit this emerging field of research. PPP, purchasing power parity; PM2.5, particulate matter with a diameter of 2.5 micrometers or less; CO2, carbon dioxide; Gt, Gigatons; CO2e, carbon dioxide equivalent; DEHP, di(2-ethylhexyl) phthalate; PBDE, polybrominated diphenyl ether; BPA, bisphenol A.
Credit: Designed in 2022 by Will Stahl-Timmins.
Table 5.1
Global workforce in employed plastic production (unit: 1,000 Full Time Equivalents). RoW refers to rest of world.
| UPSTREAM CHAIN | RESIN PRODUCTION | MANUFACTURING | RECYCLING | INCINERA-TION | LAND-FILLING | TOTAL WORKFORCE | TOTAL (UNIT: %) | |
|---|---|---|---|---|---|---|---|---|
| EU | 4,090 | 1,184 | 755 | 199 | 73 | 28 | 6,329 | 5.79% |
| US | 1,950 | 438 | 37 | 48 | 33 | 21 | 2,527 | 2.31% |
| China | 31,300 | 11,900 | 63 | 1,090 | 8 | 45 | 44,405 | 40.65% |
| RoW Asia | 24,600 | 12,262 | 517 | 40 | 36 | 23 | 37,478 | 34.31% |
| RoW Americas | 3,527 | 2,626 | 263 | 7 | 7 | 130 | 6,560 | 6.01% |
| RoW Europe | 3,308 | 1,265 | 654 | 30 | 25 | 251 | 5,533 | 5.07% |
| RoW Africa | 4,732 | 571 | 129 | 0 | 29 | 28 | 5,490 | 5.03% |
| RoW Middle East | 668 | 232 | 7 | 0 | 4 | 6 | 917 | 0.84% |
| Total | 74,175 | 30,477 | 2,425 | 1,414 | 216 | 531 | 109,238 | 100.00% |
[i] Source: Cabernard et al., 2022 and authors’ calculations.
Table 5.2
Deaths attributable to ambient particulate matter (PM) air pollution resulting from plastics production and disposal. RoW refers to rest of world.
| ENTIRE LIFE CYCLE OF PLASTICS | DISPOSAL (DIRECT IMPACTS OF INCINERATION AND LANDFILLING) | TOTAL (UNIT: %) | |
|---|---|---|---|
| EU | 6,474 | 49 | 4.06% |
| US | 3,540 | 80 | 2.22% |
| China | 48,900 | 629 | 30.66% |
| RoW Asia | 76,512 | 59 | 47.97% |
| RoW Americas | 6,290 | 11 | 3.94% |
| RoW Europe | 4,216 | 264 | 2.64% |
| RoW Africa | 8,700 | 33 | 5.45% |
| RoW Middle East | 4,860 | 10 | 3.05% |
| Total | 159,491 | 1,134 | 100.00% |
[i] Source: Cabernard et al. (2022), Cabernard (Personal Communication, 2022) and authors’ calculations.
Table 5.3
Occupational deaths attributable to plastics production, global, 2015. PM, particulate matter; RoW, rest of world.
| BENZENE | FORMALDEHYDE | INJURIES | PM AND GASES | TOTAL | TOTAL (UNIT: %) | |
|---|---|---|---|---|---|---|
| EU | 139 | 18 | 209 | 498 | 864 | 2.71% |
| US | 96 | 12 | 114 | 261 | 483 | 1.52% |
| China | 383 | 398 | 3,939 | 10,985 | 15,705 | 49.30% |
| RoW Asia | 526 | 378 | 4,356 | 5,876 | 11,136 | 34.95% |
| RoW Americas | 249 | 90 | 601 | 421 | 1,362 | 4.27% |
| RoW Europe | 77 | 19 | 400 | 380 | 876 | 2.75% |
| RoW Africa | 143 | 85 | 713 | 258 | 1,200 | 3.77% |
| RoW Middle East | 91 | 31 | 77 | 34 | 233 | 0.73% |
| Total | 1,705 | 1,030 | 10,410 | 18,713 | 31,857 | 100.00% |
[i] Source: GBD 2016 Occupational Risk Factors Collaborators (2020) and authors’ calculations.
Table 5.4
Economic costs of deaths attributable to ambient particulate matter (PM) air pollution and occupational exposure resulting from plastics production, global, 2015. PPP, purchasing power parity; RoW, rest of world.
| VALUE OF PM DEATHS (IN 2015 PPP BILLION) | VALUE OF OCCUPATIONAL DEATHS (IN 2015 PPP BILLION) | TOTAL VALUE (2015 PPP BILLION) | TOTAL (UNIT: %) | |
|---|---|---|---|---|
| EU | 24.42 | 3.11 | 27.54 | 10.98% |
| US | 19.13 | 2.61 | 21.74 | 8.67% |
| China | 66.30 | 21.29 | 87.59 | 34.94% |
| RoW Asia | 64.94 | 8.03 | 72.98 | 29.11% |
| RoW Americas | 8.76 | 1.60 | 10.36 | 4.13% |
| RoW Europe | 8.15 | 1.32 | 9.47 | 3.78% |
| RoW Africa | 8.22 | 0.47 | 8.69 | 3.47% |
| RoW Middle East | 11.83 | 0.48 | 12.31 | 4.91% |
| Total | 211.75 | 38.92 | 250.67 | 100.00% |
[i] Source: Authors’ calculations.
Table 5.5
Economic costs of IQ Loss and intellectual disability resulting from polybrominated diphenyl ether (PBDE) exposure in EU, USA, and Canada. PPP, purchasing power parity; GDP, gross domestic product.
| GEO GROUP | SCENARIO | IQ POINTS LOST | LOST ECONOMIC PRODUCTIVITY (IN 2015 PPP BILLION $) | ATTRIBUTABLE INTELLECTUAL DISABILITY | COST OF INTELLECTUAL DISABILITY (IN 2015 PPP BILLION $) | TOTAL COSTS (IN 2015 PPP BILLION $) | TOTAL COSTS (IN % OF GDP) |
|---|---|---|---|---|---|---|---|
| EU | PBDE (base) | 837,685 | 8.30 | 3,156 | 2.75 | 11 | 0.06% |
| EU | PBDE (high) | 1,926,158 | 19.09 | 7,705 | 6.72 | 26 | 0.13% |
| USA | PBDE (base) | 9,818,493 | 145.77 | 43,268 | 56.51 | 202 | 1.11% |
| USA | PBDE (high) | 19,035,078 | 282.61 | 98,769 | 129.00 | 412 | 2.26% |
| Canada | PBDE (base) | 373,628 | 4.19 | 1,607 | 1.59 | 6 | 0.36% |
| Canada | PBDE (high) | 926,055 | 10.40 | 4,493 | 4.44 | 15 | 0.93% |
[i] Source: Honeycutt et al. (2004); Bellanger et al. (2015); Attina et al. (2016); Malits, Naidu and Trasande (2022) and authors’ calculations.
Table 5.6
Summary of disease burden and economic costs attributable to plastic production and use. CO2, carbon dioxide; PPP, purchasing power parity; PM, particulate matter; PBDE, polybrominated diphenyl ether; CHD, coronary heart disease; BPA, bisphenol A; DEHP, di(2-ethylhexyl) phthalate; CO2e, carbon dioxide equivalent; Gt, Gigatons.
| DEATHS, CASES, IQ POINTS LOST OR CO2 EMISSIONS | VALUE (IN 2015 PPP BILLION) | |
|---|---|---|
| Upstream Health Effects | ||
| Global PM deaths in 2015 | 159,491 Deaths | 211.8 |
| Global Occupational deaths in 2015 | 31,857 Deaths | 38.9 |
| Sub-total | 191,348 Deaths | 250.7 |
| Health Effects of Plastics Use in the USA | ||
| Lost IQ Points (PBDE) | 9,818,493 Points | 145.8 |
| Cases of Intellectual Disability (PBDE) | 43,268 | 56.5 |
| Cases of CHD (BPA) | 1,540,000 | 165.9 |
| Cases of Stroke (BPA) | 60,738 | 62.4 |
| Deaths (DEHP) | 90,762 | 490.0 |
| Sub-total | – | 920.6 |
| Social Cost of Carbon – Plastics Production | ||
| Global CO2e emitted during plastics production | 1.96 Gt CO2e | 341.0 |
[i] Source: Authors’ calculations.
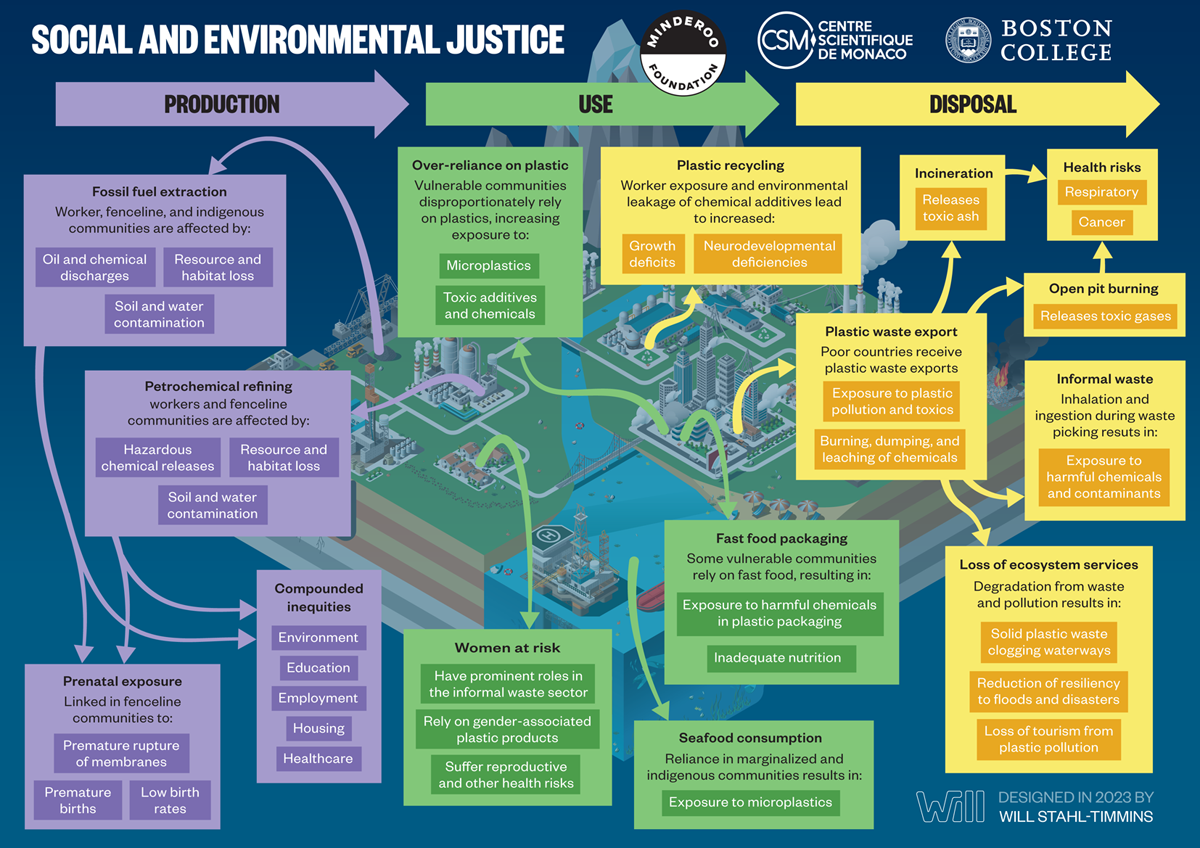
Figure 6.1
The impact of plastic on social and environmental justice.
Credit: Designed in 2022 by Will Stahl-Timmins.
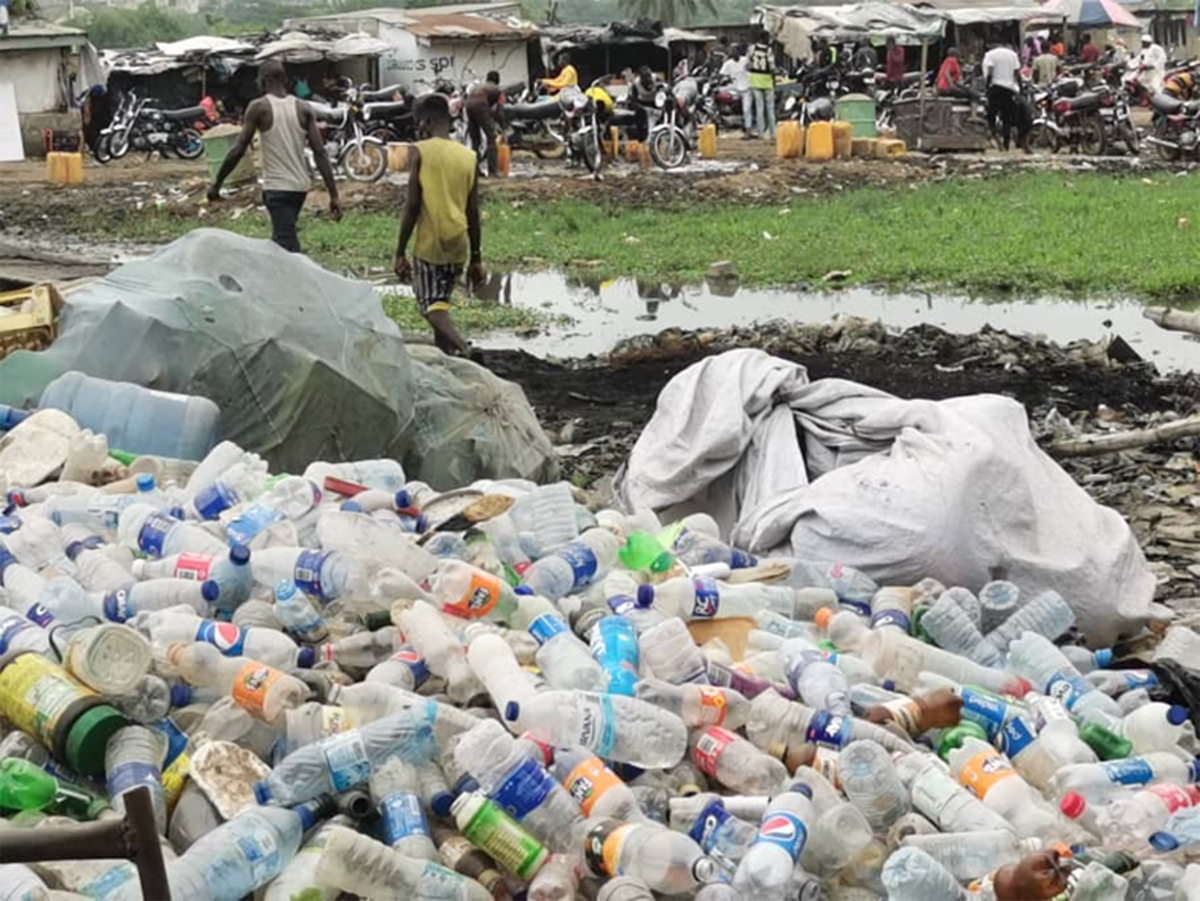
Figure 6.2
Informal waste pickers – transit storage site in Ogun State, Nigeria.
Credit: Adetoun Mustapha and Korede Out.
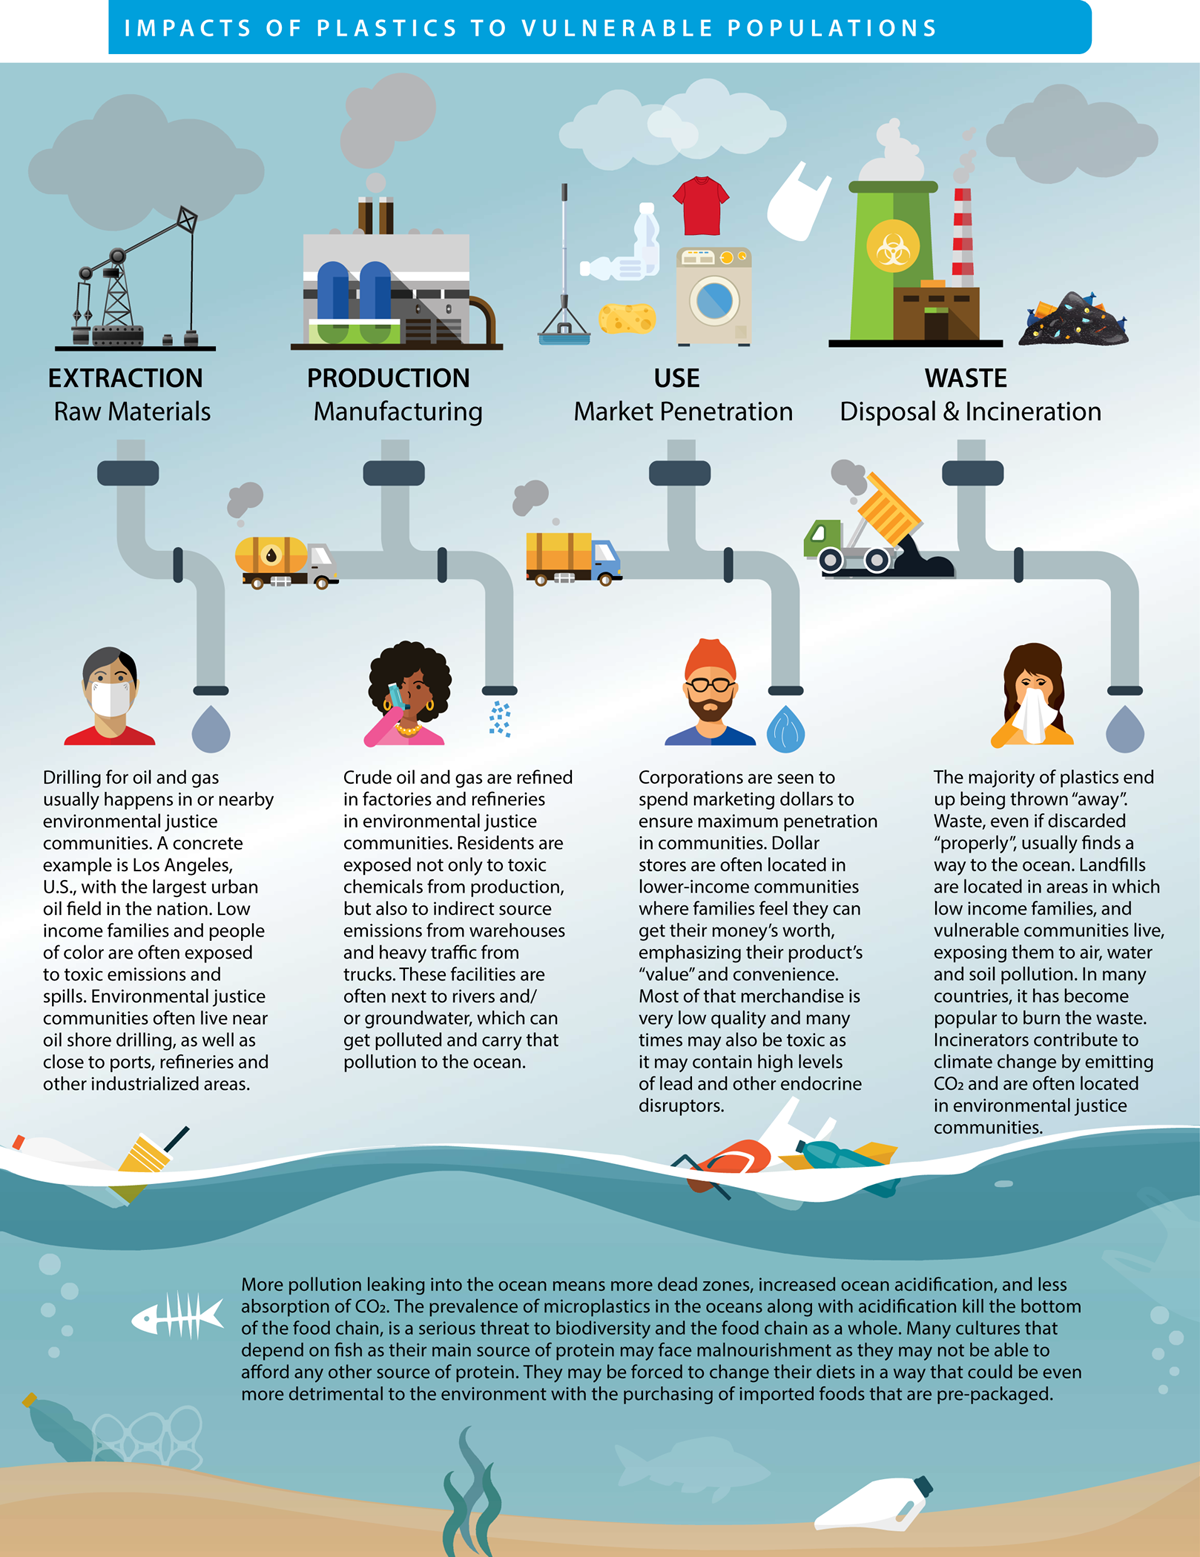
Figure 6.3
Impacts of plastic to vulnerable populations. As depicted in this figure from (UNEP and Azul, 2021), vulnerable groups and populations are adversely affected by plastic pollution (which includes intentional and unintentional leakage of plastic and chemical additives to the environment), throughout the entire life cycle of plastics, beginning with extraction and production, through its market penetration and uses, to plastic waste management and disposal.
Original source: (UNEP and Azul, 2021).
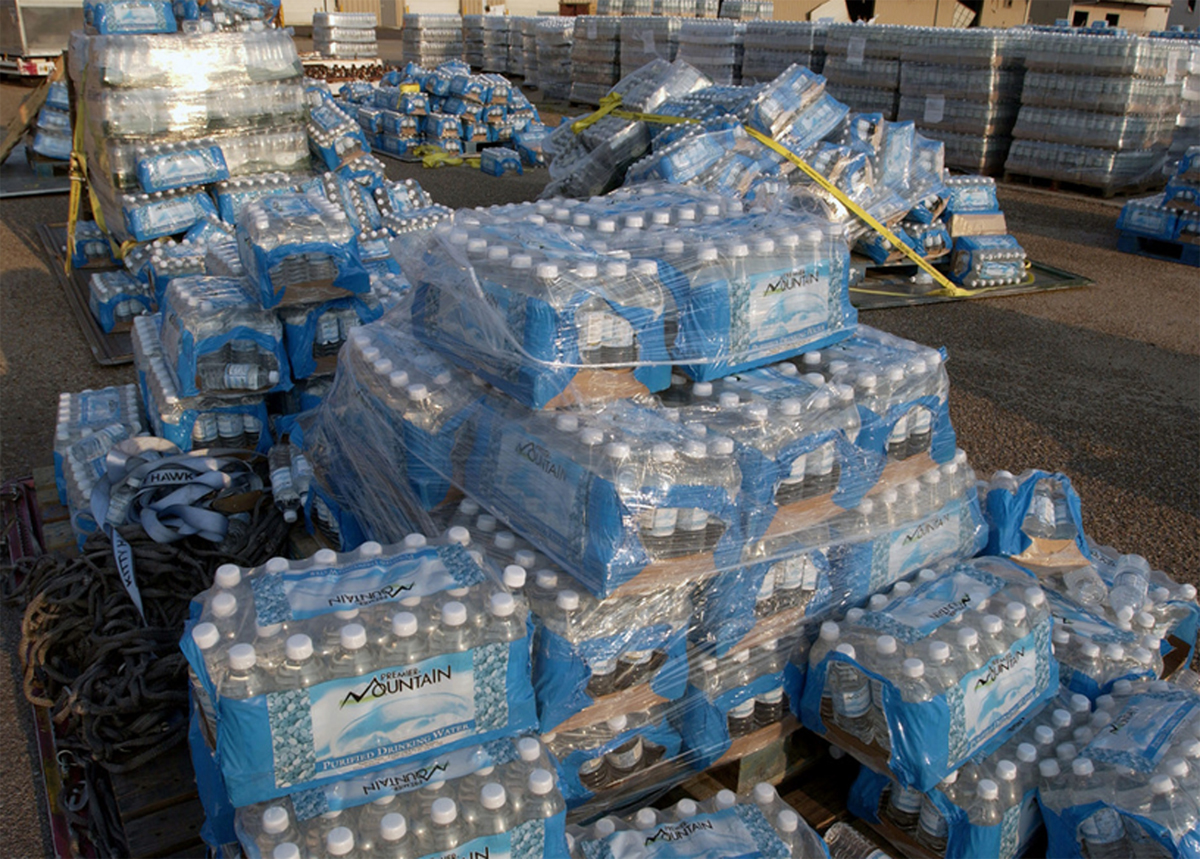
Figure 6.4
Bottled drinking water to support Hurricane Katrina personnel in New Orleans, Louisiana.
Credit: MSGT Michael E. Best, USAF.
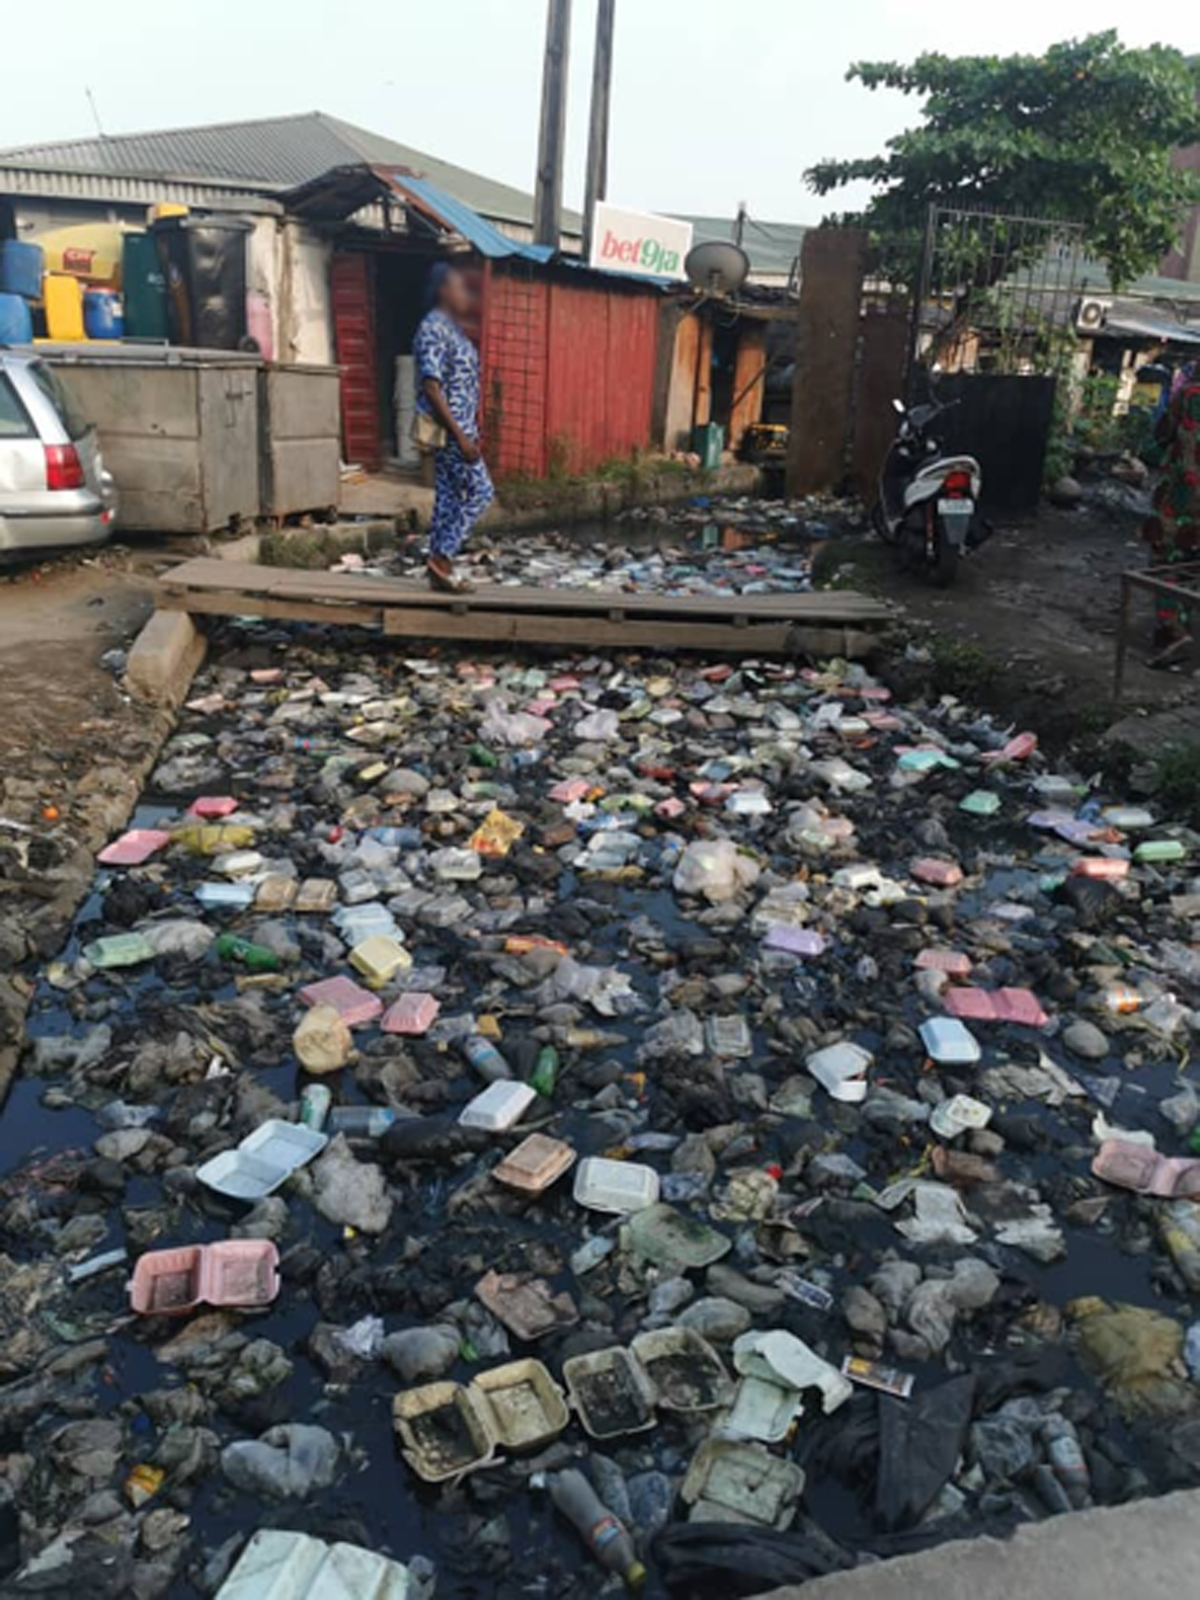
Figure 6.5
Single use plastic waste clogging open drains in Makoko, Lagos, Nigeria.
Credit: Adetoun Mustapha and Korede Out.
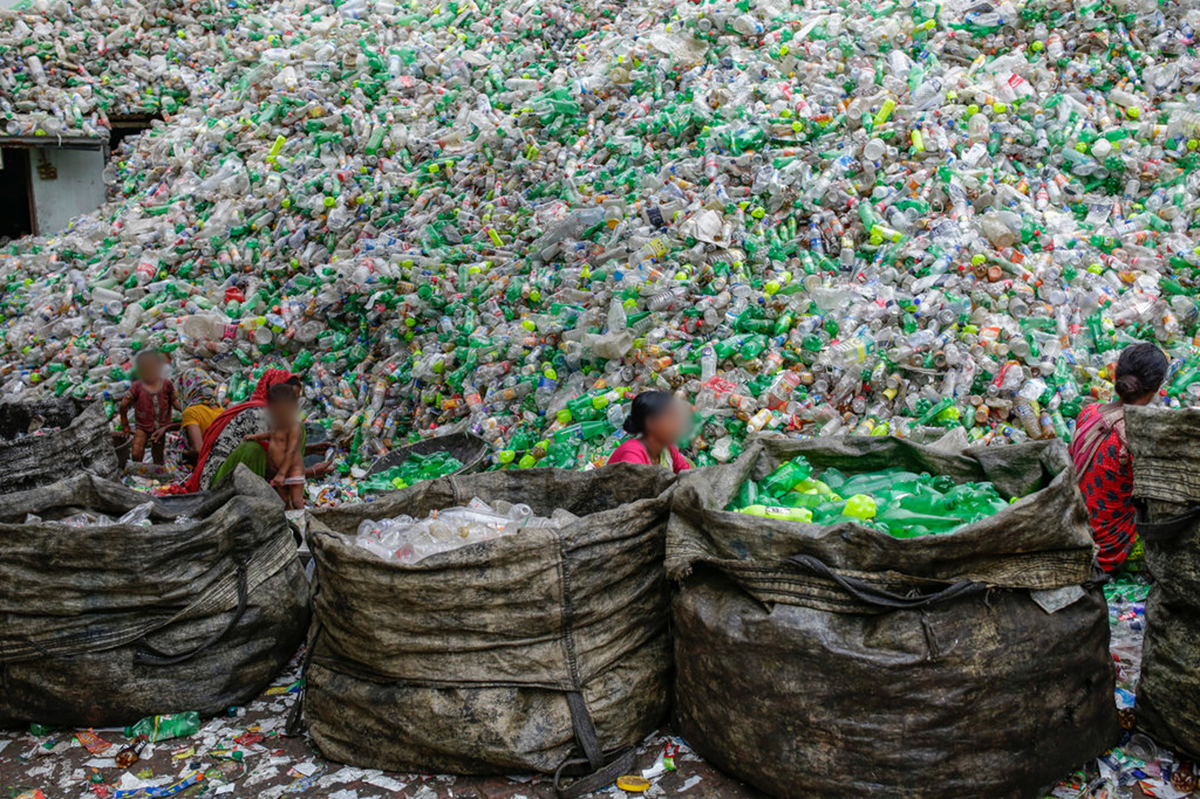
Figure 6.6
Female workers sort out plastic bottles for recycling in a factory in Dhaka, Bangladesh.
Credit: Abir Abdullah/Climate Visuals Countdown.
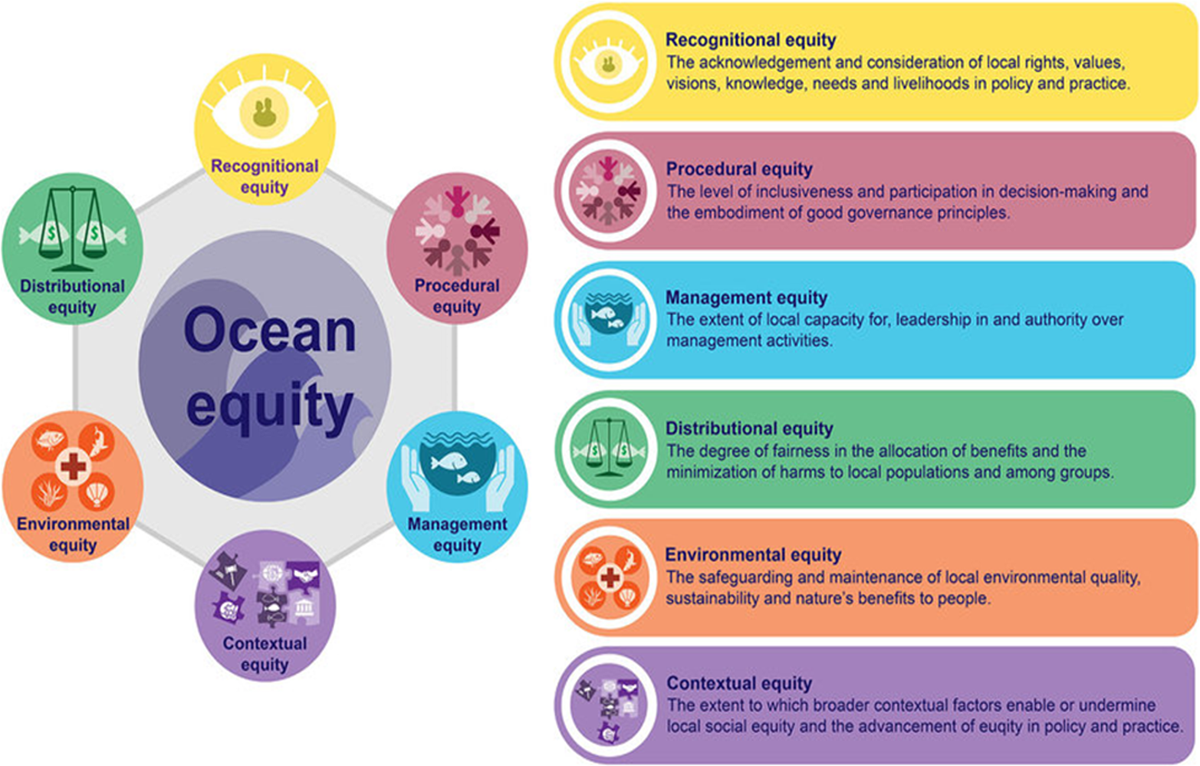
Figure 6.7
Ocean equity is comprised of several distinct dimensions. Bennett (2022) describes, and depicts in this figure, a range of equity considerations (which include many aspects of procedural and distributional equity) relevant to those working in coastal and marine conservation. These equity dimensions may also provide a useful framework for embedding social and environmental justice (SEJ) in decisions and processes relevant to plastic production and pollution at the local to global scale – even beyond coastal and marine areas.
Original source: (Bennett, 2022).
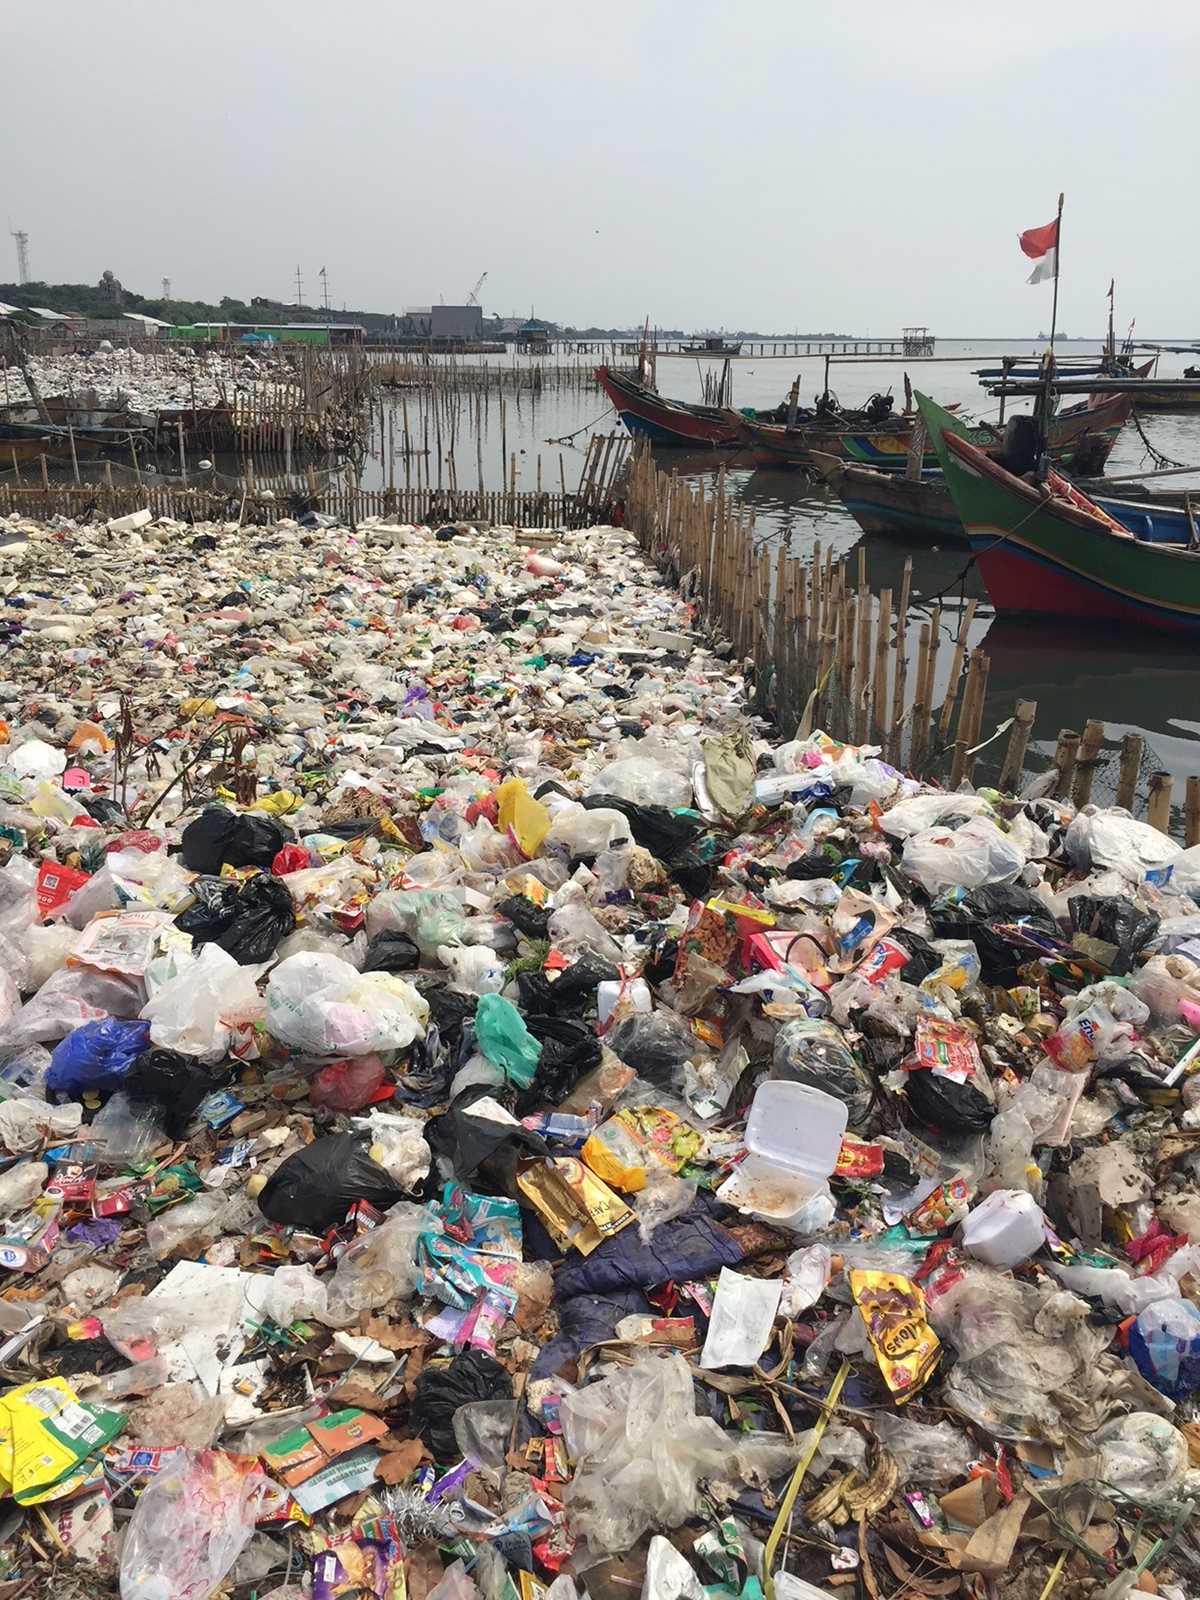
Figure 6.8
Trash next to a waterway in Indonesia.
Credit: Credit to Richard C. Thompson, University of Plymouth.