
Table 1
Incident cases, deaths, and DALYs of Pancreatic Cancer and ASRs per 100,00 population from 1990 and 2019 by Global Burden of Disease.
| CHARACTERISTICS | 1990 | 2019 | 1990–2019 | |||
|---|---|---|---|---|---|---|
| INCIDENT CASES | ASIR PER 100,000 | INCIDENT CASES | ASIR PER 100,000 | EAPC | ||
| NO. (95% UI) | NO. (95% UI) | NO. (95% UI) | NO. (95% UI) | NO. (95% CI) | ||
| Overall | 197,348 (188,604–203,971) | 5.2 (5–5.4) | 530,297 (486,175–573,635) | 6.6 (6–7.1) | 0.83 (0.78–0.87) | |
| Sex | ||||||
| Male | 104,052 (99,198–108,991) | 6 (5.7–6.3) | 279,903 (256,009–303,427) | 7.5 (6.8–8.1) | 0.84 (0.79–0.9) | |
| Female | 93,296 (88,534–96,902) | 4.5 (4.3–4.7) | 250,393 (223,820–275,352) | 5.7 (5.1–6.3) | 0.81 (0.77–0.85) | |
| Socio-demographic index | ||||||
| Low | 3632 (2909–4342) | 1.6 (1.3–1.9) | 12,561 (11,018–14,176) | 2.5 (2.2–2.9) | 1.67 (1.62–1.72) | |
| Low-middle | 10,304 (8852–11,799) | 1.8 (1.5–2) | 46,939 (42,996–51,039) | 3.5 (3.2–3.8) | 2.4 (2.36–2.45) | |
| Middle | 27,405 (25,465–29,352) | 2.7 (2.5–2.9) | 117,095 (104,632–130,584) | 4.8 (4.3–5.3) | 2.03 (1.97–2.1) | |
| High-middle | 64,779 (62,374–67,157) | 6.1 (5.9–6.4) | 156,544 (142,579–170,422) | 7.7 (7–8.3) | 0.74 (0.66–0.83) | |
| High | 91,158 (87,225–93,124) | 8.7 (8.3–8.9) | 196,919 (174,831–215,526) | 10.2 (9.1–11.1) | 0.62 (0.58–0.67) | |
| Regions | ||||||
| Andean Latin America | 395 (349–445) | 2 (1.7–2.2) | 2870 (2344–3463) | 5.2 (4.3–6.3) | 3.64 (3.01–4.27) | |
| Australasia | 1823 (1740–1887) | 7.8 (7.4–8) | 4427 (3566–5396) | 8.7 (7–10.7) | 0.45 (0.38–0.52) | |
| Caribbean | 417 (396–437) | 1.6 (1.5–1.7) | 2649 (2216–3090) | 5.1 (4.3–6) | 3.84 (3.05–4.63) | |
| Central Asia | 1157 (1027–1295) | 2.5 (2.2–2.8) | 4116 (3761–4529) | 5.8 (5.3–6.4) | 3.66 (3.27–4.04) | |
| Central Europe | 12,294 (11,948–12,568) | 8.3 (8.1–8.5) | 22,048 (19,435–24,834) | 10.3 (9.1–11.7) | 0.79 (0.71–0.87) | |
| Central Latin America | 3527 (3403–3621) | 4.4 (4.2–4.5) | 12,504 (10,826–14,378) | 5.4 (4.6–6.2) | 0.45 (0.33–0.56) | |
| Central Sub-Saharan Africa | 477 (384–597) | 2.2 (1.7–2.7) | 1403 (1106–1769) | 2.7 (2.2–3.4) | 0.54 (0.26–0.82) | |
| East Asia | 27,929 (24,282–31,467) | 3.2 (2.8–3.6) | 119,571 (102,244–138,482) | 5.8 (5–6.7) | 2.31 (2.13–2.5) | |
| Eastern Europe | 18,854 (17,939–20,052) | 6.7 (6.4–7.1) | 27,330 (24,669–30,295) | 8 (7.2–8.8) | 0.28 (0.04–0.52) | |
| Eastern Sub-Saharan Africa | 1385 (1157–1634) | 1.9 (1.6–2.2) | 4460 (3755–5247) | 2.8 (2.4–3.3) | 1.41 (1.35–1.47) | |
| High-income Asia Pacific | 18,798 (17,948–19,289) | 9.5 (9–9.8) | 49,450 (41,236–56,372) | 10.2 (8.7–11.7) | 0.37 (0.27–0.48) | |
| High-income North America | 31,874 (30,346–32,741) | 9 (8.6–9.2) | 65,345 (57,314–74,242) | 10.3 (9.1–11.7) | 0.5 (0.47–0.53) | |
| North Africa and Middle East | 4519 (3841–5331) | 2.7 (2.3–3.2) | 22,237 (19,273–25,716) | 5.3 (4.6–6.1) | 2.5 (2.38–2.62) | |
| Oceania | 50 (40–64) | 1.8 (1.4–2.2) | 166 (133–209) | 2.5 (2–3.1) | 1.09 (0.97–1.21) | |
| South Asia | 7582 (6136–8936) | 1.4 (1.1–1.7) | 38,731 (34,043–43,732) | 2.9 (2.5–3.2) | 2.45 (2.38–2.53) | |
| Southeast Asia | 5951 (5439–6512) | 2.4 (2.2–2.6) | 25,376 (20,339–31,451) | 4.3 (3.5–5.3) | 2.04 (2–2.08) | |
| Southern Latin America | 3945 (3652–4247) | 8.6 (8–9.3) | 8841 (6977–11,035) | 10.5 (8.3–13.1) | 0.55 (0.4–0.7) | |
| Southern Sub-Saharan Africa | 1170 (1017–1399) | 4.4 (3.8–5.3) | 3303 (2984–3657) | 6.1 (5.5–6.7) | 0.93 (0.63–1.22) | |
| Tropical Latin America | 4477 (4307–4624) | 5.1 (4.9–5.3) | 14,752 (13,632–15,617) | 6.2 (5.7–6.5) | 0.73 (0.68–0.78) | |
| Western Europe | 48,837 (46,858–49,902) | 8.4 (8.1–8.6) | 92,785 (80,325–105,234) | 10 (8.7–11.4) | 0.69 (0.61–0.78) | |
| Western Sub-Saharan Africa | 1886 (1556–2244) | 2.2 (1.9–2.6) | 7932 (6509–9408) | 4.5 (3.8–5.3) | 2.44 (2.39–2.5) | |
| CHARACTERISTICS | 1990 | 2019 | 1990–2019 | |||
| DEATHS CASES | ASMR PER 100,000 | DEATHS CASES | ASMR PER 100,000 | EAPC | ||
| NO. (95% UI) | NO. (95% UI) | NO. (95% UI) | NO. (95% UI) | NO. (95% CI) | ||
| Overall | 198,051 (189,329–204,763) | 5.3 (5.1–5.5) | 531,107 (491,948–566,537) | 6.6 (6.1–7.1) | 0.77 (0.73–0.81) | |
| Sex | ||||||
| Male | 103,312 (98,381–108,764) | 6.1 (5.8–6.4) | 278,174 (257,505–298,745) | 7.5 (7–8.1) | 0.79 (0.74–0.85) | |
| Female | 94,739 (89,322–98,184) | 4.6 (4.3–4.8) | 252,934 (225,846–273,820) | 5.8 (5.1–6.2) | 0.74 (0.71–0.77) | |
| Socio-demographic index | ||||||
| Low | 3732 (2987–4466) | 1.7 (1.4–2) | 12,946 (11,336–14,669) | 2.7 (2.4–3.1) | 1.66 (1.61–1.71) | |
| Low-middle | 10,534 (8989–11,991) | 1.9 (1.6–2.2) | 48,532 (44,310–53,080) | 3.8 (3.4–4.1) | 2.38 (2.34–2.43) | |
| Middle | 27,840 (25,926–29,775) | 2.9 (2.7–3.1) | 120,021 (107,034–134,529) | 5 (4.5–5.6) | 2 (1.93–2.07) | |
| High-middle | 66,079 (63,329–68,574) | 6.4 (6.1–6.6) | 159,583 (146,077–170,902) | 7.8 (7.2–8.4) | 0.69 (0.61–0.77) | |
| High | 89,795 (85,585–91,855) | 8.5 (8.1–8.7) | 189,782 (171,237–200,955) | 9.6 (8.8–10.2) | 0.49 (0.45–0.53) | |
| Regions | ||||||
| Andean Latin America | 412 (365–463) | 2.1 (1.9–2.4) | 3007 (2470–3615) | 5.5 (4.5–6.6) | 3.61 (2.97–4.24) | |
| Australasia | 1760 (1671–1822) | 7.5 (7.1–7.8) | 4158 (3736–4560) | 8.1 (7.4–8.9) | 0.32 (0.24–0.4) | |
| Caribbean | 433 (410–453) | 1.7 (1.6–1.8) | 2741 (2302–3188) | 5.3 (4.4–6.2) | 3.78 (2.99–4.58) | |
| Central Asia | 1174 (1039–1321) | 2.6 (2.3–2.9) | 4144 (3780–4556) | 6.1 (5.5–6.7) | 3.69 (3.3–4.07) | |
| Central Europe | 12,578 (12,196–12,873) | 8.6 (8.3–8.8) | 22,801 (19,902–25,677) | 10.6 (9.3–11.9) | 0.75 (0.67–0.83) | |
| Central Latin America | 3642 (3508–3742) | 4.6 (4.4–4.8) | 12,898 (11,082–14,848) | 5.6 (4.8–6.4) | 0.38 (0.27–0.5) | |
| Central Sub-Saharan Africa | 486 (397–603) | 2.3 (1.9–2.8) | 1424 (1129–1786) | 2.9 (2.4–3.6) | 0.52 (0.23–0.8) | |
| East Asia | 28,252 (24,692–32,012) | 3.3 (3–3.8) | 122,002 (104,214–140,812) | 6 (5.1–6.9) | 2.25 (2.07–2.43) | |
| Eastern Europe | 19,237 (18,286–20,441) | 6.9 (6.5–7.3) | 28,129 (25,268–31,110) | 8.2 (7.3–9.1) | 0.28 (0.05–0.51) | |
| Eastern Sub-Saharan Africa | 1428 (1197–1679) | 2 (1.7–2.4) | 4636 (3921–5448) | 3.1 (2.6–3.6) | 1.47 (1.4–1.54) | |
| High-income Asia Pacific | 17,677 (16,887–18,130) | 9 (8.6–9.3) | 45,214 (38,768–48,954) | 9.2 (8.2–9.9) | 0.16 (0.06–0.25) | |
| High-income North America | 31,377 (29,759–32,260) | 8.8 (8.4–9) | 63,557 (59,249–66,551) | 9.9 (9.3–10.3) | 0.44 (0.41–0.47) | |
| North Africa and Middle East | 4594 (3889–5424) | 2.8 (2.4–3.4) | 22,277 (19,357–25,691) | 5.5 (4.8–6.3) | 2.42 (2.25–2.59) | |
| Oceania | 51 (40–65) | 1.9 (1.5–2.4) | 167 (134–209) | 2.6 (2.2–3.2) | 1.08 (0.96–1.19) | |
| South Asia | 7736 (6243–9125) | 1.5 (1.2–1.8) | 40,012 (35,017–45,582) | 3 (2.7–3.5) | 2.41 (2.34–2.48) | |
| Southeast Asia | 6067 (5546–6595) | 2.5 (2.3–2.7) | 26,038 (20,861–32,271) | 4.6 (3.6–5.7) | 2.04 (2–2.08) | |
| Southern Latin America | 4114 (3795–4446) | 9.1 (8.4–9.8) | 9199 (8438–9924) | 10.9 (10–11.7) | 0.49 (0.34–0.63) | |
| Southern Sub-Saharan Africa | 1205 (1037–1437) | 4.7 (4–5.6) | 3411 (3078–3764) | 6.5 (5.9–7.2) | 0.96 (0.68–1.24) | |
| Tropical Latin America | 4601 (4399–4752) | 5.4 (5.1–5.6) | 15,313 (14,138–16,225) | 6.4 (5.9–6.8) | 0.69 (0.63–0.74) | |
| Western Europe | 49,267 (47,112–50,393) | 8.4 (8–8.6) | 91,771 (83,319–97,811) | 9.7 (8.9–10.2) | 0.56 (0.5–0.61) | |
| Western Sub-Saharan Africa | 1962 (1645–2306) | 2.4 (2–2.8) | 8209 (6811–9708) | 4.9 (4.1–5.7) | 2.45 (2.4–2.5) | |
| CHARACTERISTICS | 1990 | 2019 | 1990–2019 | |||
| DALYS CASES | ASDR PER 100,000 | DALYS CASES | ASDR PER 100,000 | EAPC | ||
| NO. (95% UI) | NO. (95% UI) | NO. (95% UI) | NO. (95% UI) | NO. (95% CI) | ||
| Overall | 4,647,207 (4,465,440–4,812,129) | 115.5 (110.8–119.6) | 11,549,016 (10,777,405–12,338,912) | 139.6 (130.2–149.1) | 0.67 (0.63–0.71) | |
| Sex | ||||||
| Male | 2,622,005 (2,488,009–2,776,580) | 137.3 (130.5–144.9) | 6,484,586 (5,984,574–6,995,914) | 164.7 (151.9–177.4) | 0.68 (0.62–0.73) | |
| Female | 2,025,202 (1,934,140–2,102,632) | 95 (90.6–98.5) | 5,0644,29 (4,630,521–5,462,302) | 116 (106–125.1) | 0.66 (0.63–0.68) | |
| Socio-demographic index | ||||||
| Low | 100,183 (80,547–120,048) | 39.7 (31.8–47.5) | 335,996 (293,809–382,001) | 61.4 (53.9–69.7) | 1.55 (1.49–1.6) | |
| Low-middle | 280,954 (240,632–321,228) | 44.2 (37.7–50.4) | 1,188,693 (1,080,191–1,309,276) | 84.2 (76.7–92.5) | 2.29 (2.25–2.33) | |
| Middle | 753,881 (697,543–811,889) | 67.9 (63.1–72.8) | 2,901,059 (2,595,114–3,249,069) | 112.5 (100.6–126) | 1.81 (1.75–1.87) | |
| High-middle | 1,618,722 (1,552,786–1,680,981) | 147.6 (141.6–153.3) | 3,553,955 (3,272,690–3,819,144) | 174.4 (160.4–187.4) | 0.51 (0.42–0.6) | |
| High | 1,891,864 (1,832,587–1,922,820) | 184.5 (179–187.4) | 3,564,050 (3,347,923–3,733,175) | 199.6 (188.7–208.4) | 0.32 (0.28–0.35) | |
| Regions | ||||||
| Andean Latin America | 10,198 (8982–11,509) | 48 (42.3–54.1) | 66,402 (53,656–80,688) | 117.5 (95.2–142.4) | 3.37 (2.77–3.98) | |
| Australasia | 37,286 (35,951–38,447) | 159.5 (153.7–164.4) | 78,744 (72,376–85,204) | 166.8 (153.8–180.2) | 0.22 (0.13–0.3) | |
| Caribbean | 10,060 (9583–10,536) | 38.2 (36.4–39.9) | 60,169 (50,197–70,456) | 116 (96.7–135.6) | 3.74 (2.97–4.51) | |
| Central Asia | 30,118 (27,058–33,497) | 62 (55.4–69.2) | 107,574 (97,906–118,737) | 137.9 (125.8–151.8) | 3.46 (3.06–3.86) | |
| Central Europe | 304,303 (297,472–310,263) | 204.8 (200–208.9) | 489,691 (428,369–552,784) | 242 (211.1–273.7) | 0.6 (0.52–0.68) | |
| Central Latin America | 89,927 (87,650–92,047) | 103.2 (100.3–105.9) | 296,170 (255,205–343,366) | 123.6 (106.8–143.3) | 0.37 (0.26–0.48) | |
| Central Sub-Saharan Africa | 13,594 (10,913–17,110) | 54.7 (44.7–67.8) | 39,510 (30,534–50,482) | 67.7 (53.6–85.2) | 0.46 (0.18–0.73) | |
| East Asia | 781,223 (674,711–895,330) | 81.8 (71.1–93.2) | 2,912,678 (2,471,047–3,375,822) | 137 (116.5–158.7) | 2.01 (1.84–2.18) | |
| Eastern Europe | 491,781 (468,431–523,367) | 173.9 (165.6–185.3) | 666,519 (598,990–741,493) | 200.9 (180.3–223.3) | 0.07 (–0.2–0.34) | |
| Eastern Sub-Saharan Africa | 38,360 (31,928–45,128) | 47.7 (39.9–56) | 123,529 (103,041–147,354) | 70.3 (59.2–82.9) | 1.37 (1.31–1.43) | |
| High-income Asia Pacific | 392,978 (380,803–400,893) | 192 (185.6–196) | 762,660 (686,247–808,974) | 183.5 (169–192.9) | –0.11 (–0.2––0.01) | |
| High-income North America | 653,052 (632,123–666,614) | 191.9 (186.3–195.7) | 1,263,073 (1,201,537–1,309,882) | 208.7 (199.4–216.1) | 0.29 (0.27–0.32) | |
| North Africa and Middle East | 122,095 (104,334–144,551) | 66.5 (56.7–78.7) | 563,612 (484,686–654,879) | 123 (106.4–142.5) | 2.21 (2.05–2.37) | |
| Oceania | 1,410 (1,116–1,808) | 43.8 (34.8–55.7) | 4,604 (3,628–5,874) | 60.3 (48.4–75.8) | 1.03 (0.9–1.16) | |
| South Asia | 207,394 (169,063–244,804) | 34.6 (27.9–40.8) | 970,655 (854,924–1,107,519) | 67.1 (59–76.4) | 2.35 (2.24–2.45) | |
| Southeast Asia | 165,650 (150,118–181,571) | 59.7 (54.3–65) | 646,986 (519,553–799,457) | 101.9 (81.8–126.1) | 1.76 (1.71–1.82) | |
| Southern Latin America | 92,630 (86,352–99,146) | 198.7 (185.4–212.7) | 189,704 (175,665–203,127) | 230.6 (214.1–246.9) | 0.35 (0.2–0.5) | |
| Southern Sub-Saharan Africa | 30,733 (26,892–35,882) | 106.6 (92.4–125.9) | 83,713 (75,199–93,014) | 143.3 (128.9–159.2) | 0.84 (0.54–1.13) | |
| Tropical Latin America | 115,708 (111,570–119,204) | 121.2 (116.5–124.9) | 347,279 (325,679–365,771) | 141.1 (132.1–148.8) | 0.6 (0.55–0.64) | |
| Western Europe | 1,009,116 (980,031–1,026,588) | 181 (176.2–184.1) | 1,668,725 (1,5594,86–1,757,416) | 199.5 (188–209.3) | 0.41 (0.34–0.47) | |
| Western Sub-Saharan Africa | 49,592 (41,432–59,036) | 54.2 (45.3–64.1) | 207,020 (170,260–247,579) | 105.8 (87.5–125.8) | 2.31 (2.26–2.36) | |
[i] ASIR, age-standardized incidence rate; ASMR, age-standardized mortality rate; ASDR, age-standardized DALYs rate; EAPC, estimated annual percentage change; CI, confidence interval; UI, uncertainty interval.
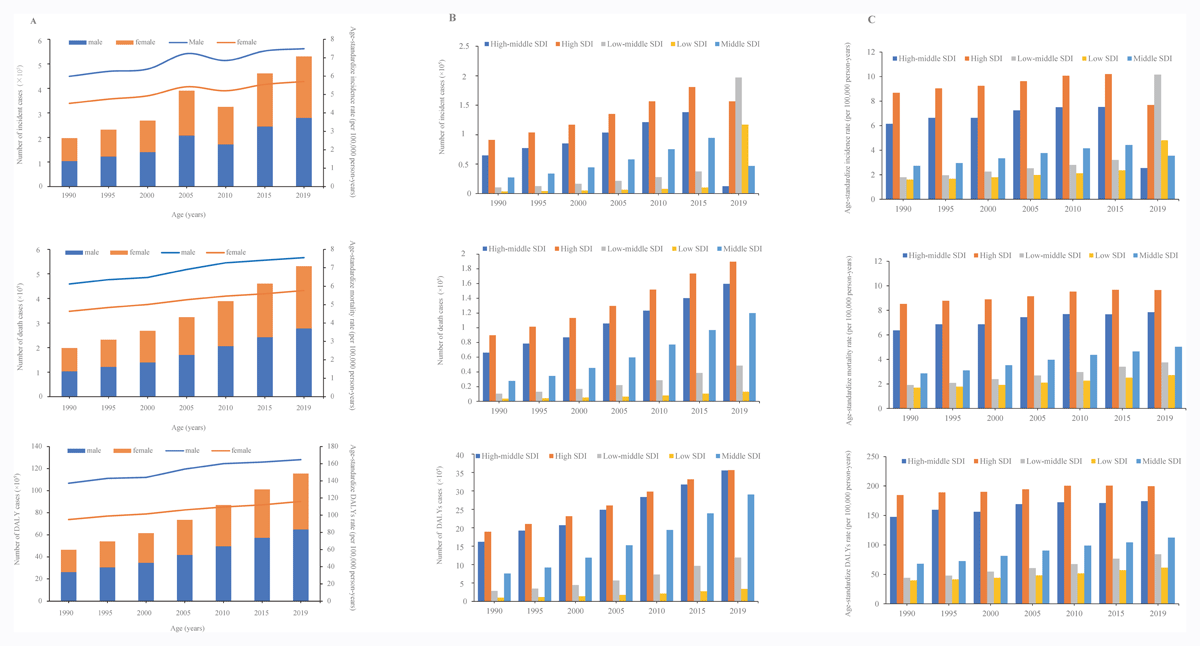
Figure 1
The number cases and ASRs of pancreatic cancer from 1990 to 2019. (A) The incidence, death and DALYs cases and rate of pancreatic cancer caused by global; (B) The incidence, death and DALYs cases and rate of pancreatic cancer caused by SDI regions; (C) The ASIR, ASMR, and ASDR of pancreatic cancer. ASIR, Age-standardized incidence rate; ASMR, age-standardized mortality rate; ASDR, age-standardized DALYs rate.
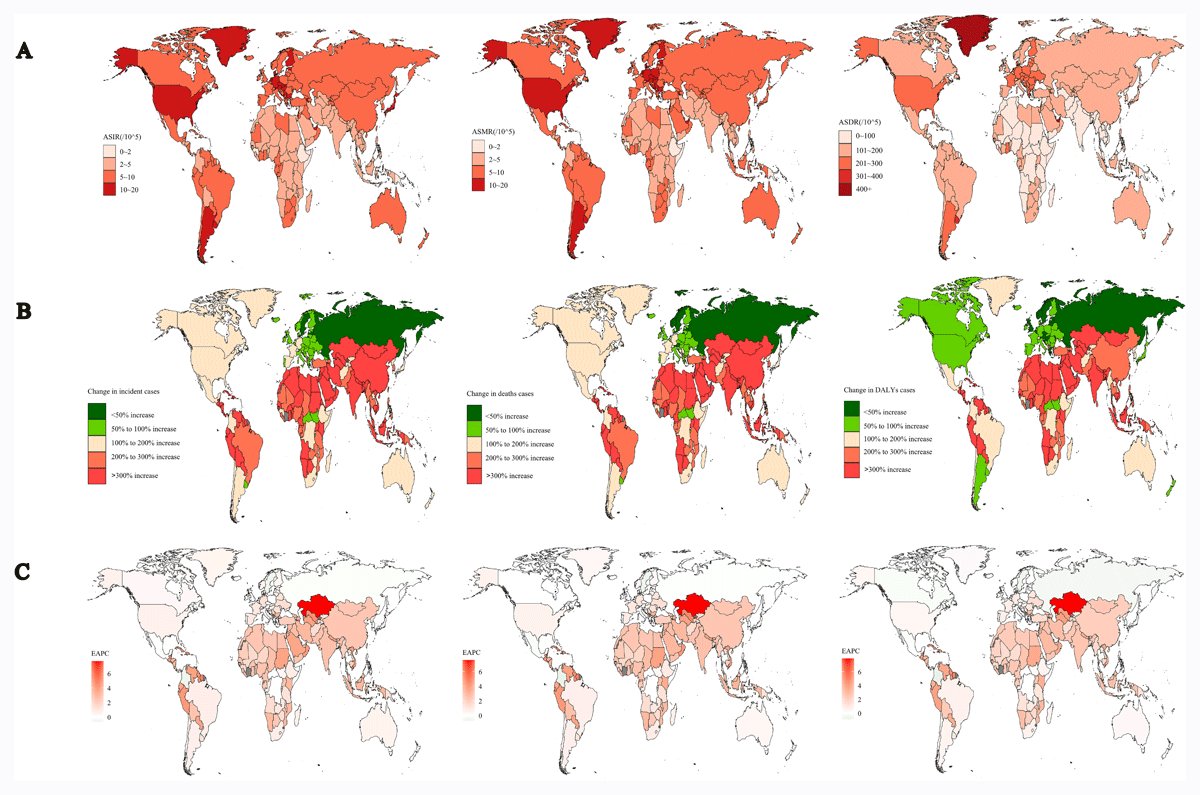
Figure 2
The national burden of pancreatic cancer for both sexes in 204 countries and territories. (A) The ASIR, ASMR, and ASDR of pancreatic cancer in 2019; (B) The relative change in incidence, deaths, and DALYs cases of pancreatic cancer between 1990 and 2019; (C) The EAPC of pancreatic cancer ADIR, ASMR, and ASDR from 1990 to 2019. ASIR, Age-standardized incidence rate; ASMR, age-standardized mortality rate; ASDR, age-standardized DALYs rate; EAPC, estimated annual percentage change.
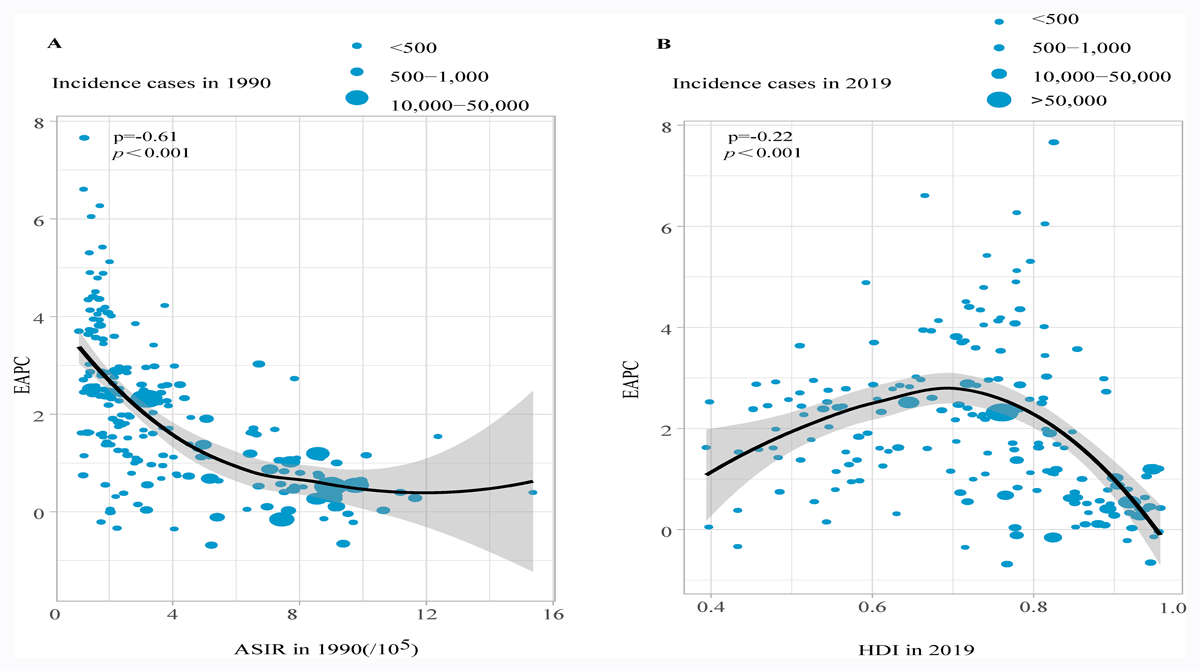
Figure 3
The correlation between EAPC and pancreatic cancer ASIR in 1990 and HDI in 2019. EAPC, estimated annual percentage change; ASIR, Age-standardized incidence rate; HDI, human development index.
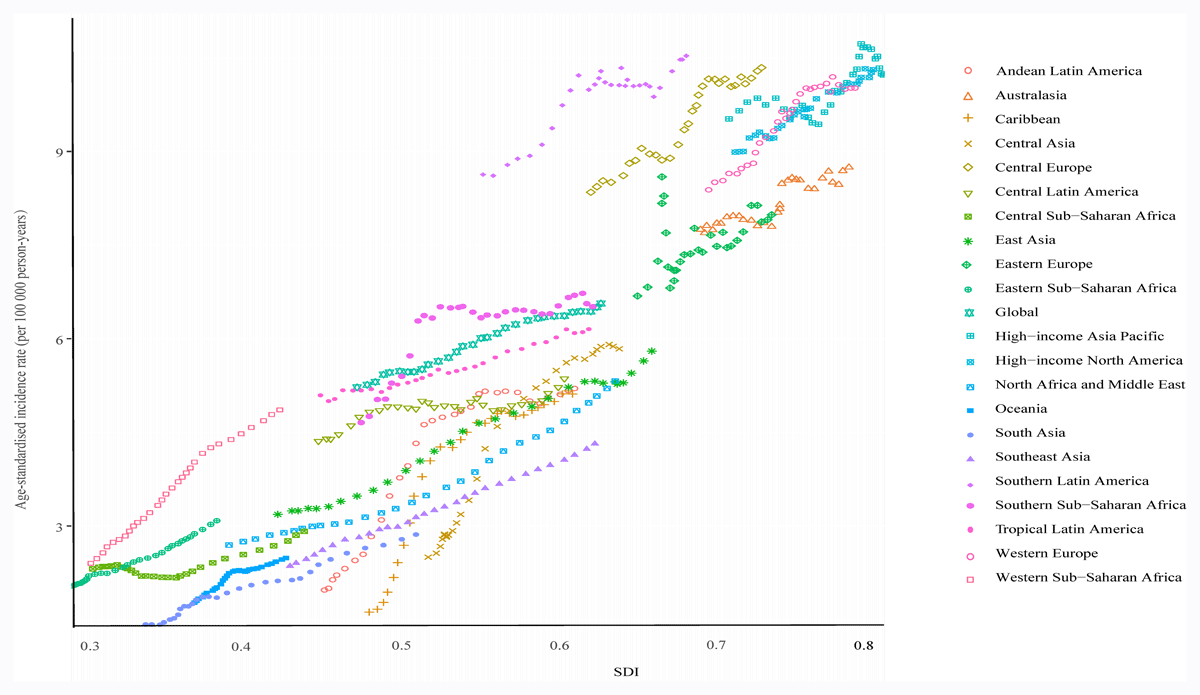
Figure 4
ASIR of pancreatic cancer in global and 21 regions by SDI, 1990–2019. ASIR, age-standardized incidence rate; SDI, sociodemographic index.
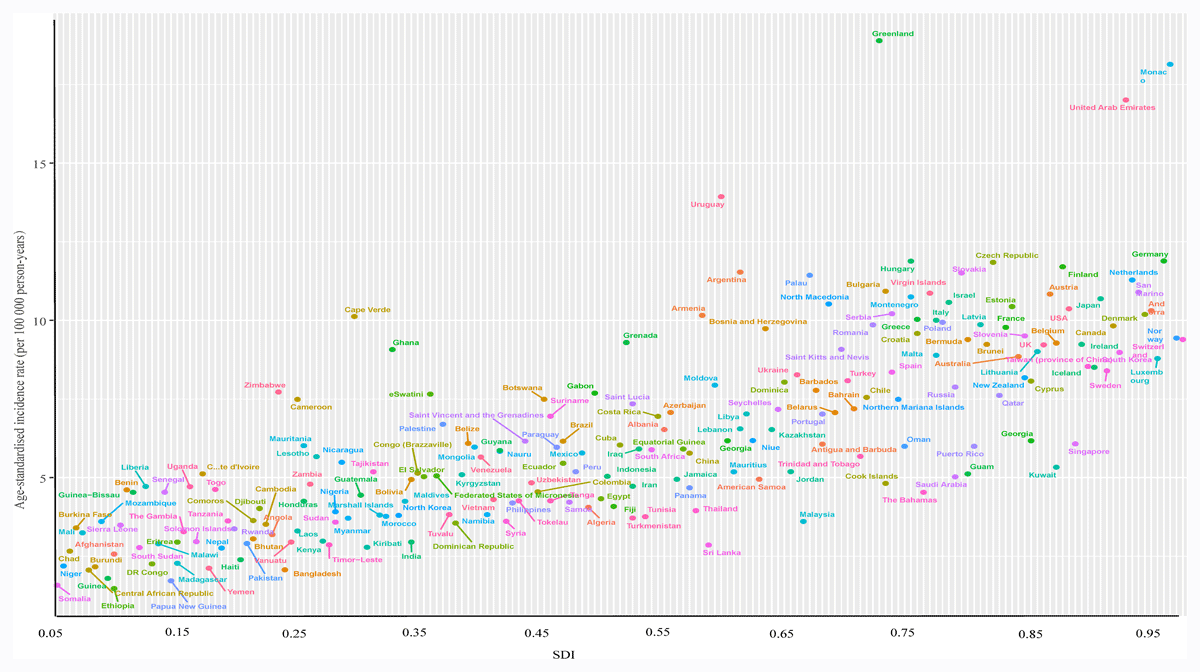
Figure 5
ASIR of pancreatic cancer in 204 countries by SDI, 1990–2019. ASIR, age-standardized incidence rate; SDI, sociodemographic index.