
Table 1
Asbestos consumption for selected countries (countries with more than two million tonnes of asbestos consumption in the period 1933–2012) in four 20-year periods, and percentage of variation by period and country.
| REGION | COUNTRY | ASBESTOS CONSUMPTION (TONS) | |||||||
|---|---|---|---|---|---|---|---|---|---|
| OVERALL (1933–2012) | 1933–1952 | 1953–1972 | 1973–1992 | 1993–2012 | |||||
| VARIATION [%] | VARIATION [%] | VARIATION [%] | |||||||
| America | Brazil (BZ) | 6,702,392 | 80,684 | 609,435 | 655 | 3,006,729 | 393 | 3,005,545 | 0 |
| America | Canada (CAN) | 3,149,032 | 573,012 | 1,212,992 | 112 | 1,077,619 | –11 | 285,408 | –74 |
| America | Mexico (MX) | 2,088,301 | 53,393 | 460,796 | 763 | 1,143,907 | 148 | 430,205 | –62 |
| America | United States of America (US) | 26,441,639 | 7,784,427 | 13,027,033 | 67 | 5,515,179 | –58 | 115,000 | –98 |
| Asia | China (CN) | 15,957,810 | 27,361 | 2,070,665 | 7,468 | 3,843,034 | 86 | 10,016,751 | 161 |
| Asia | India (IN) | 7,043,272 | 141,417 | 641,333 | 354 | 1,916,880 | 199 | 4,343,643 | 127 |
| Asia | Japan (JP) | 11,209,668 | 405,977 | 3,289,065 | 710 | 6,036,293 | 84 | 1,478,333 | –76 |
| Asia | Republic of Korea (ROK) | 2,139,073 | 60,503 | 297,593 | 392 | 1,222,174 | 311 | 558,803 | –54 |
| Asia | Thailand (TH) | 4,091,998 | – | 207,671 | – | 1,473,500 | 610 | 2,410,827 | 64 |
| Europe | Belgium (BE) | 1,956,961 | 213,121 | 949,752 | 346 | 746,671 | –21 | 47,417 | –94 |
| Europe | France (FR) | 4,672,674 | 518,213 | 2,051,029 | 296 | 1,943,113 | –5 | 160,319 | –92 |
| Europe | Germany (DE) | 9,202,903 | 872,733 | 3,677,755 | 321 | 4,640,044 | 26 | 12,371 | –100 |
| Europe | Italy (IT) | 4,513,664 | 350,757 | 1,773,280 | 406 | 2,389,407 | 35 | 220 | –100 |
| Europe | Poland (PL) | 2,460,804 | 54,276 | 663,007 | 1,122 | 1,585,806 | 139 | 157,714 | –90 |
| Europe | Russia (RU) | 45,344,666 | 1,494,255 | 7,989,488 | 435 | 26,721,566 | 234 | 9,139,357 | –66 |
| Europe | Spain (ES) | 2,190,005 | 72,072 | 739,022 | 925 | 1,173,815 | 59 | 205,096 | –83 |
| Europe | United Kingdom (UK) | 6,177,405 | 1,810,254 | 2,999,349 | 66 | 1,318,343 | –56 | 49,459 | –96 |
| Oceania | Australia (AU) | 2,061,747 | 288,057 | 995,438 | 246 | 765,180 | –23 | 13,072 | –98 |
Table 2
Number of mesothelioma deaths for selected countries (with more than 2 million tonnes of asbestos consumption in the period 1920–2012) by period and percentage of variation.
| FIVE-YEAR PERIOD | AUSTRALIA | BELGIUM | BRAZIL | CANADA | FRANCE | GERMANY | ITALY | JAPAN | MEXICO | POLAND | REPUBLIC OF KOREA | SPAIN | UNITED KINGDOM | UNITED STATES OF AMERICA |
|---|---|---|---|---|---|---|---|---|---|---|---|---|---|---|
| 1998–2002 | 2,237 | 821 | 558 | 1,482 | 3,792 | 5,037 | 5,095 | 3,509 | 620 | 308 | 113 | 1,251 | 8,434 | 11,923 |
| 2003–2007 | 2,621 | 961 | 366 | 1,852 | 4,292 | 5,757 | 6,025 | 4,860 | 893 | 513 | 232 | 1,440 | 9,665 | 12,417 |
| Variation [%] | 17 | 17 | –34 | 25 | 13 | 14 | 18 | 39 | 44 | 67 | 105 | 15 | 15 | 4 |
| 2008–2012 | 3,093 | 1,104 | 412 | 2,176 | 4,920 | 6,729 | 6,968 | 6,193 | 1,134 | 924 | 384 | 1,904 | 11,481 | 13,056 |
| Variation [%] | 18 | 15 | 13 | 17 | 15 | 17 | 16 | 27 | 27 | 80 | 66 | 32 | 19 | 5 |
| 2013–2017 | 3,393 | 1,225 | 508 | 2,489 | 5,025 | 7,186 | 7,950 | 7,395 | 1,332 | 1,512 | 508 | 2,148 | 12,715 | 12,659 |
| Variation [%] | 10 | 11 | 23 | 14 | 2 | 7 | 14 | 19 | 17 | 64 | 32 | 13 | 11 | –3 |
| Total | 11,344 | 4,111 | 1,844 | 7,999 | 18,029 | 24,709 | 26,038 | 21,957 | 3,979 | 3,257 | 1,237 | 6,743 | 42,294 | 50,055 |
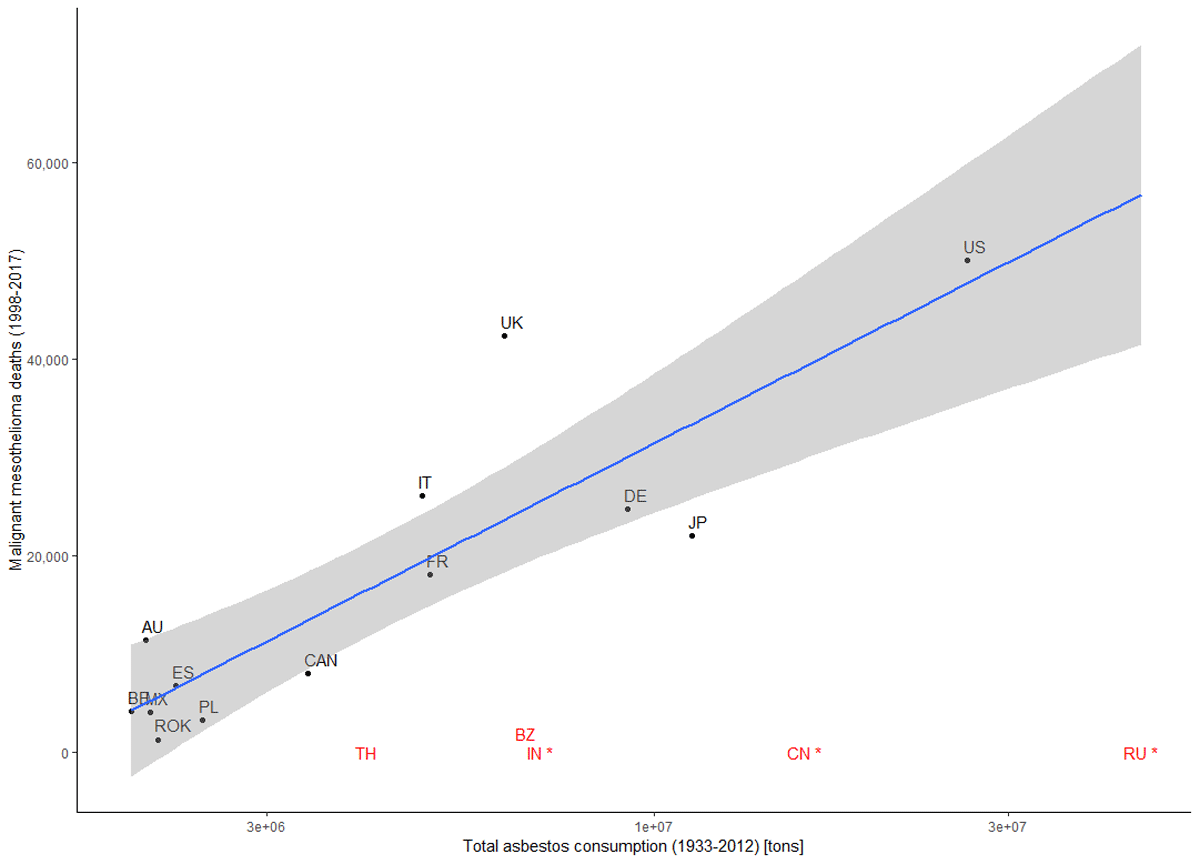
Figure 1
Overall asbestos consumption (1933–2012) and malignant mesothelioma deaths (1998–2017) for selected countries. Regression curve and 95% confidence interval. In red, countries with incomplete mortality data, with asterisk countries missing mortality data. Country abbreviations are the following: Australia (AU), Belgium (BE), Brazil (BZ), Canada (CAN), China (CN), Germany (DE), Spain (ES), France (FR), India (IN), Italy (IT), Japan (JP), Mexico (MX), Poland (PL), Republic of Korea (ROK), Russia (RU), Thailand (TH), United Kingdom (UK), United States of America (US).
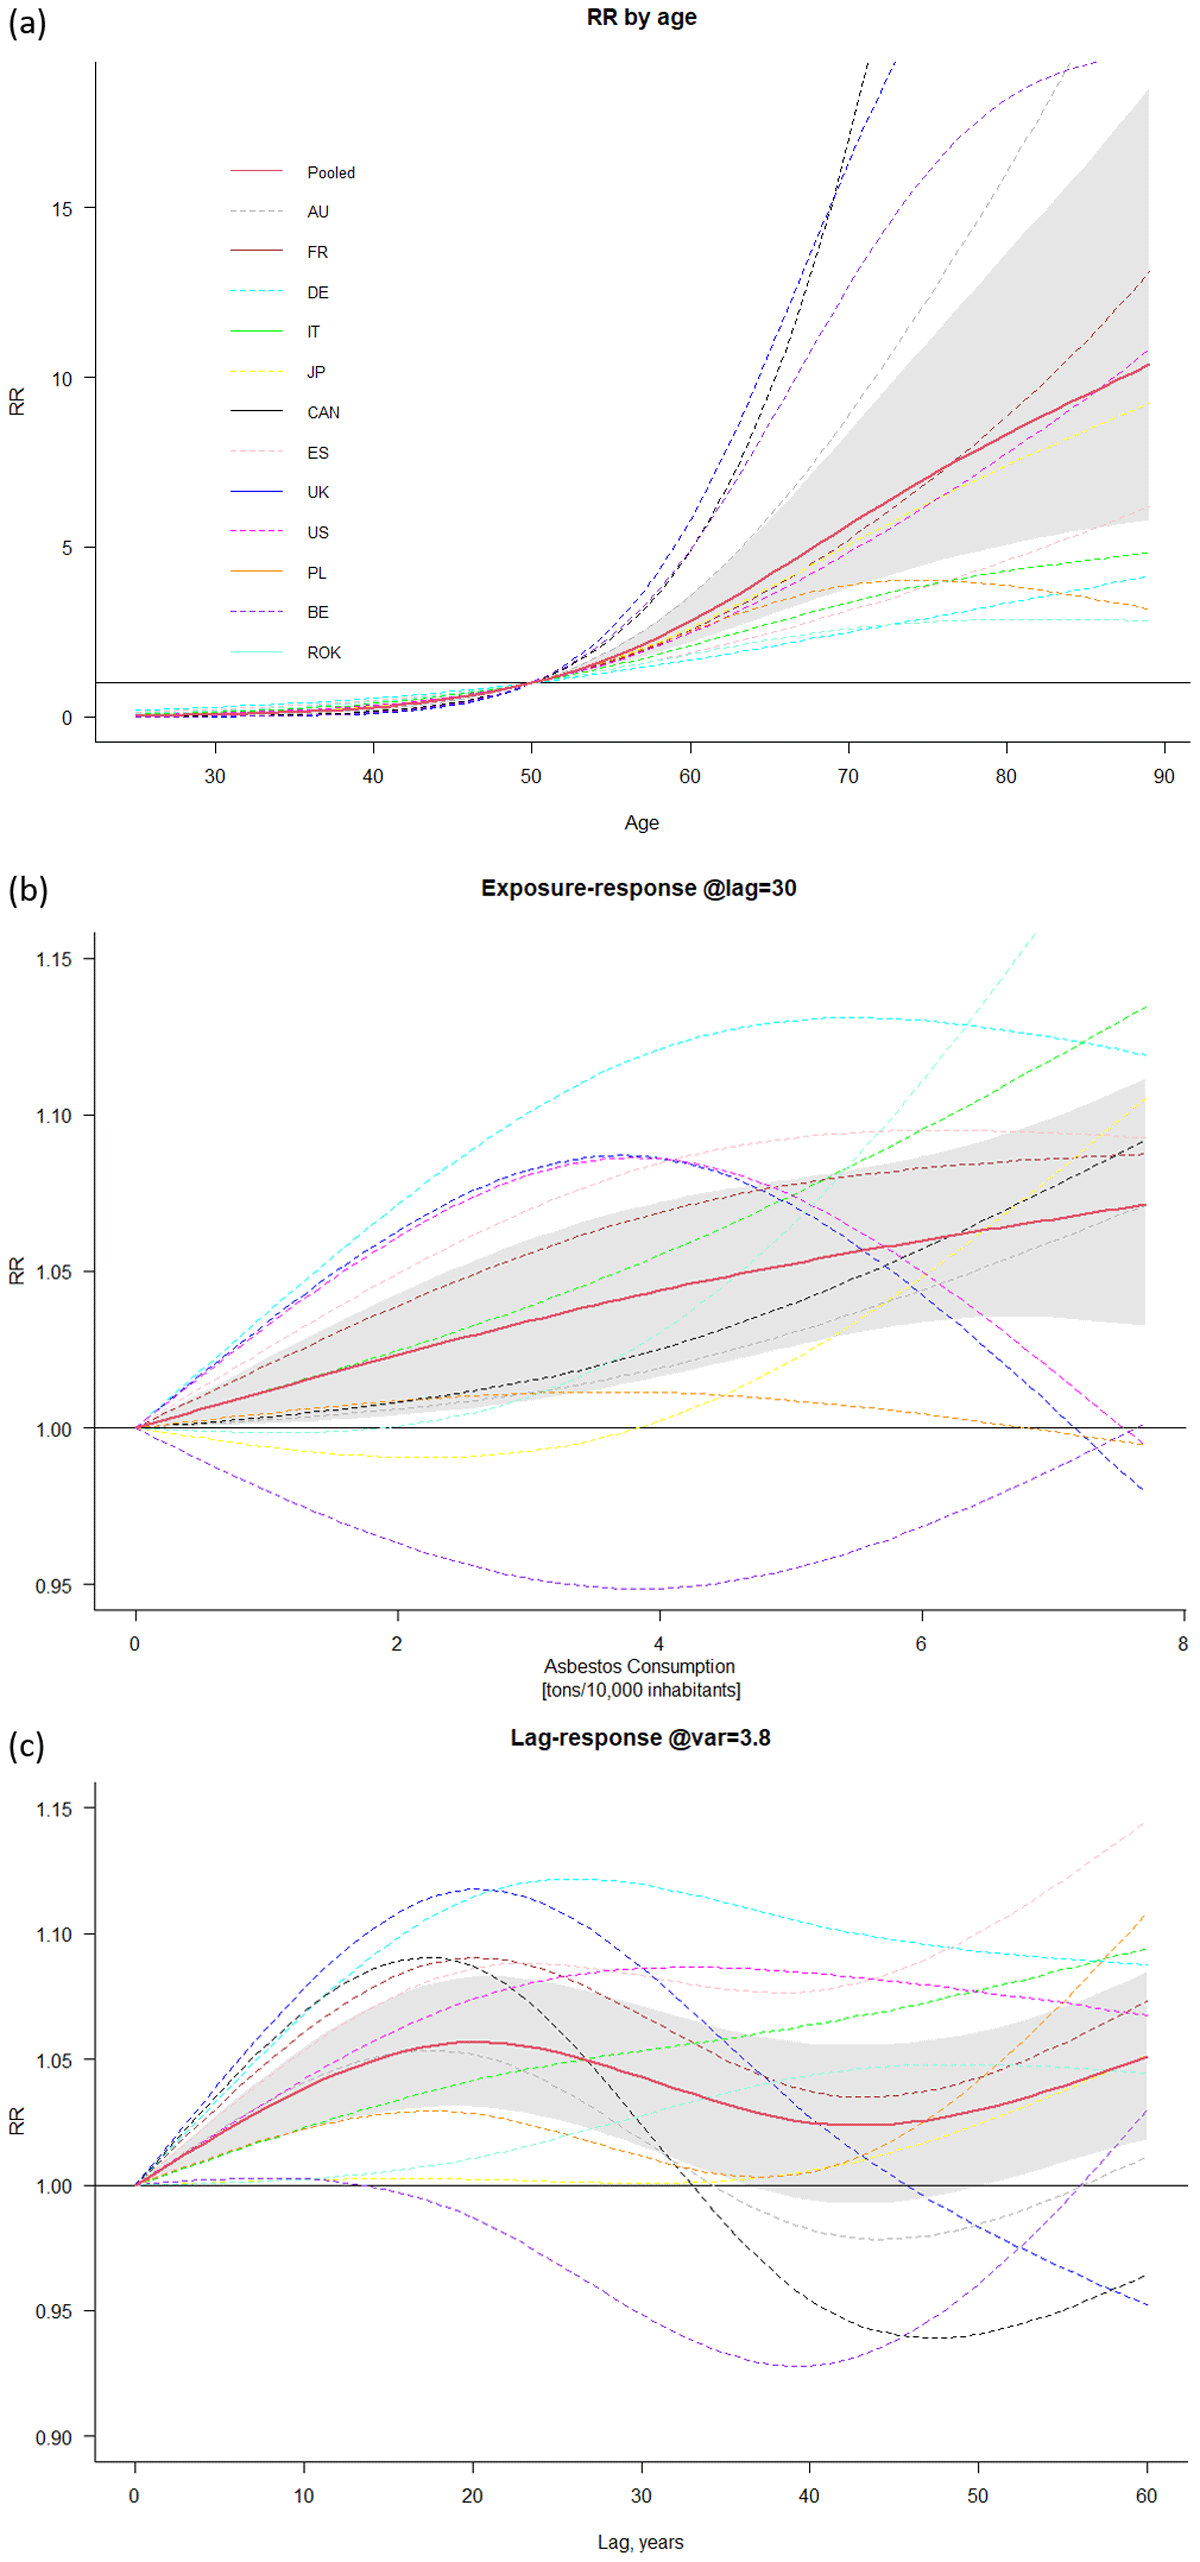
Figure 2
Country-specific relative risk (RR) of malignant mesothelioma and pooled meta-analytical curves (in red) and 95% confidence intervals (in grey) by age (upper), asbestos consumption at lag 30 years (middle), lag at 3.8 tons/10,000 inhabitants of asbestos exposure (bottom). Baselines for RR are set to 50 years for age, and 0 for both exposure-response and lag-response. Country abbreviations are the following: Australia (AU), Belgium (BE), Canada (CAN), Germany (DE), Spain (ES), France (FR), Italy (IT), Japan (JP), Poland (PL), Republic of Korea (ROK), United Kingdom (UK), United States of America (US).
Table 3
Country specific model performances: male population (average in the observed period); observed and predicted malignant mesothelioma cases for males in the period of data availability (Years), Mean Squared Error (MSE), Spearman correlation coefficients between observed and predicted cases by year.
| COUNTRY CODE | MALIGNANT MESOTHELIOMA CASES | |||||
|---|---|---|---|---|---|---|
| MEAN MALE POPULATION (1950–2018) | YEARS | OBSERVED | PREDICTED | MEAN SQUARED ERROR (MSE) | SPEARMAN COEFFICIENT | |
| AU | 7,912,528 | 1998–2018 | 9,573 | 9,150 | 19.4 | 0.96 |
| FR | 26,379,622 | 2000–2014 | 10,240 | 9,923 | 26.7 | 0.81 |
| DE | 37,741,395 | 1998–2018 | 20,461 | 19,950 | 46.6 | 0.92 |
| IT | 27,017,583 | 2003–2017 | 15,035 | 14,642 | 30.0 | 0.96 |
| JP | 55,511,392 | 1995–2018 | 20,027 | 19,360 | 25.6 | 0.99 |
| CAN | 13,136,991 | 2000–2017 | 6,125 | 6,067 | 10.4 | 0.98 |
| ES | 18,270,966 | 1999–2017 | 4,892 | 4,441 | 16.6 | 0.94 |
| UK | 27,935,742 | 2001–2016 | 29,241 | 28,378 | 27.3 | 0.99 |
| US | 122,640,854 | 1999–2017 | 37,875 | 36,155 | 62.4 | 0.61 |
| PL | 16,916,318 | 1999–2018 | 2,385 | 2,358 | 10.0 | 0.98 |
| BE | 4,863,004 | 1998–2016 | 3,177 | 3,091 | 11.6 | 0.86 |
| ROK | 19,378,296 | 1995–2018 | 954 | 945 | 5.3 | 0.97 |