
Table 1
Data collection details and demographic characteristics of people who accessed the service and diseases screening in Sofala and Cabo Delgado.
| SOFALA | CABO DELGADO | TOTAL OVERALL | ||||||||
|---|---|---|---|---|---|---|---|---|---|---|
| NHAMATANDA | DONDO | BEIRA | TOTAL SOFALA PROVINCE | MONTEPUEZ | CHIÚRE | ANCUABE | TOTAL CABO DELGADO PROVINCE | |||
| Estimated population in IDP sites | 14 126 | 16 522 | 23 883 | 54 531 | 14 502 | 13 918 | 12 654 | 41 074 | 95 605 | |
| Data collection starting date | January 31st, 2021 | February 7th, 2021 | February 21st, 2021 | February 28th, 2021 | March 14th, 2021 | March 14th, 2021 | ||||
| Total weeks of data collection | 34 weeks (from Epi Week 5 to 38) | 33 weeks (from Epi Week 6 to 38) | 31 weeks (from Epi Week 8 to 38) | 30 weeks (from Epi Week 6 to 38) | 28 weeks (from Epi Week 11 to 38) | 28 weeks (from Epi Week 11 to 38) | ||||
| Total population reached | 13 259 | 16 418 | 23 882 | 53 559 | 14 416 | 13 068 | 12 460 | 39 944 | 93 503 | |
| Sex | Male | 6 097 (46.0) | 7 366 (44.9) | 11 080 (46.4) | 24 543 (45.8) | 6 654 (46.2) | 6 168 (47.2) | 5 939 (47.7) | 18 761 (47.0) | 43 304 (46.3) |
| Female | 7 162 (54.0) | 9 052 (55.1) | 12 802 (53.6) | 29 016 (54.2) | 7 762 (53.8) | 6 900 (52.8) | 6 521 (52.3) | 21 183 (53.0) | 50 199 (53.7) | |
| Age | <5 | 1 986 (15.0) | 2 668 (16.3) | 2 610 (10.9) | 7 264 (13.6) | 2 515 (17.4) | 2 160 (16.5) | 1 606 (12.9) | 6 281 (15.7) | 13 545 (14.5) |
| 5-24 | 6 140 (46.3) | 8 392 (51.1) | 11 441 (47.9) | 25 973 (48.5) | 6 032 (41.8) | 5 074 (38.8) | 5 349 (42.9) | 16 455 (41.2) | 42 428 (45.4) | |
| 25-44 | 3 101 (23.4) | 3 623 (22.1) | 7 337 (30.7) | 14 061 (26.3) | 3 345 (23.2) | 3 730 (28.5) | 3 516 (28.2) | 10 591 (26.5) | 24 652 (26.4) | |
| >44 | 2 032 (15.3) | 1 735 (10.6) | 2 494 (10.4) | 6 261 (11.7) | 2 524 (17.5) | 2 104 (16.1) | 1 989 (16.0) | 6 617 (16.6) | 12 878 (13.8) | |
| Covid-19 symptoms | Cough | 437 (3.3) | 1 031 (6.3) | 230 (1.0) | 1 698 (3.2) | 3 418 (23.7) | 3 262 (25.0) | 2 389 (19.2) | 9 069 (22.7) | 10 767 (11.5) |
| Fever | 640 (4.8) | 983 (6.0) | 142 (0.6) | 1 765 (3.3) | 3 491 (24.2) | 2 792 (21.4) | 2 524 (20.3) | 8 807 (22.0) | 10 572 (11.3) | |
| Running nose | 140 (1.1) | 406 (2.5) | 63 (0.3) | 609 (1.1) | 1 494 (10.4) | 2 340 (17.9) | 167 (1.3) | 4 001 (10.0) | 4 610 (4.9) | |
| Difficulty breathing | 96 (0.7) | 373 (2.3) | 20 (0.1) | 489 (0.9) | 1 249 (8.7) | 2 014 (15.4) | 369 (3.0) | 3 632 (9.1) | 4 121 (4.4) | |
| At least one symptom | 882 (6.7) | 1 137 (6.9) | 355 (1.5) | 2 374 (4.4) | 3 107 (21.6) | 4 272 (32.7) | 2 927 (23.5) | 10 306 (25.8) | 12 680 (13.6) | |
| Malaria | Total tested | 11 783 (88.9) | 15 822 (96.4) | 21 993 (92.1) | 49 598 (92.6) | 9 728 (67.5) | 9 320 (71.3) | 11 747 (94.3) | 30 795 (77.1) | 80 393 (86.0) |
| Positive | 416 (3.1) | 48 (0.3) | 157 (0.7) | 621 (1.2) | 999 (6.9) | 2 071 (15.8) | 514 (4.1) | 3 584 (9.0) | 4 205 (4.5) | |
| HIV | Screened | 11 475 (86.5) | 7 071 (43.1) | 23 882 (100) | 42 428 (79.2) | 13 908 (96.5) | 12 264 (93.8) | 12 464 (100) | 38 636 (96.7) | 81 064 (86.7) |
| Eligible for testing | 1 563 (11.8) | 31 (0.2) | 18 763 (78.6) | 20 357 (38.0) | 71 (0.5) | 1 139 (8.7) | 0 (0.0) | 1 210 (3.0) | 21 567 (23.1) | |
| Referred for test | 30 (0.2) | 10 (0.1) | 222 (0.9) | 262 (0.5) | 81 (0.6) | 908 (6.9) | 65 (0.5) | 1 054 (2.6) | 1 316 (1.4) | |
| Self-revealed HIV | 76 (0.6) | 791 (4.8) | 465 (1.9) | 1 332 (2.5) | 277 (1.9) | 974 (7.5) | 212 (1.7) | 1 463 (3.7) | 2 795 (3.0) | |
| Self-revealed HIV on ART | 66 (0.5) | 624 (3.8) | 465 (1.9) | 1 155 (2.2) | 252 (1.7) | 918 (7.0) | 207 (1.7) | 1 377 (3.4) | 2 532 (2.7) | |
| Malnutrition* | Screened | 1 344 (67.7) | 2 251 (84.4) | 2389 (91.5) | 5 984 (82.4) | 2 148 (85.4) | 1 926 (89.2) | 1 424 (88.7) | 5 498 (87.5) | 11 482 (84.8) |
| Malnourished | 31 (1.6) | 100 (3.7) | 33 (1.3) | 164 (2.3) | 109 (4.3) | 198 (10.3) | 386 (24.0) | 693 (11.0) | 857 (6.3) | |
| Malnourished with COVID symptoms | 27 (1.4) | 44 (1 6) | 4 (0.2) | 75 (1.0) | 44 (1.7) | 210 (0.1) | 345 (21.5) | 599 (9.5) | 674 (5.0) | |
[i] * As denominator only <5 population reached has been considered.
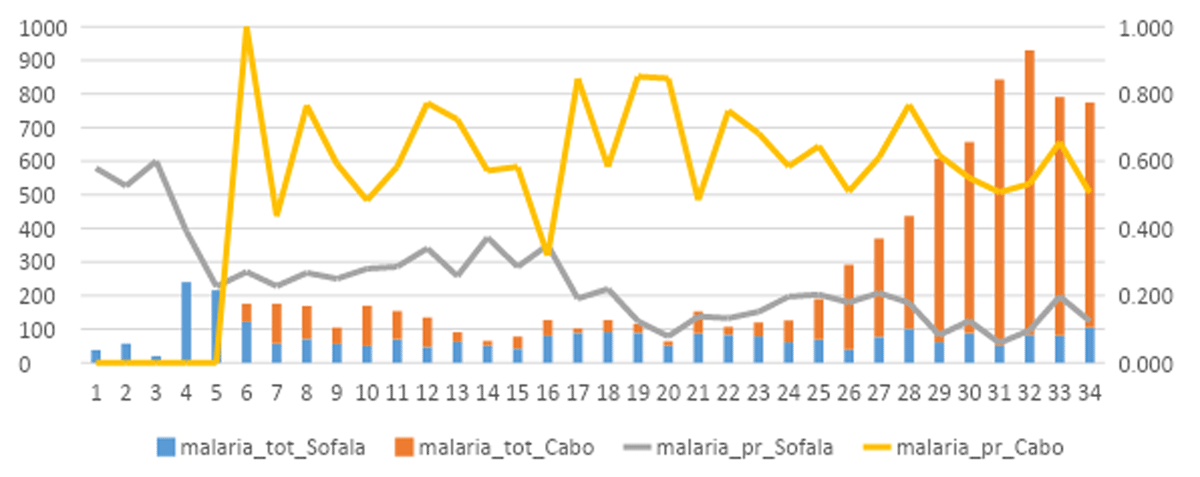
Figure 1
Total number of malaria cases and test positivity rate. Vertical bars show the total number of malaria cases diagnosed among internally-displaced people in Sofala (blue) and Cabo Delgado (orange) provinces. Continuous lines show the test-positivity rate for malaria in Sofala (grey) and Cabo Delgado (yellow) provinces during COVID-19 pandemic.
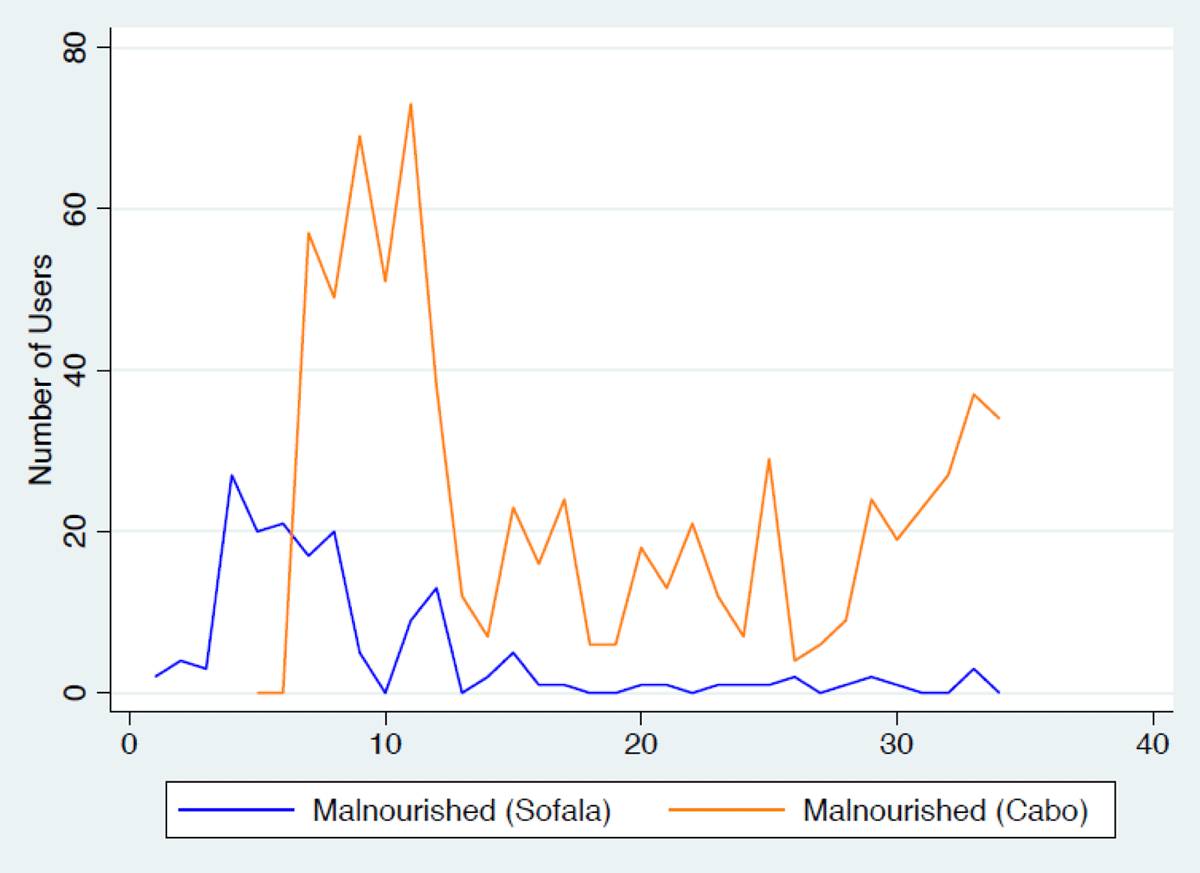
Figure 2
Total number of malnutrition cases. Total number of internally displaced children <5 diagnosed with malnutrition in Sofala (blue line) and Cabo Delgado (orange) provinces during the COVID-19 pandemic. X axis: Epi week; Y axis: number of children diagnosed with malnutrition per week.