
Table 1
General characteristics among patients with asbestosis, 2010–2014.
| VARIABLES | 2010 | 2011 | 2012 | 2013 | 2014 | PERIOD |
|---|---|---|---|---|---|---|
| Frequency rate | 2.28 | 2.76 | 1.92 | 2.04 | 3.71 | 2.20 |
| 95%, CI | 1.67–3.04 | 2.12–3.53 | 1.41–2.56 | 1.51–2.70 | 3.05–4.48 | 1.96–2.47 |
| People attended | 47 | 60 | 59 | 47 | 125 | 308 |
| Visits | 121 | 123 | 106 | 89 | 223 | 662 |
| Intensity† | 2.57 | 2.05 | 1.79 | 1.89 | 1.78 | 2.14 |
| Life stages, years | ||||||
| <1 | 0 (0.0) | 0 (0.0) | 0 (0.0) | 0 (0.0) | 0 (0.0) | 0 (0.0) |
| 1–5 | 2 (4.6) | 0 (0.0) | 0 (0.0) | 0 (0.0) | 0 (0.0) | 2 (0.66) |
| 6–9 | 0 (0.0) | 0 (0.0) | 0 (0.0) | 0 (0.0) | 0 (0.0) | 0 (0.0) |
| 10–14 | 0 (0.0) | 0 (0.0) | 0 (0.0) | 0 (0.0) | 2 (1.9) | 2 (0.66) |
| 15–18 | 1 (2.3) | 1 (1.7) | 0 (0.0) | 0 (0.0) | 7 (6.8) | 8 (2.7) |
| 19–26 | 1 (2.3) | 4 (6.8) | 0 (0.0) | 1 (2.2) | 10 (9.7) | 16 (5.4) |
| 27–44 | 13 (30.2) | 12 (20.2) | 9 (20.4) | 11 (23.9) | 26 (25.2) | 62 (21.0) |
| 45–59 | 15 (34.9) | 17 (28.8) | 14 (31.8) | 16 (34.8) | 35 (34.0) | 71 (24.1) |
| 60+ | 11 (25.6) | 25 (42.4) | 21 (47.7) | 18 (39.1) | 24 (23.3) | 99 (33.6) |
| Sex | ||||||
| Male | 39 (83.0) | 52 (86.7) | 44 (89.8) | 39 (83.0) | 80 (76.2) | 254 (82.5) |
| Female | 8 (17.0) | 8 (13.3) | 5 (10.2) | 8 (17.0) | 25 (23.8) | 54 (17.5) |
| Health insurance | ||||||
| Subsidiary | 6 (13.9) | 10 (16.9) | 6 (13.6) | 6 (13.0) | 48 (46.6) | 76 (25.8) |
| Contributory | 29 (67.4) | 43 (72.9) | 37 (84.1) | 40 (86.9) | 51 (49.5) | 200 (67.8) |
| Prepaid | 5 (11.6) | 1 (1.7) | 0 (0.0) | 0 (0.0) | 1 (0.9) | 7 (2.4) |
| Others | 3 (7.0) | 6 (10.1) | 3 (6.8) | 0 (0.0) | 4 (3.9) | 16 (5.4) |
| Geographic location | ||||||
| Urban | 29 (67.4) | 44 (74.6) | 34 (77.3) | 36 (78.3) | 64 (62.1) | 207 (70.2) |
| Rural | 3 (7.0) | 2 (3.4) | 1 (2.3) | 1 (2.2) | 18 (17.5) | 25 (8.5) |
| Clinical setting | ||||||
| Private clinics | 33 (76.7) | 43 (72.9) | 32 (72.7) | 35 (76.1) | 55 (53.4) | 198 (67.1) |
| Public hospitals | 10 (23.2) | 16 (27.1) | 9 (20.4) | 7 (15.2) | 47 (45.6) | 89 (30.2) |
| Health service provided | ||||||
| Ambulatory | 36 (83.7) | 49 (83.0) | 39 (88.6) | 40 (86.9) | 95 (92.2) | 259 (87.8) |
| Procedure | 9 (20.9) | 13 (22.0) | 7 (15.9) | 6 (13.0) | 16 (15.5) | 51 (17.3) |
| Emergencies | 1 (2.3) | 6 (10.1) | 2 (4.6) | 3 (6.5) | 2 (1.9) | 14 (4.7) |
| In-hospital | 2 (4.6) | 5 (8.5) | 1 (2.3) | 1 (2.3) | 3 (2.9) | 12 (4.1) |
[i] Note: Frequency rate is per million people (cFr). Intensity: visits/patients assisted ratio.
Table 2
General characteristics among people attended by asbestosis, 2015–2019.
| VARIABLES | 2015 | 2016 | 2017 | 2018 | 2019 | PERIOD |
|---|---|---|---|---|---|---|
| Frequency rate | 2.50 | 2.44 | 3.14 | 2.61 | 4.70 | 3.14 |
| 95%, CI | 1.93–3.18 | 1.86–3.15 | 2.53–3.87 | 2.09–3.22 | 4.04–5.45 | 2.92–3.50 |
| Patients assisted | 62 | 55 | 85 | 83 | 172 | 457 |
| Visits | 187 | 148 | 160 | 189 | 237 | 921 |
| Intensity† | 3.02 | 2.69 | 1.88 | 2.28 | 1.38 | 2.02 |
| Life cycle, years | ||||||
| <1 | 0 (0.0) | 0 (0.0) | 0 (0.0) | 0 (0.0) | 0 (0.0) | 0 (0.0) |
| 1–5 | 0 (0.0) | 0 (0.0) | 0 (0.0) | 0 (0.0) | 0 (0.0) | 0 (0.0) |
| 6–9 | 0 (0.0) | 0 (0.0) | 0 (0.0) | 0 (0.0) | 0 (0.0) | 0 (0.0) |
| 10–14 | 0 (0.0) | 0 (0.0) | 0 (0.0) | 0 (0.0) | 0 (0.0) | 0 (0.0) |
| 15–18 | 1 (1.6) | 0 (0.0) | 0 (0.0) | 0 (0.0) | 3 (1.7) | 4 (0.9) |
| 19–26 | 4 (6.5) | 1 (1.8) | 2 (2.4) | 5 (6.0) | 10 (5.8) | 22 (4.8) |
| 27–44 | 19 (30.6) | 11 (20.0) | 12 (14.1) | 17 (20.5) | 39 (22.7) | 98 (21.4) |
| 45–59 | 14 (22.6) | 18 (32.7) | 33 (38.8) | 21 (25.3) | 40 (23.3) | 126 (27.6) |
| 60+ | 24 (38.7) | 25 (45.5) | 38 (44.7) | 41 (49.4) | 81 (47.1) | 209 (45.7) |
| Sex | ||||||
| Male | 51 (82.3) | 51 (92.7) | 79 (92.9) | 69 (83.1) | 107 (62.2) | 357 (78.1) |
| Female | 11 (17.7) | 4 (7.3) | 6 (7.1) | 14 (16.9) | 65 (37.8) | 100 (21.9) |
| Health insurance | ||||||
| Subsidiary | 1 (1.6) | 11 (20.0) | 9 (10.6) | 19 (22.9) | 95 (55.2) | 135 (29.5) |
| Contributory | 43 (69.4) | 41 (74.5) | 73 (85.9) | 64 (77.1) | 75 (43.6) | 296 (64.8) |
| Pre-paid | 1 (1.6) | 1 (1.8) | 2 (2.4) | 0 (0.0) | 1 (0.6) | 5 (1.1) |
| Others | 17 (27.4) | 3 (5.5) | 1 (1.2) | 0 (0.0) | 2 (1.2) | 23 (5.0) |
| Geographic place | ||||||
| Urban | 46 (74.2) | 36 (65.5) | 65 (76.5) | 65 (78.3) | 149 (86.6) | 361 (79.0) |
| Rural | 5 (8.1) | 5 (9.1) | 5 (5.9) | 9 (10.8) | 13 (7.6) | 37 (8.1) |
| Clinical settings | ||||||
| Private clinics | 44 (71.0) | 42 (76.4) | 70 (82.4) | 67 (80.7) | 95 (55.2) | 318 (69.6) |
| Public hospitals | 18 (29.0) | 9 (16.4) | 13 (15.3) | 17 (20.5) | 55 (32.0) | 105 (23.0) |
| Health service provided | ||||||
| Ambulatory | 55 (88.7) | 52 (94.5) | 78 (91.8) | 71 (85.5) | 90 (52.3) | 346 (75.7) |
| Procedure | 14 (22.6) | 15 (27.3) | 19 (22.4) | 25 (30.1) | 95 (55.2) | 168 (36.8) |
| Emergencies | 1 (1.6) | 3 (5.5) | 2 (2.4) | 1 (1.2) | 0 (0.0) | 7 (1.5) |
| In-Hospital | 2 (3.2) | 1 (1.8) | 0 (0.0) | 0 (0.0) | 1 (0.6) | 4 (0.9) |
[i] Note: Frequency is rate per million people. Intensity: visits/patients assisted ratio.
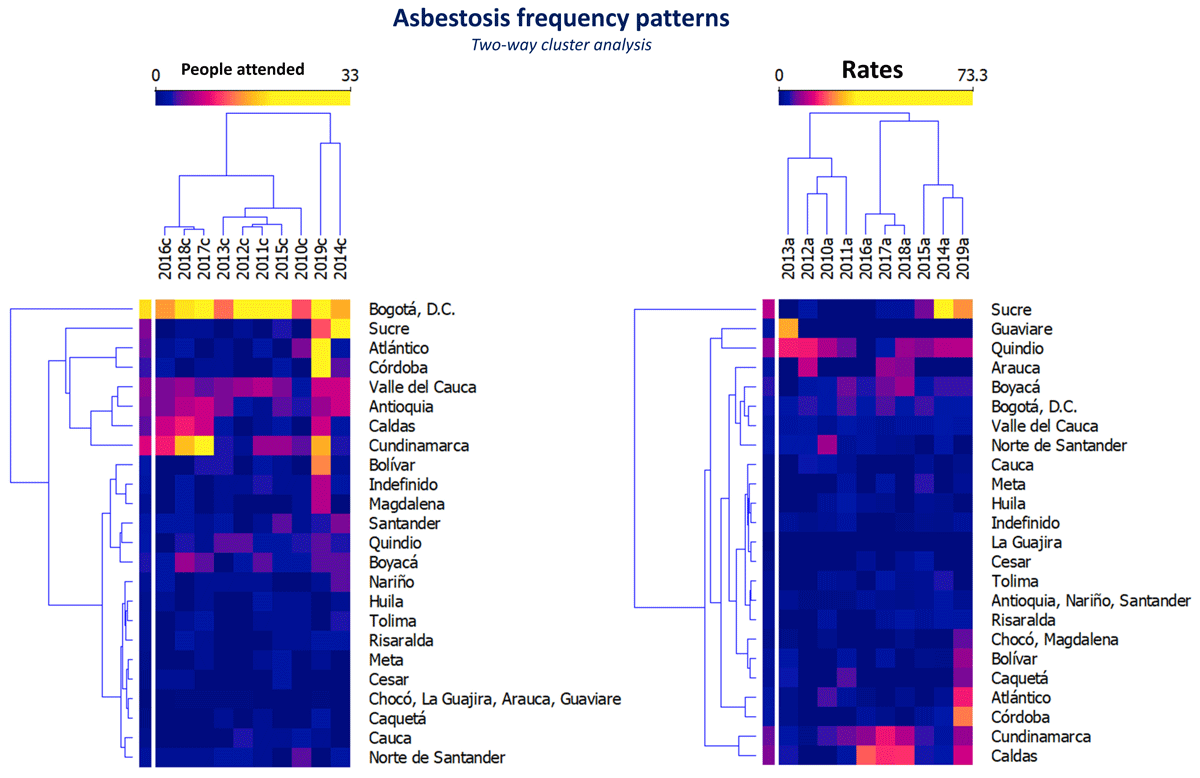
Figure 1
Asbestosis frequency grouped by year and department.
Two dendrograms in two-way cluster analysis are presented (years of study, departments of Colombia). On the left, they are grouped by occurrence among people attended by asbestosis, and on the right, they are grouped by cFr rate (per million people).
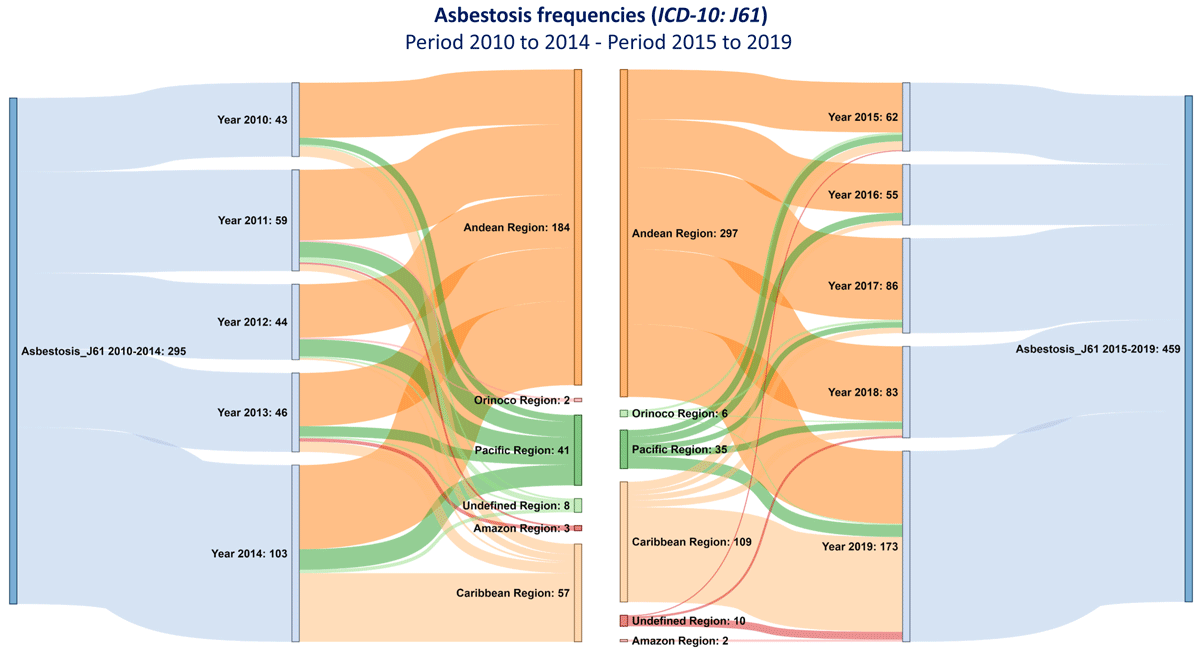
Figure 2
Annual and five-year occurrence of asbestosis in Colombian geopolitical regions.
The occurrence among people attended by asbestosis is presented by the study periods 2010–2014 (left) and 2015–2019 (right) and by geopolitical regions.
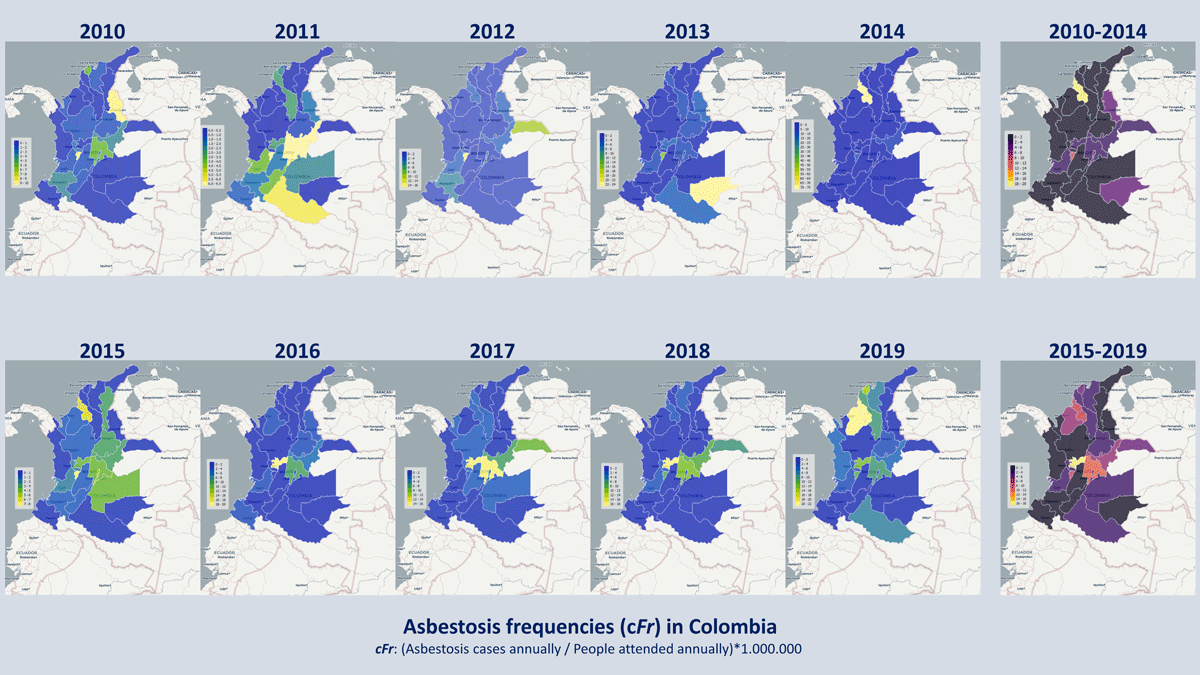
Figure 3
Annual and five-year dynamics of the frequency of asbestosis by departments of Colombia.
Choropleth maps of the estimated frequency of asbestosis are presented in each period studied, in the upper half for the period 2010–2014 and in the lower half for the period 2015–2019.
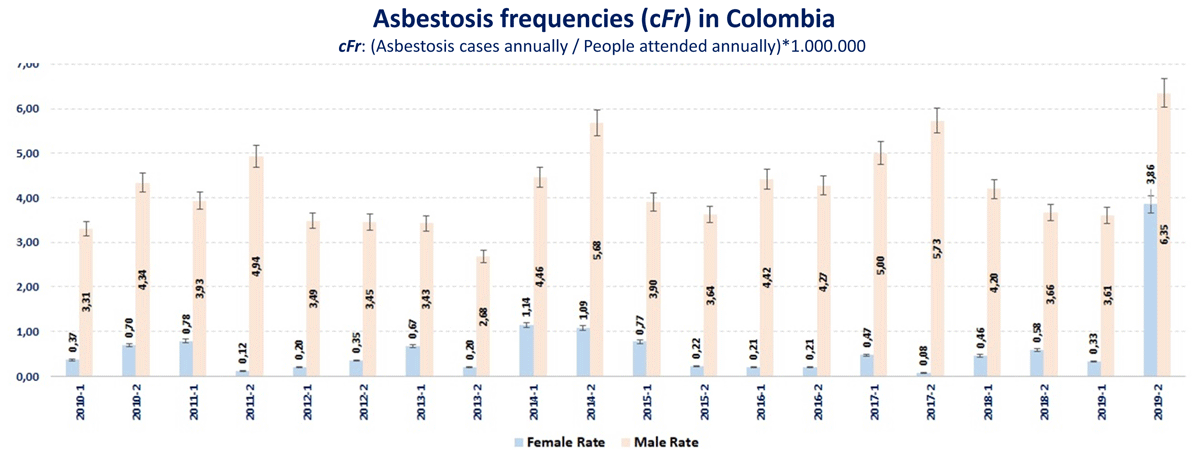
Figure 4
Semiannually estimated cFr of asbestosis by sex.
The crude cFr among people attended by asbestosis (y-axis) is compared between men and women on a six-monthly basis (x-axis). A cyclical behavior is observed in both men and women, and in all semesters the crude cFr among people attended by asbestosis was higher in men.
Table 3
Sociodemographic characteristics and risk of asbestosis in the period 2015–2019.
| PERIOD | PEOPLE ATTENDED BY ASBESTOSIS | PEOPLE ATTENDED | cFr (95%, CI) | cFr RATIO (95%, CI) |
|---|---|---|---|---|
| 2010–2014 | ||||
| Sex | ||||
| Male | 254 | 63.192.758 | 4.02 (3.59–4.54) | Ref. |
| Female | 54 | 92.580.322 | 0.58 (0.44–0.75) | Ref. |
| Region | ||||
| Andean | 184 | 64.383.129 | 2.85 (2.47–3.29) | Ref. |
| Caribbean | 57 | 21.852.007 | 2.60 (1.99–3.35) | Ref. |
| Pacific | 41 | 18.096.041 | 2.27 (1.65–3.04) | Ref. |
| Orinoco | 2 | 2.698.003 | 0.74 (0.12–2.44) | Ref. |
| Amazon | 3 | 1.109.908 | 2.70 (0.68–7.36) | Ref. |
| Geographic place | ||||
| Urban | 207 | 75.541.454 | 2.74 (2.38–3.13) | Ref. |
| Rural | 25 | 13.154.729 | 1.90 (1.25–2.76) | Ref. |
| Life cycle, years | ||||
| 0–9 | 2 | 23.160.474 | 0.09 (0.01–0.28) | Ref. |
| 10–18 | 10 | 17.396.011 | 0.57 (0.29–1.02) | Ref. |
| 19–44 | 78 | 41.798.537 | 1.87 (1.48–232) | Ref. |
| 45–59 | 71 | 17.884.745 | 3.97 (3.12–4.98) | Ref. |
| 60+ | 99 | 14.440.953 | 6.85 (5.60–8.31) | Ref. |
| 2015–2019 | ||||
| Sex | ||||
| Male | 384 | 84.889.904 | 4.52 (4.09–4.99) | 1.12 (0.96–1.32) |
| Female | 101 | 120.576.485 | 0.84 (0.69–1.01) | 1.44 (1.03–2.01) |
| Region | ||||
| Andean | 297 | 64.234.231 | 4.62 (4.12–5.17) | 1.61 (1.35–1.95) |
| Caribbean | 109 | 25.188.798 | 4.33 (3.57–5.20) | 1.66 (1.21–2.30) |
| Pacific | 35 | 16.593.009 | 2.11 (1.49–2.90) | 0.93 (0.59–1.46) |
| Orinoco | 6 | 2.265.331 | 2.65 (1.07–5.50) | 3.57 (0.76–25.7) |
| Amazon | 2 | 965.220 | 2.07 (0.35–6.85) | 0.77 (0.09–5.15) |
| Geographic place | ||||
| Urban | 361 | 106.004.217 | 3.40 (3.06–3.77) | 1.24 (1.05–1.48) |
| Rural | 37 | 19.009.660 | 1.94 (1.39–2.65) | 1.02 (0.61–1.72) |
| Life cycle, years | ||||
| 0–9 | 0 | 27.611.772 | – | – |
| 10–18 | 4 | 20.798.824 | 0.19 (0.06–0.46) | 0.33 (0.09–1.04) |
| 19–44 | 120 | 52.352.834 | 2.29 (1.91–2.73) | 1.23 (0.92–1.64) |
| 45–59 | 126 | 23.746.715 | 5.31 (4.44–6.30) | 1.34 (1.001–1.79) |
| 60+ | 209 | 21.279.942 | 9.82 (8.56–11.2) | 1.43 (1.13–1.83) |
[i] Note: The estimated cFr in the 2010–2014 period were used as a reference (Ref.) to estimate the cFr ratio.