
Table 1
Obstetric danger signs included in questionnaire, based on the WHO Guide for Essential Practice.
| PREGNANCY | LABOR AND DELIVERY | POSTPARTUM (<48H AFTER DELIVERY) |
|---|---|---|
| Vaginal Bleeding Vomiting Severe Abdominal Pain Swelling of Face or Legs Blurry Vision No Fetal Movement High Blood Pressure Convulsions (seizure) Severe Headache High Fever Difficulty Breathing | Heavy Bleeding Vaginal Bleeding Labor for >12 hours Abnormal Fetal Position Shoulder Dystocia Severe Headache Retained Placenta High Fever | Vaginal Bleeding Abdominal Pain Blurred Vision High Fever Too Weak to Get Out of Bed Smelly Vaginal Discharge Fast or Difficult Breathing Convulsions Breasts Swollen, Red, or Sore |
Table 2
Sociodemographic characteristics and factors related to most recent pregnancy of surveyed women (n = 100).
| TOTAL (n) | ||
|---|---|---|
| Nationality | Gambian Citizen | 91 |
| Non-Gambian Citizen | 8 | |
| Age | <18 | 0 |
| 18–24 | 25 | |
| 25–29 | 28 | |
| 30–39 | 39 | |
| 40–49 | 8 | |
| >50 | 0 | |
| Marital Status | Single, never married | 4 |
| Married | 92 | |
| Divorced | 3 | |
| Widowed | 1 | |
| Education Level | Do not read or write | 13 |
| Less than high school | 33 | |
| Completed high school | 15 | |
| Arabic School | 22 | |
| College | 17 | |
| Professional School | 7 | |
| Graduate School | 1 | |
| Monthly Income | Less than D 5,000 | 27 |
| D 5,000–D 10,000 | 59 | |
| D 10,001–D 15,000 | 9 | |
| More than D 15,000 | 4 | |
| Residence | Urban | 72 |
| Rural | 28 | |
| Gravidity | G1 | 19 |
| G2 | 13 | |
| G3 | 19 | |
| G4 | 18 | |
| G5 | 14 | |
| G > 5 | 17 | |
| Delivery Location | Hospital | 56 |
| Health Center | 34 | |
| At home with healthcare supervision | 6 | |
| Traditional Birth Attendant | 3 | |
| At home unsupervised | 1 | |
| Delivery Method | Vaginal Delivery | 74 |
| Elective C-Section | 25 | |
| Emergency C-Section | 1 |
Table 3
Reported barriers to healthcare access reported by women, and percentage of women experiencing barrier.
| REPORTED BARRIERS TO HEALTHCARE ACCESS | PERCENTAGE OF PARTICIPANTS EXPERIENCING BARRIER |
|---|---|
| Time | 7% |
| Location (Healthcare facility too far away) | 56% |
| Lack of transportation method | 20% |
| Lack of money for taxi | 26% |
| Lack of health insurance/referral | 91% |
| Inability to afford the obstetrics visit | 16% |
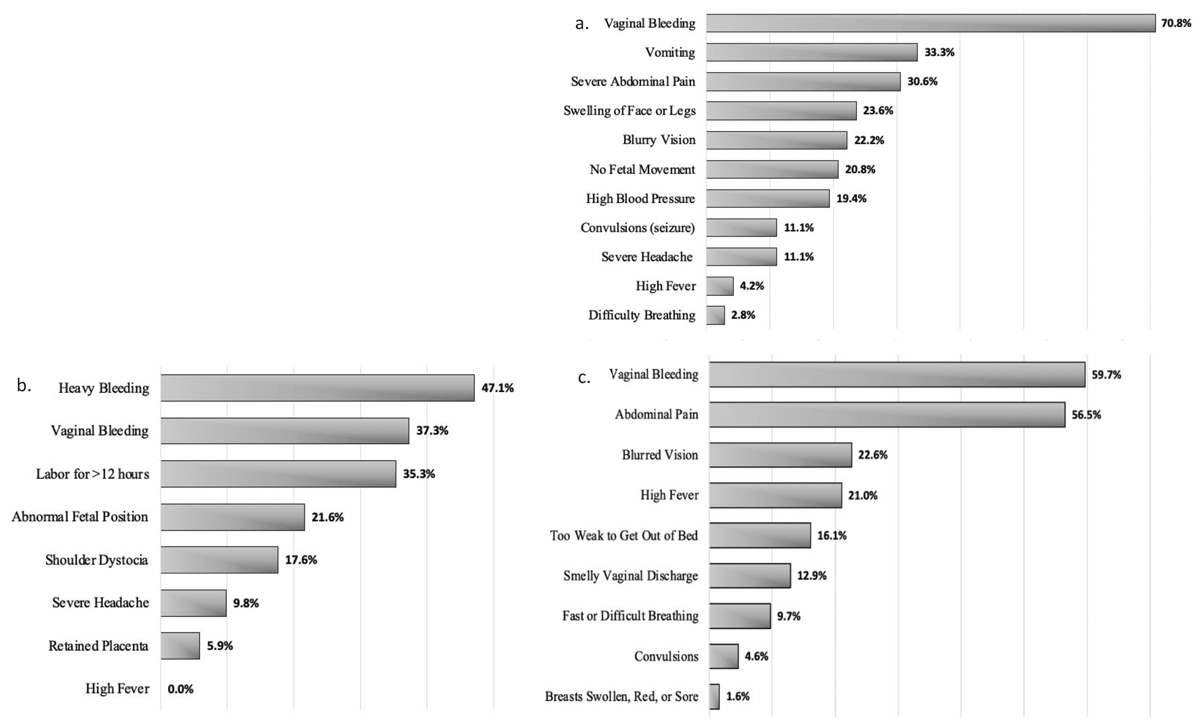
Figure 1
Recall of danger signs during (a.) pregnancy (n = 100), (b.) labor and delivery (n = 100), (c.) postpartum (n = 100).
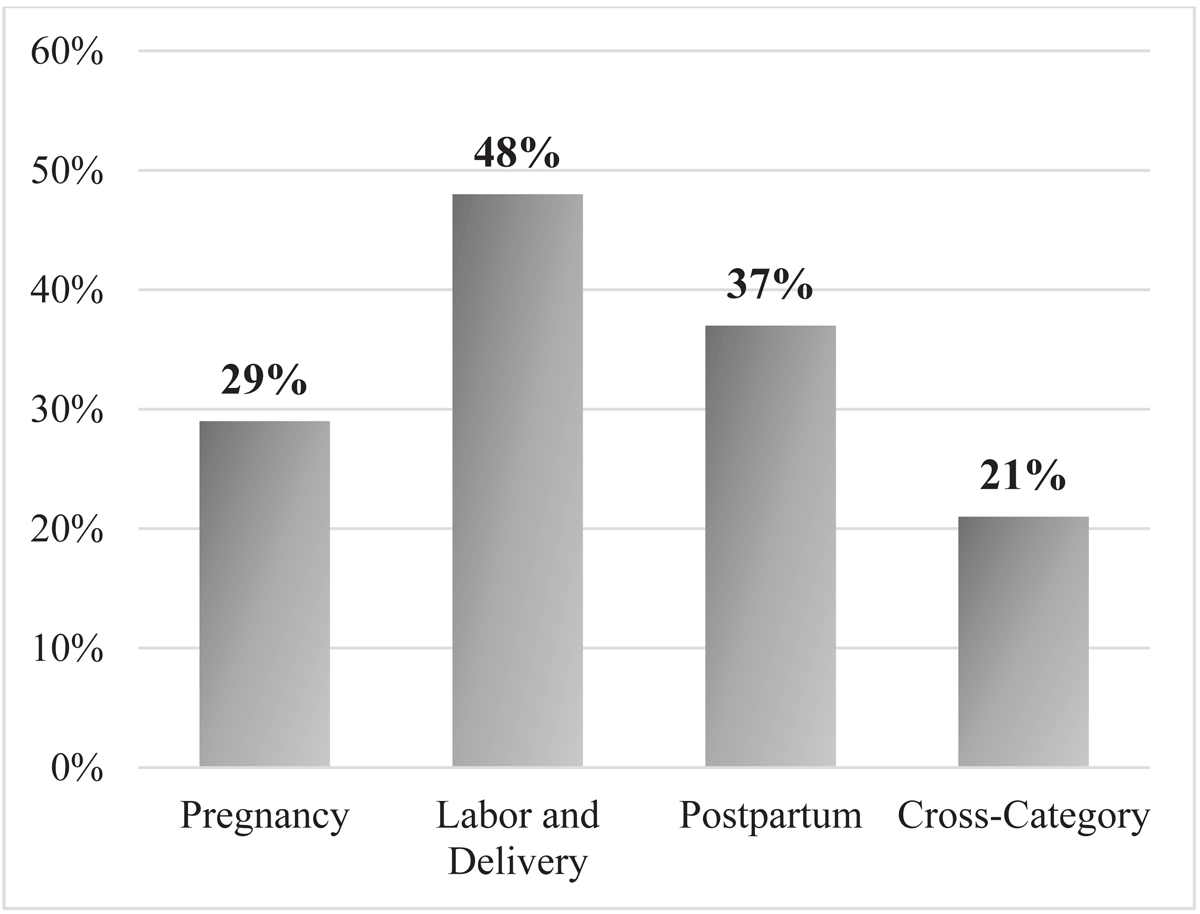
Figure 2
Percentage of women who could not spontaneously recall any danger signs.
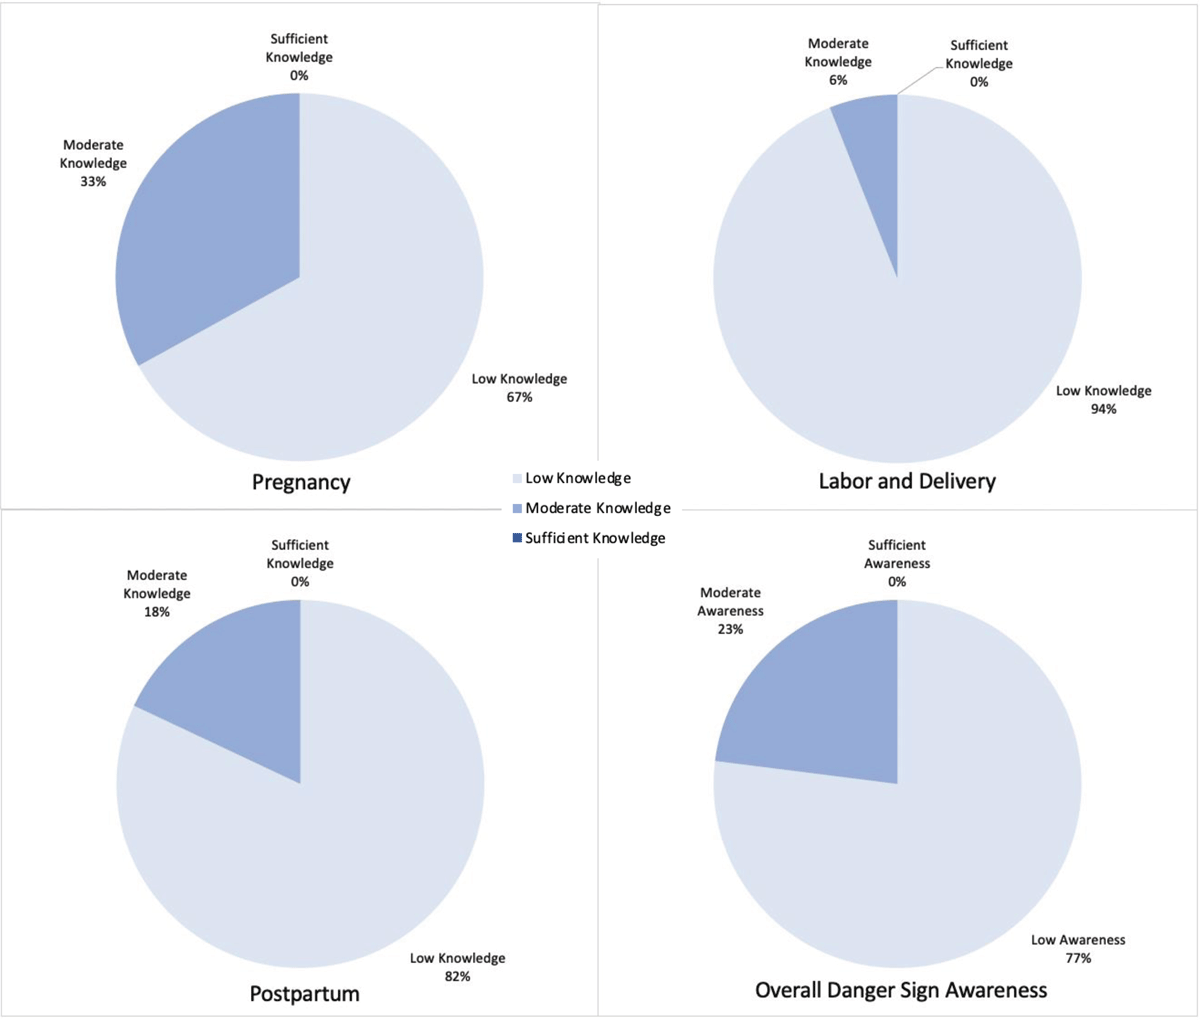
Figure 3
Knowledge of danger signs during a) pregnancy (n = 100); b) labor and delivery (n = 100); and c) postpartum (n = 100), and d) Overall cross-category danger sign awareness of surveyed women (n = 100).
Table 4
Sociodemographic factors associated with cross-category knowledge of danger signs and overall awareness score.
| n | p VALUE (OVERALL DANGER SIGN RECALL) | SPEARMAN RANK COEFFICIENT (ρ) (OVERALL DANGER SIGN RECALL) | p VALUE (OVERALL AWARENESS LEVEL) | SPEARMAN RANK COEFFICIENT (ρ) (OVERALL AWARENESS LEVEL) | ||
|---|---|---|---|---|---|---|
| Age | <18 | 0 | 0.179 | 0.136 | 0.198 | 0.123 |
| 18–24 | 25 | |||||
| 25–29 | 28 | |||||
| 30–39 | 39 | |||||
| 40–49 | 8 | |||||
| >50 | 0 | |||||
| Education Level | Do not read or write | 13 | 0.015* | 0.243 | 0.008* | 0.265 |
| Less than high school | 33 | |||||
| Completed high school/Arabic School | 37 | |||||
| College/Professional School/Graduate School | 17 | |||||
| Monthly Income | Less than D 5,000 | 27 | 0.136 | 0.151 | 0.002* | 0.311 |
| D ≥ 5,000 | 72 | |||||
| Gravidity | G1 | 19 | 0.316 | 0.101 | 0.615 | 0.051 |
| G2 | 13 | |||||
| G3+ | 68 |
[i] * Significant values indicated by boldface type and asterisk.
Some categories were combined for logistical regression based on category size and observed outcomes.
Table 5
Odds of having awareness based on sociodemographic factors.
| n | OR (95% CI) FOR KNOWLEDGE ABOUT DANGER SIGNS OF PREGNANCY | OR (95% CI) FOR KNOWLEDGE ABOUT DANGER SIGNS OF LABOR & DELIVERY | OR (95% CI) FOR KNOWLEDGE ABOUT DANGER SIGNS OF POSTPARTUM | OR (95% CI) FOR OVERALL KNOWLEDGE ABOUT DANGER SIGNS | ||
|---|---|---|---|---|---|---|
| Age | <18 | 0 | 1.0 | 1.0 | 1.0 | 1.0 |
| 18–24 | 25 | ** | ** | ** | ** | |
| 25–29 | 28 | ** | ** | ** | ** | |
| 30–39 | 39 | ** | ** | ** | ** | |
| 40–49 | 8 | ** | ** | ** | ** | |
| >50 | 0 | N/A | N/A | N/A | N/A | |
| Education Level | Do not read or write | 13 | 1.0 | 1.0 | 1.0 | 1.0 |
| Less than high school | 33 | 3.84 (0.60, 75.46) | ** | ** | 1.66 (0.22, 34.17)† | |
| Completed high school/Arabic school | 37 | 9.14 (1.55, 175.35)* | ** | ** | 5.76 (0.96, 111.12)† | |
| College/Professional/Graduate School | 17 | 10.67 (1.55, 217.04)* | ** | ** | 6.55 (0.92, 134.21)† | |
| Monthly Income | Less than D 5,000 | 27 | 1.0 | 1.0 | 1.0 | 1.0 |
| D ≥5,000 | 72 | 3.88 (1.32, 14.26)* | ** | ** | 5.14 (1.36, 33.78)* | |
| Gravidity | G1 | 19 | 1.0 | 1.0 | 1.0 | 1.0 |
| G2 | 13 | 13.60 (2.49, 112.83)* | ** | ** | ** | |
| G3+ | 68 | 4.13 (1.03, 27.88)* | ** | ** | ** |
[i] * Significant at p < 0.05.
† Indicates almost significant tendency, p = 0.052.
** P-value of the variable was greater than 0.05 which was not a candidate for logistic regression.
Some categories were combined for logistical regression analysis based on category size and observed outcomes.
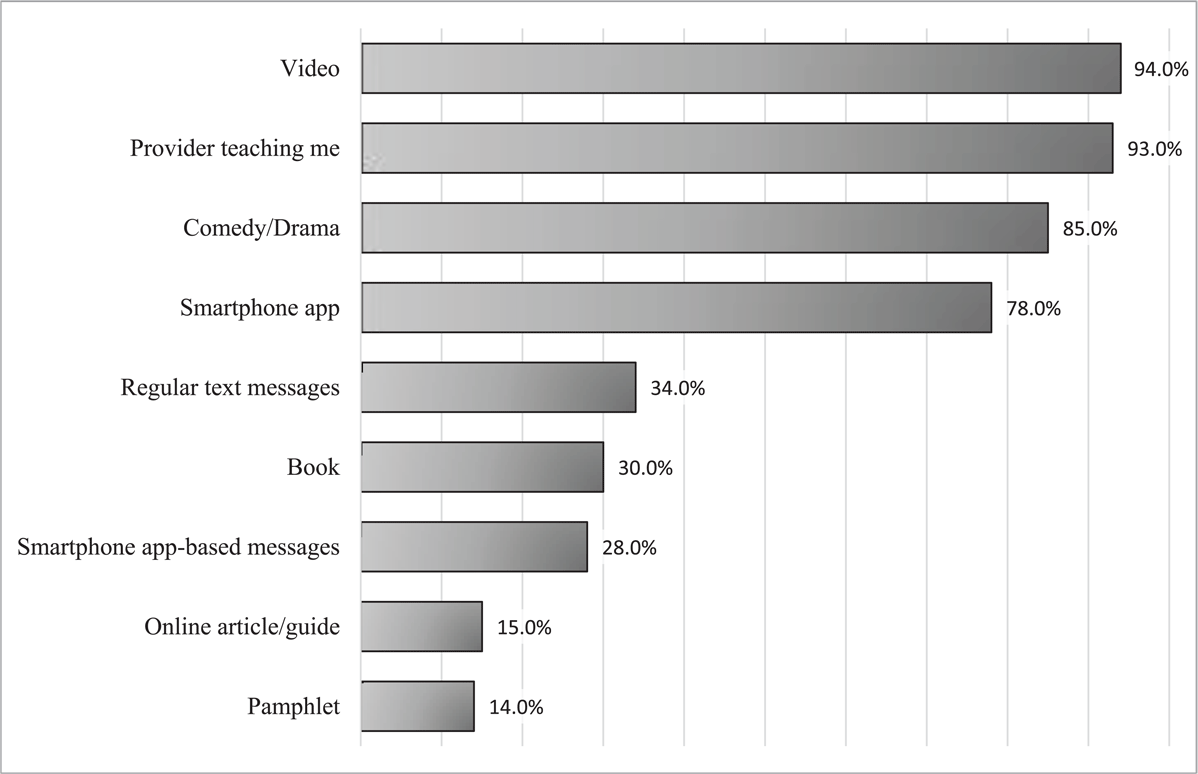
Figure 4
Danger sign education delivery method preferences among surveyed women.
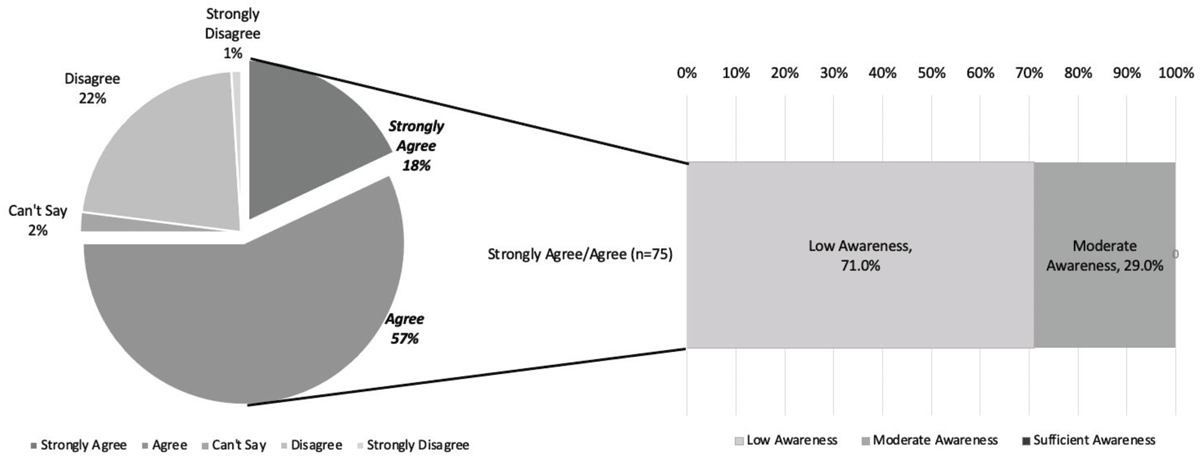
Figure 5
Self-perception of danger sign awareness vs. reality of graded awareness on danger sign recall. (a.) Breakdown of self-rating of “sufficient” awareness on Likert scale of question “I believe that I have sufficient knowledge of the danger signs that can occur during pregnancy.” (b.) Graded awareness for women who responded, “strongly agree” and “agree.”