
Supporting Table 1
Summary of Counties by Variables Analysed.
| COUNTY | DENTISTS | COHOS | DTS | OHW (ALL) | DENTAL FACILITIES | POP. DENSITY (PER KM2) | DENTIST: POP. RATIO | URBANISATION (%) |
|---|---|---|---|---|---|---|---|---|
| BARINGO | 3 | 6 | 1 | 10 | 4 | 50.44 | 185187 | 11 |
| BOMET | 3 | 3 | 1 | 7 | 4 | 293.04 | 243376 | 15 |
| BUNGOMA | 5 | 4 | 3 | 12 | 6 | 453.49 | 275013 | 22 |
| BUSIA | 2 | 3 | 1 | 6 | 4 | 438.9 | 371973 | 16 |
| ELGEYO | 2 | 1 | 1 | 4 | 1 | 122.12 | 184999 | 14 |
| EMBU | 7 | 1 | 1 | 9 | 3 | 183.18 | 73745 | 16 |
| GARISSA | 3 | 0 | 1 | 4 | 1 | 14.1 | 207687 | 24 |
| HOMA BAY | 2 | 2 | 1 | 5 | 2 | 302.77 | 481897 | 14 |
| ISIOLO | 1 | 1 | 0 | 2 | 1 | 5.66 | 143294 | 44 |
| KAJIADO | 6 | 2 | 2 | 10 | 4 | 31.38 | 114552 | 41 |
| KAKAMEGA | 7 | 1 | 3 | 11 | 2 | 544.26 | 237236 | 15 |
| KERICHO | 7 | 3 | 2 | 12 | 4 | 305.91 | 107485 | 39 |
| KIAMBU | 29 | 6 | 6 | 41 | 17 | 638.23 | 55975 | 61 |
| KILIFI | 8 | 2 | 3 | 13 | 5 | 88.01 | 138717 | 26 |
| KIRINYAGA | 5 | 2 | 2 | 9 | 3 | 357.01 | 105611 | 16 |
| KISII | 5 | 2 | 1 | 8 | 3 | 874.58 | 230456 | 22 |
| KISUMU | 17 | 2 | 3 | 22 | 8 | 464.5 | 56995 | 52 |
| KITUI | 3 | 4 | 2 | 9 | 3 | 33.21 | 337570 | 14 |
| KWALE | 2 | 2 | 1 | 5 | 2 | 78.59 | 324966 | 18 |
| LAIKIPIA | 4 | 1 | 1 | 6 | 3 | 42.19 | 99807 | 25 |
| LAMU | 1 | 1 | 0 | 2 | 1 | 16.19 | 101539 | 20 |
| MACHAKOS | 14 | 5 | 4 | 23 | 4 | 176.96 | 78470 | 52 |
| MAKUENI | 4 | 4 | 1 | 9 | 4 | 110.45 | 221132 | 12 |
| MANDERA | 0 | 1 | 0 | 1 | 1 | 39.47 | 0 | 18 |
| MARSABIT | 1 | 2 | 0 | 3 | 2 | 4.1 | 291166 | 22 |
| MERU | 7 | 6 | 2 | 15 | 6 | 195.54 | 193757 | 12 |
| MIGORI | 1 | 2 | 1 | 4 | 1 | 353.24 | 917170 | 34 |
| MOMBASA | 41 | 4 | 4 | 49 | 24 | 4292.09 | 22912 | 100 |
| MURANGA | 5 | 3 | 1 | 9 | 3 | 368.37 | 188516 | 16 |
| NAIROBI | 348 | 18 | 25 | 391 | 148 | 4514.96 | 9018 | 100 |
| NAKURU | 23 | 7 | 7 | 37 | 12 | 213.92 | 69710 | 46 |
| NANDI | 4 | 1 | 0 | 5 | 2 | 261.07 | 188241 | 14 |
| NAROK | 1 | 1 | 1 | 3 | 1 | 47.45 | 850920 | 7 |
| NYAMIRA | 1 | 0 | 0 | 1 | 1 | 665.22 | 598252 | 14 |
| NYANDARUA | 4 | 2 | 3 | 9 | 1 | 183.74 | 149067 | 19 |
| NYERI | 22 | 3 | 4 | 29 | 13 | 207.83 | 31525 | 25 |
| SAMBURU | 1 | 0 | 0 | 1 | 1 | 10.65 | 223947 | 17 |
| SIAYA | 3 | 3 | 1 | 7 | 4 | 332.88 | 280768 | 11 |
| TAITA | 3 | 3 | 2 | 8 | 3 | 16.66 | 94886 | 23 |
| TANA RIVER | 1 | 1 | 0 | 2 | 2 | 6.25 | 240075 | 15 |
| THARAKA | 3 | 2 | 0 | 5 | 3 | 138.44 | 121777 | 7 |
| TRANS NZOIA | 3 | 1 | 2 | 6 | 2 | 328.09 | 272919 | 20 |
| TURKANA | 0 | 1 | 1 | 2 | 1 | 12.45 | 0 | 14 |
| UASIN GISHU | 42 | 16 | 15 | 73 | 13 | 267.3 | 21290 | 39 |
| VIHIGA | 2 | 1 | 0 | 3 | 1 | 1044.68 | 277311 | 31 |
| WAJIR | 0 | 0 | 0 | 0 | 0 | 11.68 | 0 | 15 |
| WEST POKOT | 2 | 1 | 1 | 4 | 2 | 55.91 | 256345 | 8 |
| KENYA | 658 | 137 | 111 | 906 | 337 | 66 | 52388 | 32.3 |
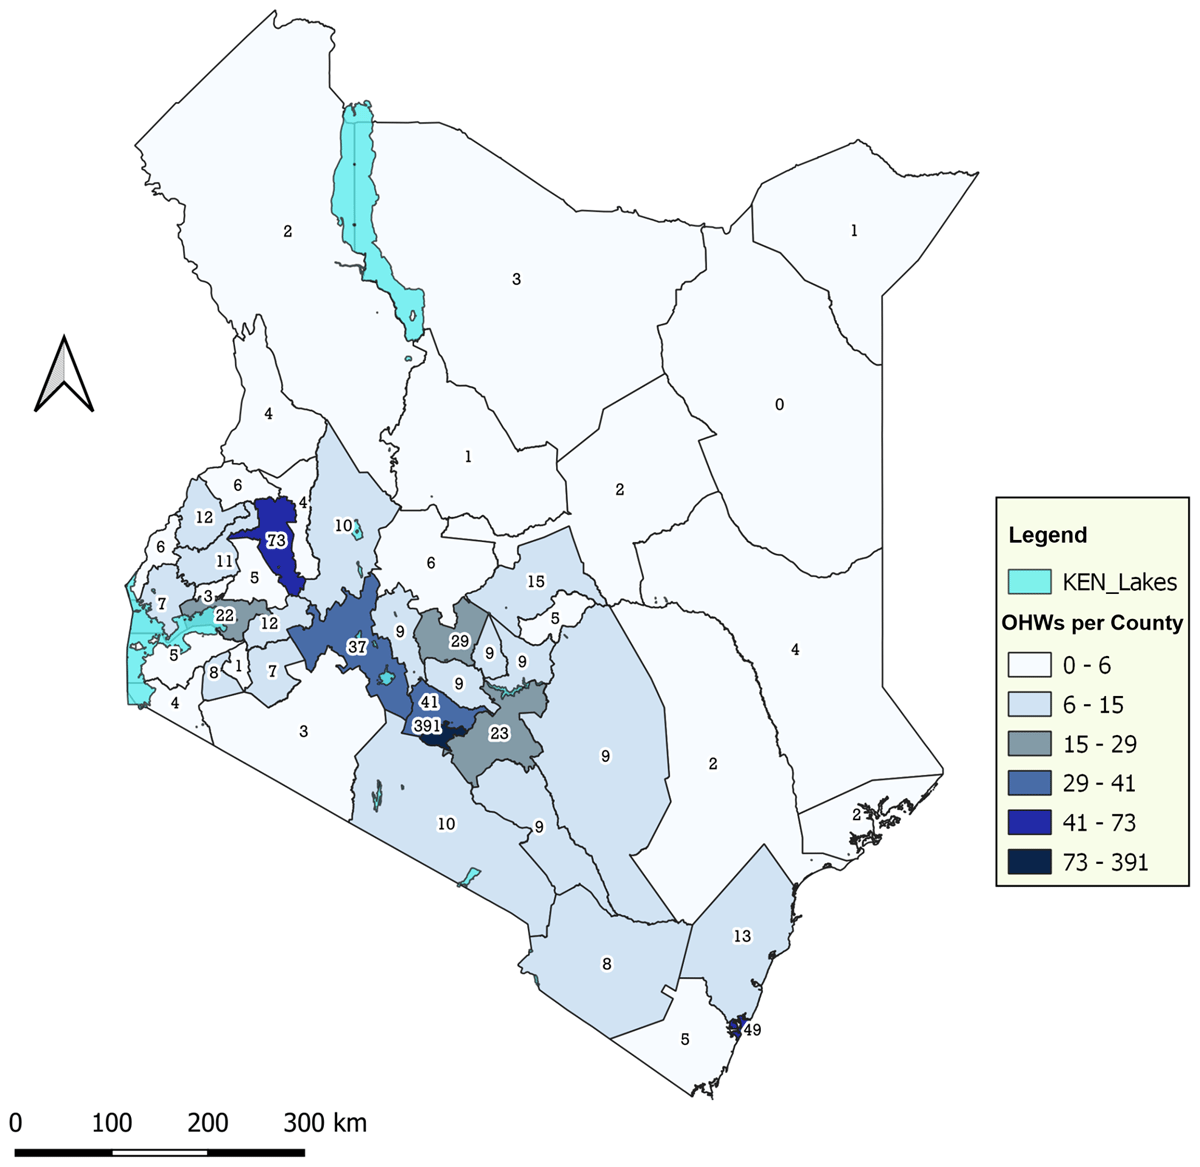
Figure 1
The number of oral health workers per county.
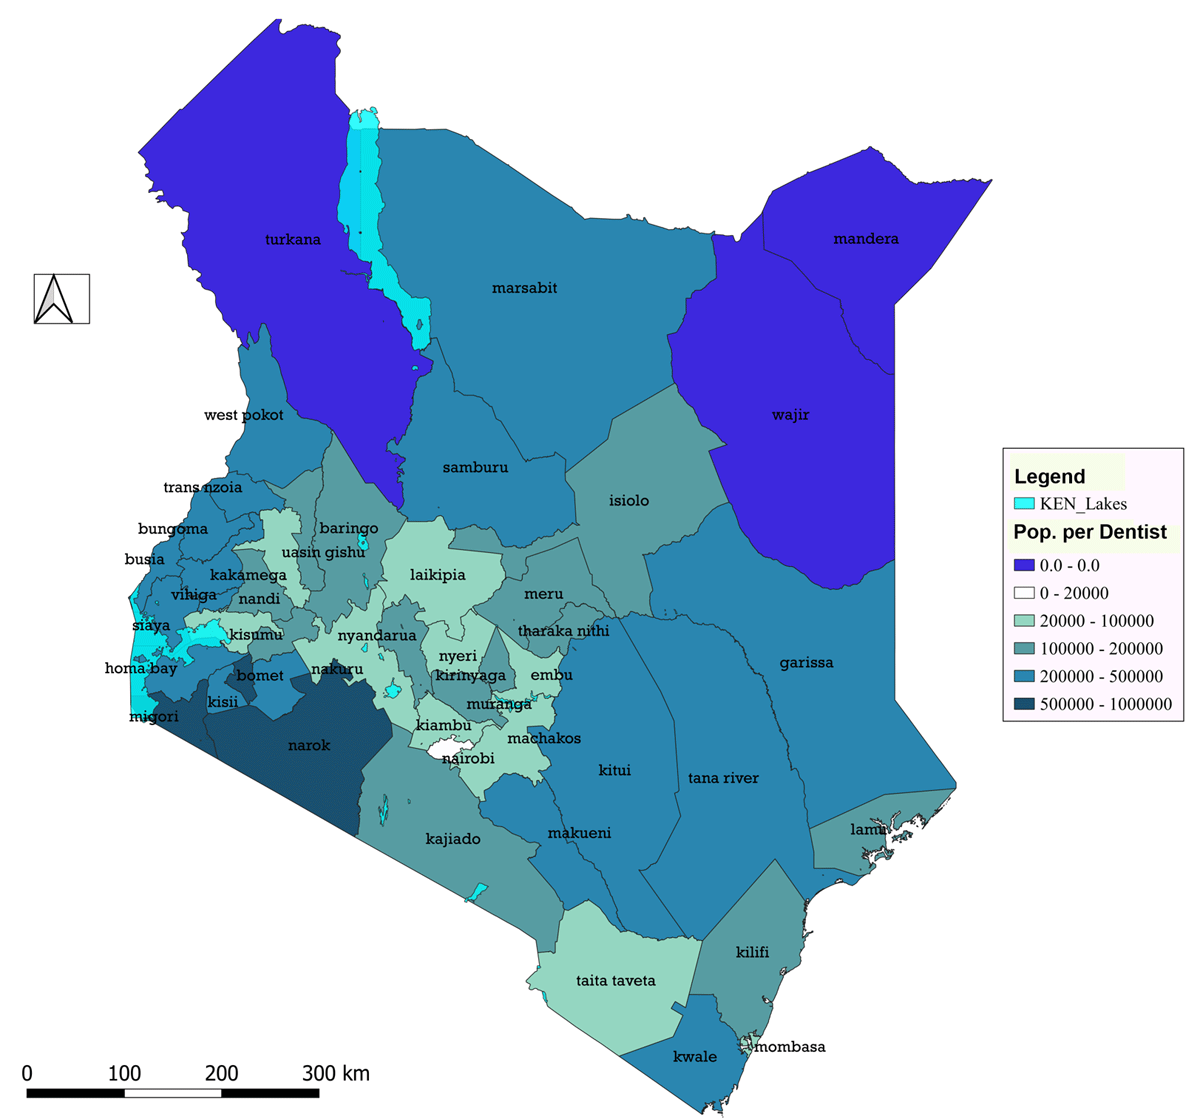
Figure 2
The dentist to population ratio in Kenyan counties.
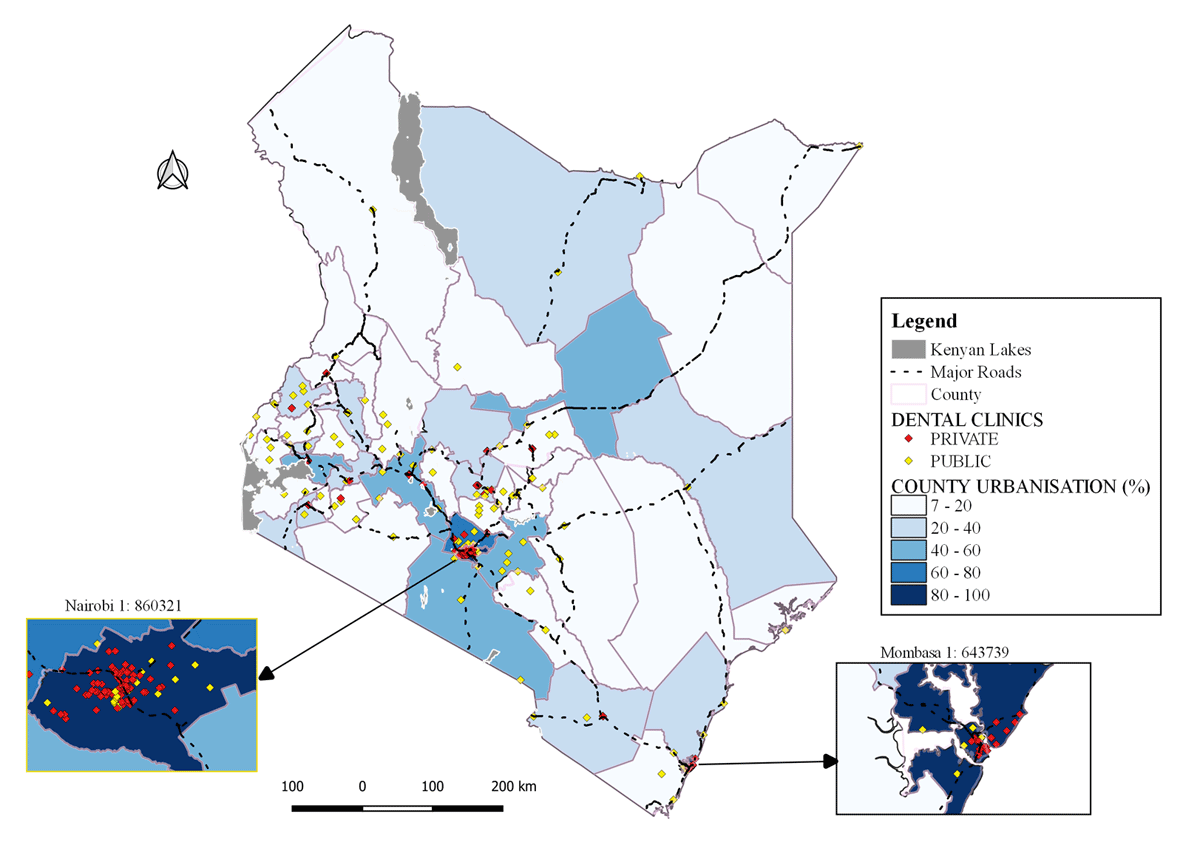
Figure 3
Distribution of dental clinics by county urbanization levels.
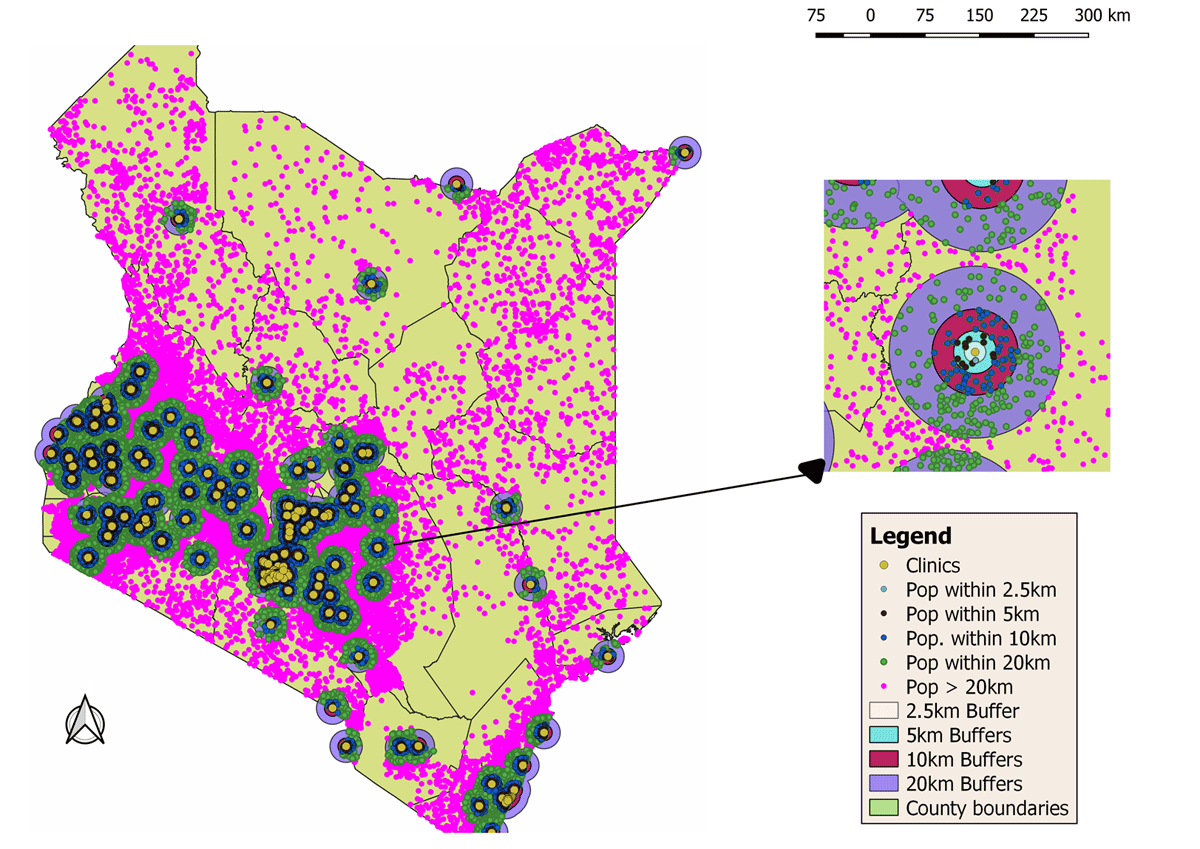
Figure 4
Population distribution by distance from the nearest dental clinic. (Map)
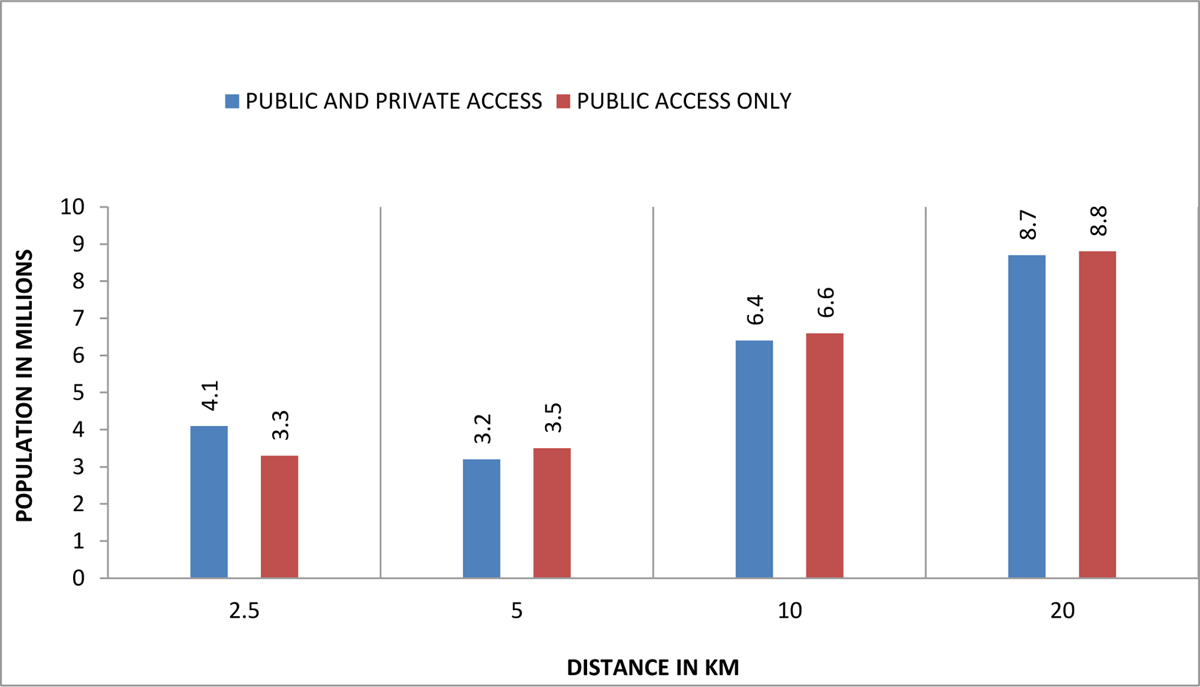
Figure 5
Population distribution by distance from the nearest dental clinic. (Graph)