
Table 1
Level and number of evaluated health care facilities from December 30, 2020 to June 10, 2021, Ethiopia.
| HEALTH CARE FACILITY LEVEL | NUMBER | PERCENTAGE |
|---|---|---|
| Public Specialized Hospitals | 16 | 9.30 |
| Public General Hospitals | 38 | 22.09 |
| Public Primary Hospitals | 77 | 44.76 |
| Health Centre OR Blocks | 9 | 5.23 |
| Private Hospital | 32 | 18.60 |
| Total | 172 | 100 |
Table 2
Number of surgical workforce available in the evaluated health care facilities from December 30, 2020 to June 10, 2021, disaggregated by level of health care, Ethiopia.
| HOSPITAL STAFF | NUMBER OF AVAILABLE HUMAN RESOURCE | |||||
|---|---|---|---|---|---|---|
| SPECIALIZED HOSPITAL N = 16 | GENERALIZED HOSPITAL N = 38 | PRIMARY HOSPITAL N = 77 | HEALTH CENTRE OR BLOCK N = 9 | PRIVATE HOSPITAL N = 32 | TOTAL | |
| Surgeons (General, neurosurgeons and orthopaedic surgeons) | 336 (51.14%) | 123 (10.72%) | 47 (7.15%) | 0.00% | 151 (22.98%) | 657 (100%) |
| Anaesthesiologists or anaesthesia care providers | 364 (48.27%) | 157 (20.82%) | 126 (16.71%) | 19 (2.52%) | 88 (11.67%) | 754 (100%) |
| Obstetrician | 165 (49.40%) | 76 (22.75%) | 16(4.79%) | 0.00% | 77 (23.05%) | 334 (100%) |
| IESO | 10 (3.02%) | 100 (30.21%) | 194 (58.61%) | 18 (5.44%) | 9 (2.72%) | 331 (100%) |
| Nurse anaesthetists | 14 (5.93%) | 94 (39.83%) | 79 (33.47%) | 2 (0.85%) | 47 (19.92%) | 236 (100%) |
| Total surgical work force | 889 (38.45%) | 550 (23.79%) | 462 (19.98%) | 39 (1.69%) | 372 (16.09%) | 2312 (100%) |
Table 3
Ratio of surgical workforce per 100,000 populations served from December 30, 2020 to June 10, 2021, disaggregated by level of care, Ethiopia.
| HEALTH CARE FACILITY LEVEL | NUMBER OF EVALUATED HEALTH FACILITIES | CATCHMENT POPULATION TO BE SERVED | *NUMBER OF SURGICAL WORKFORCES | SURGICAL WORKFORCE RATIO PER 100,000 POPULATION SERVED |
|---|---|---|---|---|
| *Health centre OR block | 9 | 360,000 | 39 | 10.8:100,000 population |
| Public primary hospital | 77 | 6,160,000 | 462 | 7.5:100,000 population |
| Public general hospital | 38 | 47,500,000 | 550 | 1.2:100,000 population |
| Public specialized hospital | 16 | 68,000,000 | 889 | 1.3:100,000 population |
[i] Note: Private hospitals do not have specific cathment population.
Table 4
Number of available surgical beds from December 30, 2020 to June 10, 2021, disaggregated by health care facility level, Ethiopia.
| HOSPITAL BEDS | NUMBER OF AVAILABLE SURGICAL BEDS BY HEALTH CARE FACILITY LEVEL | |||||
|---|---|---|---|---|---|---|
| SPECIALIZED HOSPITAL | GENERALIZED HOSPITAL | PRIMARY HOSPITAL | HEALTH CENTRE OR BLOCK | PRIVATE HOSPITAL | TOTAL | |
| 7,330 | 4,864 | 3,699 | 159 | 2,366 | 18,418 | |
| Surgical beds (Trauma, General Surgery and Orthopaedics) | 1,375 | 1139 | 726 | 36 | 674 | 3,950 |
| Obstetric and gynaecologic beds | 1,089 | 937 | 843 | 116 | 380 | 3,365 |
| Functioning operating rooms (Minor surgery) | 71 | 42 | 77 | 8 | 34 | 232 |
| Functioning operating rooms (Major surgery) | 110 | 90 | 99 | 10 | 89 | 398 |
Table 5
Ratio of surgical beds to total population served disaggregated by level of health care, Ethiopia, December 30, 2020 to June 10, 2021.
| HEALTH CARE FACILITY LEVEL | CATCHMENT POPULATION | NUMBER OF EVALUATED HEALTH CARE FACILITIES | TOTAL NUMBER OF SURGICAL BEDS | SURGICAL BEDS TO POPULATION RATIO |
|---|---|---|---|---|
| Public Primary Hospital | 6,160,000 | 77 | 726 | 1:8484 |
| Public General Hospital | 47,500,000 | 38 | 1139 | 1:41703 |
| Public Specialized Hospital | 68,000,000 | 16 | 1375 | 1:49454 |
| Health Centre OR block | 360,000 | 9 | 36 | 1:10,000 |
[i] Note: Private hospitals do not have specific cathment population.
Table 6
Proportion of functional operating theatre tables in a 90 days interval of the study period starting from September 2020 to May 2021, disaggregated by level of health care, Ethiopia.
| HEALTH CARE FACILITY LEVEL | NUMBER OF HEALTH FACILITIES EVALUATED | TOTAL NUMBER OF FUNCTIONAL ORS | TOTAL NUMBER OF OT TABLES | NUMBER OF FUNCTIONING OT TABLES | PROPORTION OF FUNCTIONING OT TABLES | AVERAGE NUMBER OF OT TABLES PER FACILITY |
|---|---|---|---|---|---|---|
| Public Primary Hospital | 77 | 176 | 174 | 131 | 75.28% | 2.26 |
| Public General Hospital | 38 | 132 | 125 | 113 | 90.40% | 3.28 |
| Public Specialized Hospital | 16 | 181 | 158 | 134 | 84.81% | 9.87 |
| Health Centre OR block | 9 | 18 | 15 | 12 | 80.00% | 1.66 |
| Private Hospitals | 32 | 123 | 116 | 104 | 89.65% | 3.63 |
| Total | 172 | 630 | 588 | 494 | 84.01% | 3.42 |
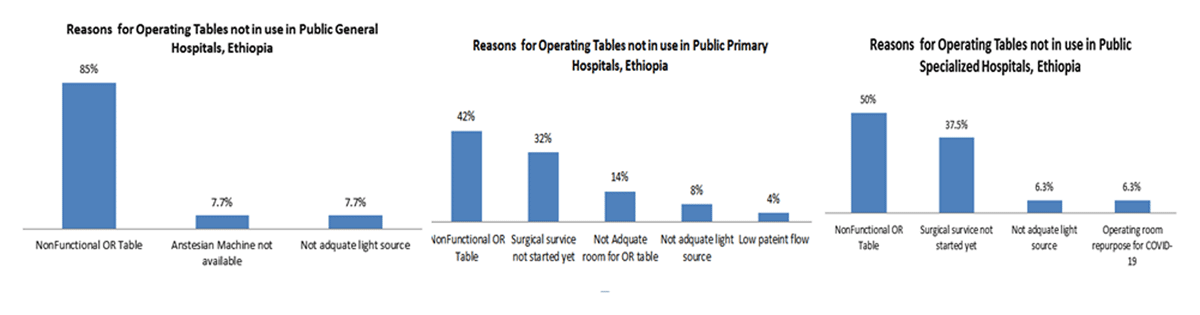
Figure 1
Reasons for operating room tables not in use in public primary, public general hospitals and public specialized hospitals in a 90 days interval of the study period starting from September 2020 to May 2021, Ethiopia.
Table 7
Availability of emergency and essential Major and minor surgical care kits, OR equipment and supplies, reporting period starting from September 2020 to May 2021, disaggregated by level of health care facilities.
| EMERGENCY AND ESSENTIAL SURGICAL CARE EQUIPMENT AND SUPPLIES | LEVEL OF HEALTH CARE FACILITY | ||||||||||||||
|---|---|---|---|---|---|---|---|---|---|---|---|---|---|---|---|
| PRIMARY HOSPITALS (N = 77) | GENERAL HOSPITALS (N = 38) | SPECIALIZED HOSPITALS (N = 16) | HEALTH CENTRE OR BLOCKS (N = 9) | PRIVATE HOSPITALS (N = 32) | |||||||||||
| ABSENT N (%) | AVAILABLE WITH SHORTAGE N (%) | FULLY AVAILABLE N (%) | ABSENT N (%) | AVAILABLE WITH SHORTAGE N (%) | FULLY AVAILABLE N (%) | ABSENT N (%) | AVAILABLE WITH SHORTAGE N (%) | FULLY AVAILABLE N (%) | ABSENT N (%) | AVAILABLE WITH SHORTAGE N (%) | FULLY AVAILABLE N (%) | ABSENT N (%) | AVAILABLE WITH SHORTAGE N (%) | FULLY AVAILABLE N (%) | |
| Scalpel with blades | 1(1.30%) | 17(22.08%) | 59(76.62%) | 0 | 2(5.41%) | 35(94.59%) | 1(6.25%) | 1(6.25%) | 14(87.50%) | 0 | 2(22.22%) | 7(77.78%) | 0 | 1(3.23%) | 30(96.77%) |
| Retractors | 0 | 15(19.48%) | 62(80.52%) | 0 | 1(2.7%) | 36(97.3%) | 0 | 1(6.25%) | 15(93.75%) | 0 | 0 | 9(100%) | 0 | 1(3.23%) | 30(96.77%) |
| Scissors | 0 | 18(23.38%) | 59(76.62%) | 0 | 7(18.92%) | 30(81.08%) | 1(6.25%) | 3(18.75%) | 12(75%) | 0 | 1(11.11%) | 8(88.89%) | 0 | 1(3.23%) | 30(96.77%) |
| Tissue forceps | 0 | 16(20.78%) | 61(79.22%) | 0 | 7(18.92%) | 30(81.08%) | 1(6.25%) | 2(12.50%) | 13(81.25%) | 0 | 1(11.11%) | 8(88.89%) | 0 | 1(3.23%) | 30(96.77%) |
| Needle holder | 0 | 19(24.68%) | 58(75.32%) | 0 | 6(16.22%) | 31(83.78%) | 1(6.25%) | 2(12.50%) | 13(81.25%) | 0 | 0 | 9(100%) | 0 | 1(3.23%) | 30(96.77%) |
| Adult McGill forceps | 24(32%) | 17(22.67%) | 34(45.33%) | 2(5.41%) | 5(13.51%) | 30(81.08%) | 0 | 4(26.67%) | 11(73.33%) | 5(55.56%) | 2(22.22%) | 2(22.22%) | 1(3.23%) | ||
| Paediatric McGill forceps | 38(49.35%) | 15(19.48%) | 24(31.17%) | 13(36.11%) | 4(11.11%) | 19(52.78%) | 1(6.67%) | 5(33.33%) | 9(60%) | 8(88.89%) | 1(11.11%) | 0 | 4(12.90%) | ||
| Needles & sutures | 0 | 20(25.97%) | 57(74.03%) | 0 | 7(18.92%) | 30(81.08%) | 1(6.25%) | 2(12.50%) | 13(81.25%) | 0 | 1(11.11%) | 8(88.89%) | 0 | 3(9.68%) | 28(90.32%) |
| Suction pump | 1(1.3%) | 30(38.96%) | 46(59.74%) | 0 | 11(28.95%) | 27(71.05%) | 1(6.25%) | 5(31.25%) | 10(62.50%) | 0 | 1(11.11%) | 8(88.89%) | 0 | ||
| Light source (lamp & flash light) | 3(3.90%) | 38(49.35%) | 36(46.75%) | 1(2.70%) | 14(37.84%) | 22(59.46%) | 1(6.25%) | 6(37.50%) | 9(56.25%) | 0 | 2(22.22%) | 7(77.78%) | 0 | 2(6.45%) | 29(93.55%) |
| Tourniquet | 15(19.48%) | 23(29.87%) | 39(50.65%) | 3(8.11%) | 6(16.22%) | 28(75.68%) | 3(18.75%) | 5(31.25%) | 8(50%) | 2(2.22%) | 2(2.22%) | 5(5.56%) | 0 | 3(9.68%) | 28(90.32%) |
| Splints for arm, leg | 19(24.68%) | 23(29.87%) | 35(45.45%) | 12(32.43%) | 3(8.11%) | 22(59.46%) | 3(18.75%) | 5(31.25%) | 8(50%) | 5(55.56%) | 3(33.33%) | 1(11.11%) | 2(6.45%) | 2(6.45%) | 27(87.10%) |
| Electrocautery | 9(11.69%) | 22(28.57%) | 46(59.74%) | 0 | 11(30.56%) | 25(69.44%) | 0 | 8(50%) | 8(50%) | 6(66.67%) | 2(22.22%) | 1(11.11%) | 0 | 2(6.45%) | 29(93.55%) |
| Chest tubes insertion equipment | 21(27.27%) | 28(36.36%) | 28(36.36%) | 5(13.51%) | 8(21.62%) | 24(64.86%) | 3(18.75%) | 3(18.75%) | 10(62.50%) | 9(100%) | 0 | 0 | 2(6.45%) | 1(3.23%) | 28(90.32%) |
| Tracheostomy set | 27(35.06%) | 20(25.97%) | 30(38.96%) | 8(21.62%) | 8(21.62%) | 21(56.76%) | 1(6.25%) | 2(12.50%) | 13(81.25%) | 9(100%) | 0 | 0 | 0 | 2(6.45%) | 29(93.55%) |