
Table 1
SNA Measures, Definitions, and Findings.
| MEASURE | DEFINITION | NETWORK MEANING/INTERPRETATION |
|---|---|---|
| Centrality | Measure of a node’s overall influence in the network
|
|
| Eigenvector | A node’s connection to other well-connected nodes | Elements from academia in the Global North had the highest eigenvector, and they act as leaders of the network, however their local influence is low. |
| Reach | A portion of a network within two steps of an element | There were no significant differences in reach, meaning that nodes are generally more isolated and cannot affect change through friend-of-a-friend contact. |
Table 2
Characteristics of the EDGE network by participant characteristics.
| REGION OF THE WORLD | TYPE OF ORGANIZATION | CAREER STAGE | WHOLE NETWORK | |||||||||
|---|---|---|---|---|---|---|---|---|---|---|---|---|
| GLOBAL NORTH | GLOBAL SOUTH | UNIVERSITY/ACADEMIA | MULTILATERAL | NGO | PRIVATE SECTOR | GOVERNMENT | TRAINEE | EARLY PROFESSIONAL | MID PROFESSIONAL | SENIOR PROFESSIONAL | ||
| Size (total number of connections) | 37 | 38 | 35 | 8 | 19 | 12 | 8 | 17 | 25 | 30 | 6 | 103 |
| Degree (average number of individual connections) | 2.7 | 1.5 | 2.6 | 0.6 | 1.7 | 1.8 | 2.25 | 2 | 2.2 | 2.1 | 2.8 | 2.1 |
| Betweenness | 0.89 | 0.44 | 0.933 | 0 | 0.25 | 0.12 | 0.14 | 0.32 | 0.39 | 0.59 | 0 | 0.16 |
| Closeness | 0.18 | 0.16 | 0.20 | 0.15 | 0.16 | 0.17 | 0.19 | 0.18 | 0.20 | 0.19 | 0.21 | 0.21 |
| Eigenvector | 0.63 | 0.29 | 0.63 | 0.05 | 0.13 | 0.05 | 0.013 | 0.26 | 0.32 | 0.35 | 0.05 | 0.10 |
| Reach | 0.13 | 0.11 | 0.15 | 0.09 | 0.10 | 0.08 | 0.12 | 0.13 | 0.14 | 0.11 | 0.15 | 0.14 |
| Value of each connection | 2.2 | 2.3 | 2.1 | 2.1 | 2.3 | 2.8 | 2.8 | 1.0 | 2.0 | 2.9 | 5.0 | 2.29 |
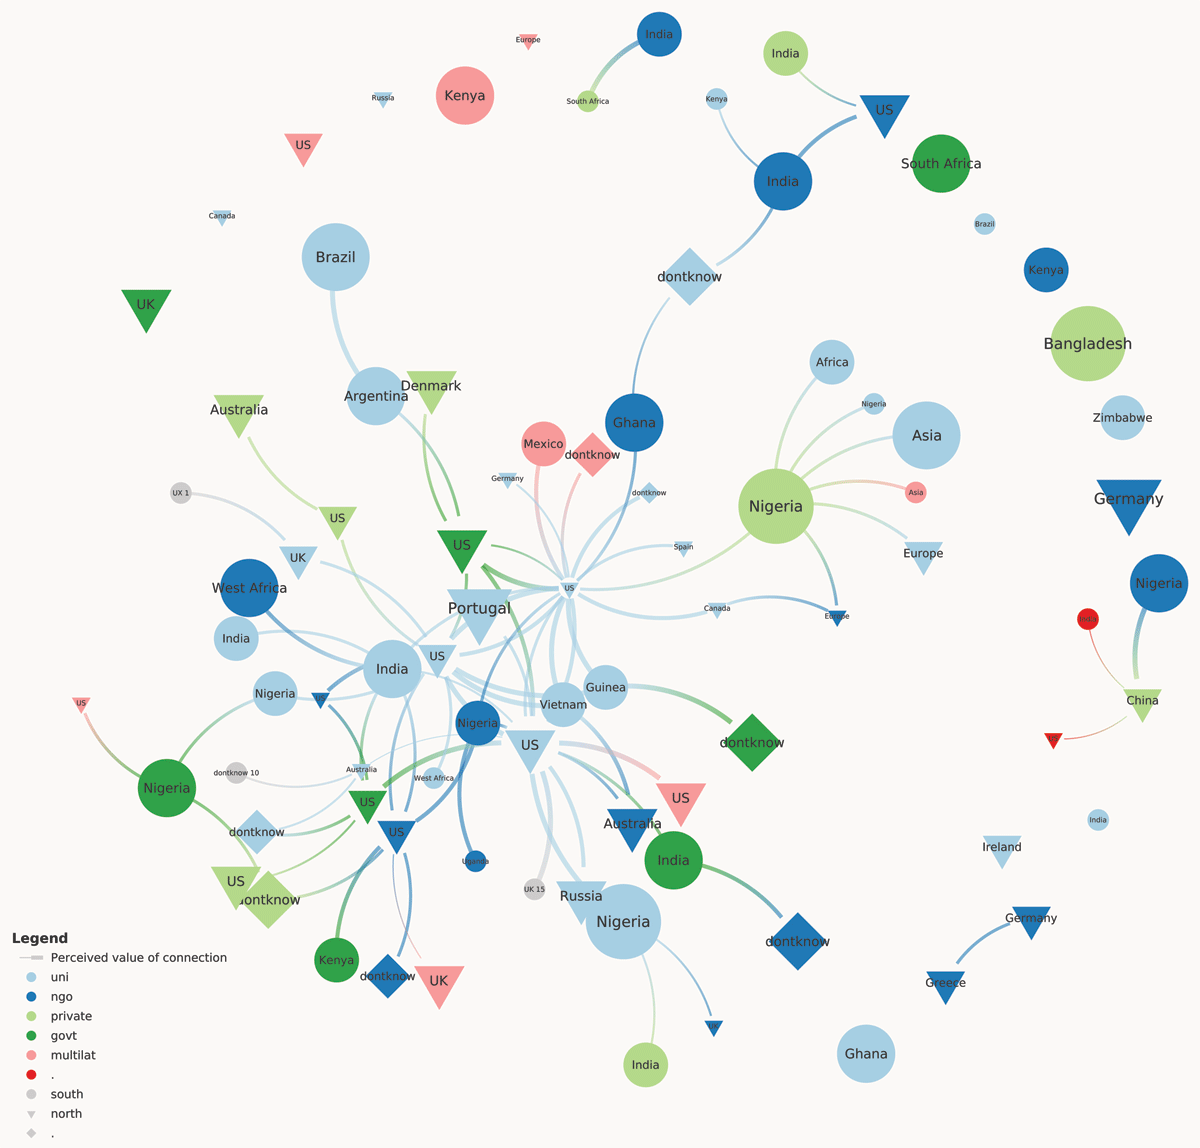
Figure 1
EDGE network’s centrality. Nodes with more influence provide access to decision-makers.