
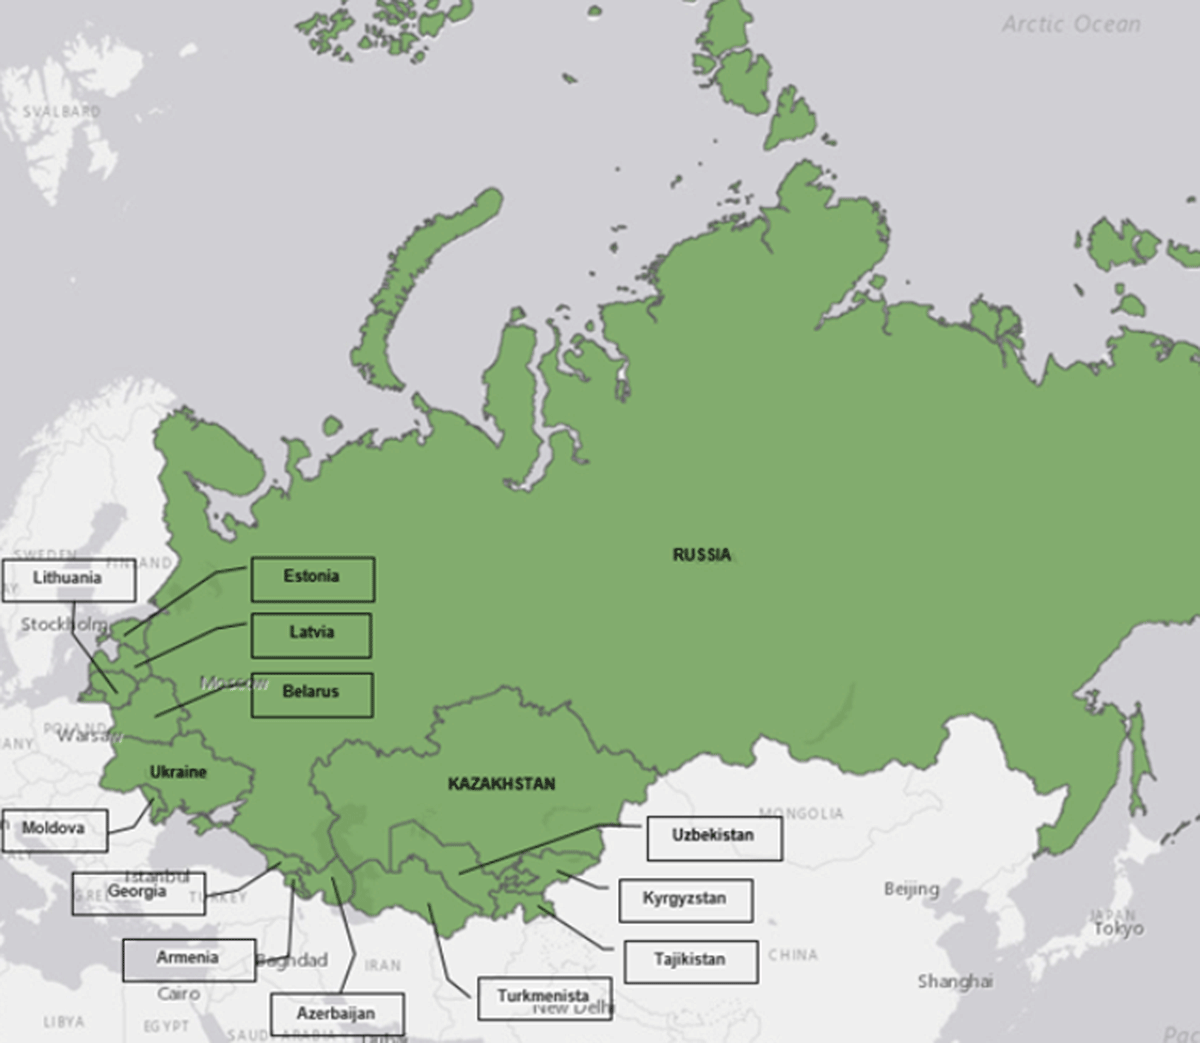
Figure 1
Republics formerly part of the Soviet Union.
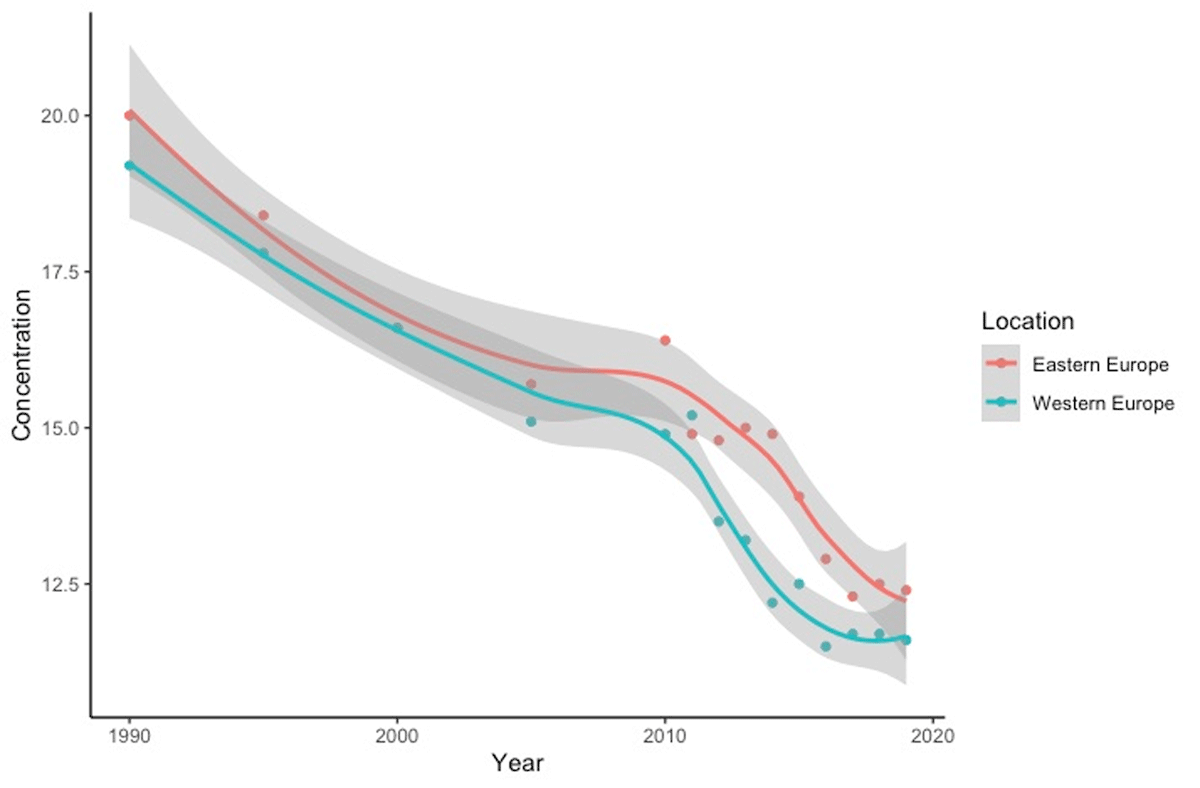
Figure 2
Average Annual Population-Weighted PM2.5 Concentration (1990–2019) [16].
Source: State of Global Air.
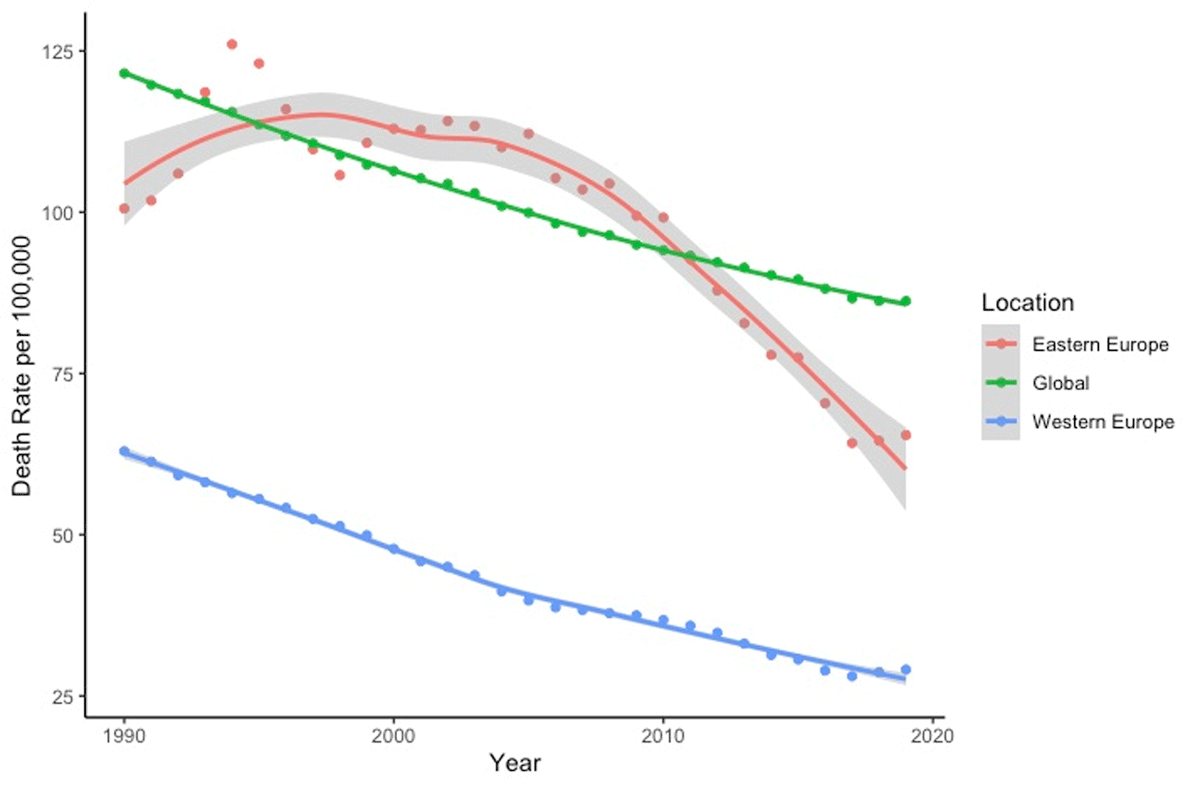
Figure 3
Deaths per 100,000 from all causes attributable to air pollution (1990–2019).
Source: IHME.
Table 1
DALY and death rates per 100,000 attributable to air pollution (2019).
| COUNTRY | DEATH RATE (95% UI) | DALY RATE (95% UI) |
|---|---|---|
| Eastern Europe | 65.44 (41.96–89.90) | 1469.77 (946.28–1997.94) |
| Western Europe | 29.09 (21.36–37.28) | 568.19 (417.59–732.45) |
[i] Source: IHME.
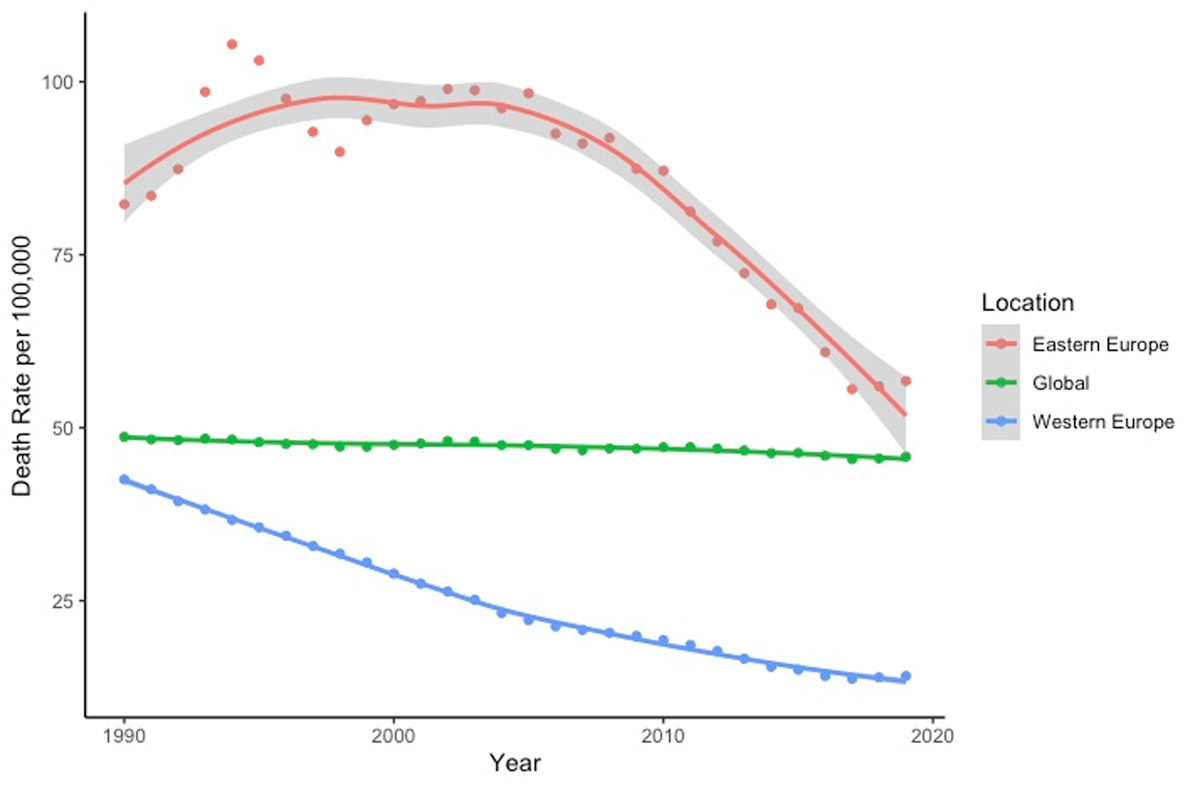
Figure 4
Death rates from CVD attributable to air pollution (1990–2019).
Source: IHME.
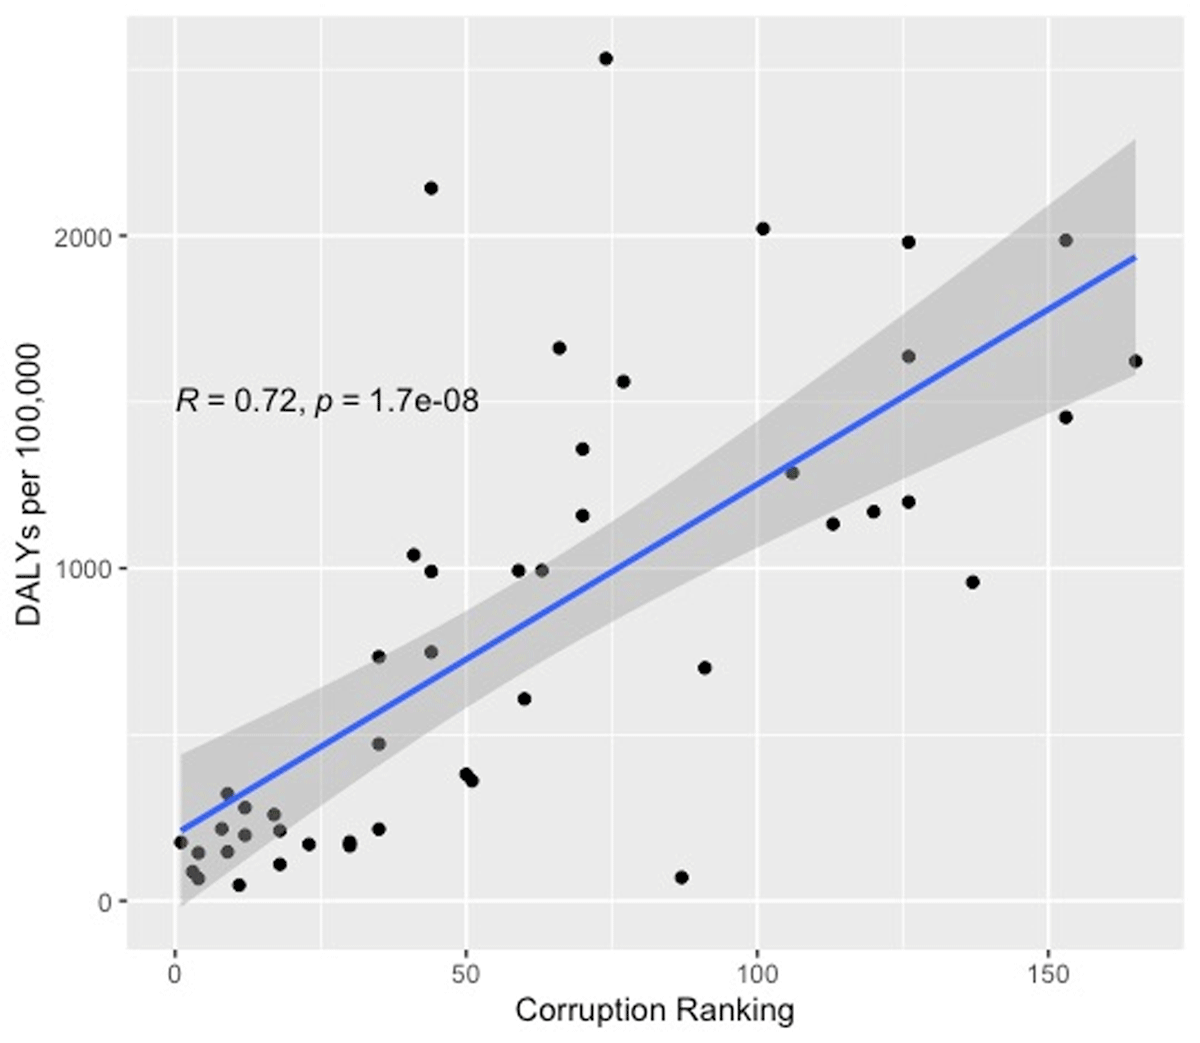
Figure 5
DALY rates per 100,000 from CVD attributable to air pollution by CPI.

Figure 6
(a) Comparison of air-pollution-related CVD DALY rates in EURO countries never part of USSR and Ex-Soviet Republics; (b) Comparison of CPI in EURO countries never part of USSR and Ex-Soviet Republics. *** Indicates p-value < 0.001 from ANOVA test.