
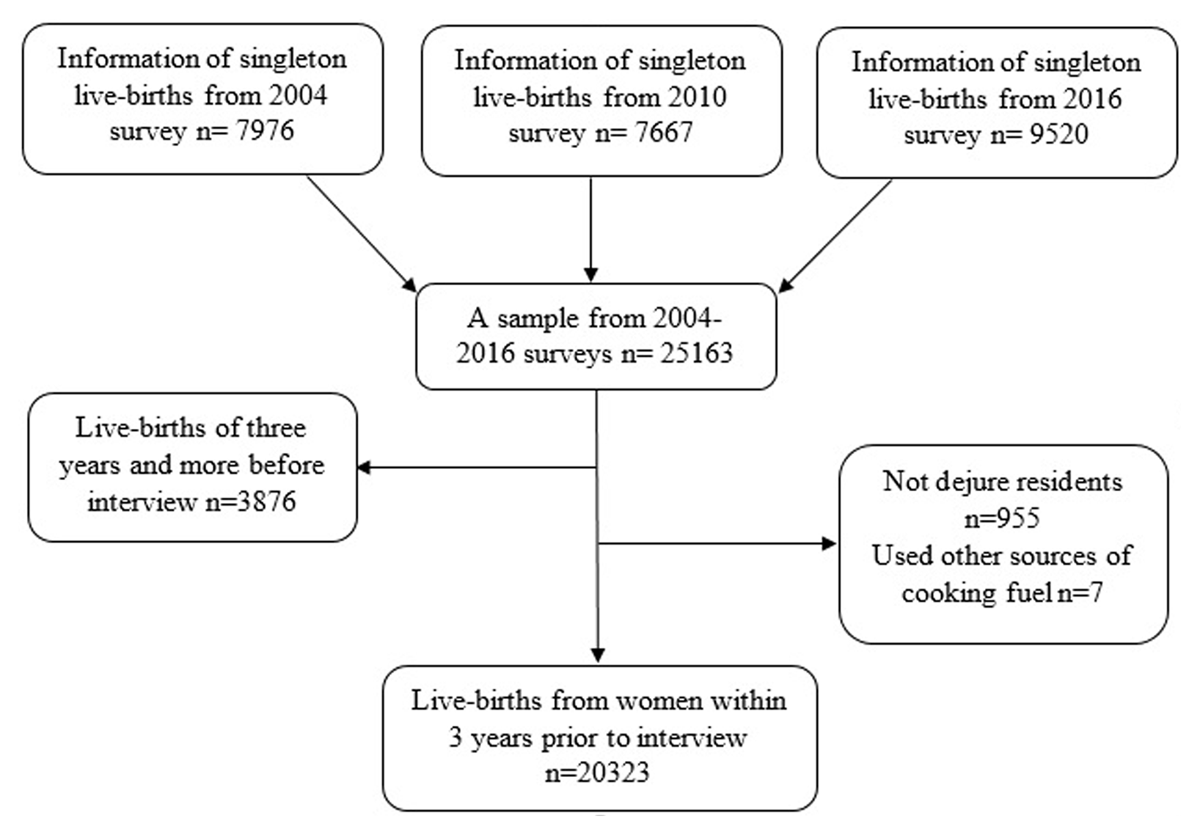
Figure 1
Selection of study participants.
Table 1
Geographical cluster zones.
| CLUSTER ZONE | REGIONS | |
|---|---|---|
| 1 | Central | Dodoma and Singida |
| 2 | Coastal | Dar es salaam, Pwani, Tanga and Morogoro |
| 3 | Lake | Kagera, Mwanza, Mara, Simiyu and Geita |
| 4 | Northern Highlands | Arusha, Kilimanjaro and Manyara |
| 5 | Southern | Lindi, Mtwara and Ruvuma |
| 6 | Southern Highlands | Iringa, Mbeya, Rukwa and Njombe |
| 7 | Western | Tabora, Shinyanga and Kigoma |
| 8 | Zanzibar | Unguja North, Unguja South, Town West, Pemba North and Pemba South |
Table 2
Distribution of baseline characteristics and ARI by year of survey.
| VARIABLE | 2004 n (%) 6559 (100) | 2010 n (%) 6260 (100) | 2015–16 n (%) 7504 (100) | ALL n (%) 20323 (100) |
|---|---|---|---|---|
| Main independent | ||||
| Cooking fuel | ||||
| Cleaner fuel n (%) | 28 (0.42) | 63 (1.01) | 29 (0.38) | 120 (0.59) |
| Kerosene | 0 (0.00) | 52 (0.83) | 47 (0.63) | 99 (0.72) |
| Solid biomass | 6531 (99.58) | 6145 (98.16) | 7428 (98.99) | 20104 (98.61) |
| Level 1 variables (Individual) | ||||
| Age period of the child | ||||
| Neonatal | 81 (1.22) | 64 (1.03) | 172 (2.29) | 317 (1.56) |
| Post-neonatal | 1586 (24.19) | 1507 (24.07) | 1725 (22.99) | 4818 (23.48) |
| Childhood | 4892 (74.59) | 4689 (74.90) | 5607 (74.72) | 15188 (74.81) |
| Sex of the child | ||||
| Male | 3252 (49.58) | 3105 (49.60) | 3808 (50.75) | 10165 (50.02) |
| Female | 3307 (50.42) | 3155 (50.40) | 3696 (49.25) | 10158 (49.08) |
| Age of mother | ||||
| 15–49 | 395 (6.02) | 368 (5.87) | 588 (7.84) | 1351 (6.65) |
| 20–34 | 5049 (76.98) | 4522 (72.25) | 5217 (69.52) | 14788 (72.77) |
| 35–49 | 1115 (17.00) | 1370 (21.88) | 1699 (22.64) | 4184 (20.59) |
| Mother education level | ||||
| No education | 1780 (27.13) | 1675 (26.76) | 1641 (21.87) | 5096 (25.07) |
| Primary | 4501 (68.63) | 4231 (67.59) | 4822 (64.25) | 13554 (66.70) |
| Secondary/above | 278 (4.23) | 354 (5.65) | 1041 (13.88) | 1673 (8.23) |
| Mother working status | ||||
| Not working | 588 (8.96) | 662 (10.58) | 1294 (17.24) | 2544 (12.52) |
| Self-employed | 5255 (80.13) | 4501 (71.90) | 4318 (57.55) | 14074 (64.07) |
| Employed | 716 (10.91) | 1097 (17.52) | 1892 (25.21) | 3705 (18.23) |
| Father education level | ||||
| No education | 1474 (22.48) | 1444 (23.07) | 2123 (28.29) | 5041 (24.80) |
| Primary | 4630 (70.60) | 4377 (69.92) | 4404 (58.69) | 13411 (65.99) |
| Secondary/above | 455 (6.92) | 439 (7.01) | 977 (13.02) | 1871 (9.21) |
| No. of living children | ||||
| 1–2 | 2492 (37.99) | 2168 (34.63) | 2902 (38.67) | 7562 (37.21) |
| 3–4 | 2184 (33.30) | 2174 (34.73) | 2317 (30.88) | 6675 (32.84) |
| 5+ | 1883 (28.71) | 1918 (30.64) | 2285 (30.45) | 6086 (29.95) |
| Wealth index class | ||||
| Poor | 2960 (45.13) | 2936 (46.90) | 3628 (48.35) | 9524 (46.86) |
| Middle | 1458 (22.23) | 1445 (23.08) | 1439 (19.18) | 4342 (21.37) |
| Rich | 2141 (32.65) | 1879 (30.02) | 2437 (32.47) | 6457 (31.77) |
| Level 2 variables (Cluster) | ||||
| Geographical zone | ||||
| Central | 566 (8.62) | 606 (9.68) | 551 (7.34) | 1723 (8.48) |
| Coastal | 863 (13.16) | 902 (14.41) | 1228 (16.37) | 2993 (14.73) |
| Lake | 1452 (22.14) | 1368 (21.85) | 2175 (28.99) | 4995 (24.58) |
| Northern | 581 (8.86) | 482 (7.70) | 674 (8.98) | 1737 (8.55) |
| Southern | 405 (6.17) | 426 (6.81) | 394 (5.25) | 1225 (6.03) |
| Southern highlands | 993 (15.14) | 864 (13.80) | 819 (10.91) | 2676 (13.17) |
| Western | 1531 (23.34) | 1448 (23.13) | 1349 (17.98) | 4328 (21.29) |
| Zanzibar | 168 (2.57) | 164 (2.62) | 314 (4.18) | 646 (3.17) |
| Cluster residence | ||||
| Rural | 5424 (82.69) | 5133 (82.00) | 5639 (75.15) | 16196 (79.69) |
| Urban | 1135 (17.31) | 1127 (18.00) | 1865 (24.85) | 4127 (21.74) |
[i] Note: n and (%) represent the absolute number and percentage in the bracket, respectively.
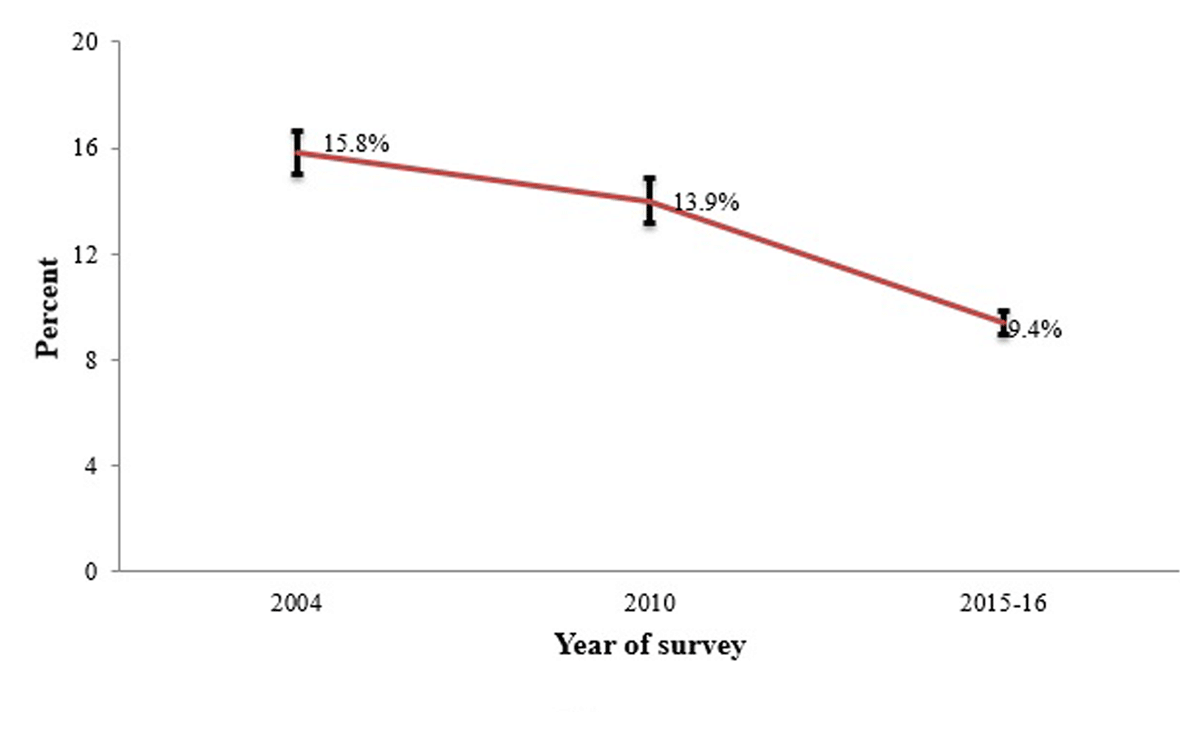
Figure 2
Percentage distributions of under-fives with symptoms according to the survey year, TDHS 2004–2016 (n = 20323).
Table 3
Multilevel logistic regression models for the association of HAP and ARI among under-fives, TDHS 2004/2010/2015–16.
| VARIABLE | MODEL 1 AOR [95% CI] | MODEL 2 AOR [95% CI] | MODEL 3 AOR [95% CI] | MODEL 4 AOR [95% CI] |
|---|---|---|---|---|
| Main independent | ||||
| Cooking fuel | ||||
| Cleaner fuel | 1.00 | 1.00 | 1.00 | |
| Unclean fuel | – | 2.77 [1.21–6.35] | 3.15 [1.17–8.51] | 3.47 [1.31–9.21] |
| Level 1 variables (Individual) | ||||
| Year of survey | ||||
| 2004 | 1.00 | 1.00 | ||
| 2010 | – | – | 0.85 [0.72–1.01] | 0.85 [0.72–1.00] |
| 2015–16 | 0.49 [0.41–0.59] | 0.49 [0.41–0.58] | ||
| Age period of the child | ||||
| Neonatal | 1.00 | 1.00 | ||
| Post-neonatal | – | – | 16.40 [5.02–53.57] | 16.30 [4.99–53.27] |
| Childhood | 13.89 [4.29–45.00] | 13.82 [4.27–44.76] | ||
| Sex of the child | ||||
| Male | 1.00 | 1.00 | ||
| Female | – | – | 0.95 [0.86–1.05] | 0.95 [0.86–1.04] |
| Age of mother | ||||
| 15–49 | 1.00 | 1.00 | ||
| 20–34 | – | – | 0.70 [0.56–0.86] | 0.70 [0.57–0.87] |
| 35–49 | 0.72 [0.54–0.96] | 0.73 [0.55–0.97] | ||
| Mother education level | ||||
| No education | 1.00 | 1.00 | ||
| Primary | – | – | 0.95 [0.81–1.11] | 0.95 [0.81–1.12] |
| Secondary/above | 1.07 [0.82–1.38] | 1.05 [0.81–1.36] | ||
| Mother working status | ||||
| Not working | 1.00 | 1.00 | ||
| Self-employed | – | – | 1.03 [0.86–1.23] | 1.01 [0.83–1.22] |
| Employed | 1.09 [0.90–1.32] | 1.06 [0.87–1.29] | ||
| Father education level | ||||
| No education | 1.00 | 1.00 | ||
| Primary | – | – | 1.20 [1.03–1.40] | 1.20 [1.04–1.40] |
| Secondary/above | 1.19 [0.95–1.47] | 1.16 [0.93–1.45] | ||
| No. of living children | ||||
| 1–2 | 1.00 | 1.00 | ||
| 3–4 | – | – | 0.92 [0.79–1.07] | 0.92 [0.79–1.08] |
| 5+ | 0.80 [0.67–0.97] | 0.81 [0.67–0.97] | ||
| Wealth index class | ||||
| Poor | 1.00 | 1.00 | ||
| Middle | – | – | 0.95 [0.81–1.11] | 0.96 [0.83–1.12] |
| Rich | 1.14 [0.95–1.35] | 1.11 [0.92–1.33] | ||
| Level 2 variables (Cluster) | ||||
| Geographical zone | ||||
| Central | 1.00 | |||
| Coastal | 0.85 [0.63–1.14] | |||
| Lake | 0.87 [0.66–1.15] | |||
| Northern | – | – | – | 0.58 [0.42–0.81] |
| Southern | 0.90 [0.66–1.23] | |||
| Southern highlands | 0.59 [0.43–0.81] | |||
| Western | 0.90 [0.66–1.22] | |||
| Zanzibar | 0.83 [0.62–1.11] | |||
| Cluster residence | ||||
| Rural | 1.00 | |||
| Urban | – | – | 1.17 [0.96–1.43] | |
| The variance of random part | ||||
| Cluster level variance (SE) | 0.350 (0.040) | 0.349 (0.040) | 0.360 (0.042) | 0.350 (0.045) |
| Intraclass correlation (SE) | 0.0961 (0.0099) | 0.0959 (0.0099) | 0.0987 (0.0105) | 0.0962 (0.0111) |
| Akaike’s information criterion | 15258.490 | 15254.120 | 14978.590 | 14944.590 |
| Log pseudolikelihood | –7627.245 | –7623.061 | –7468.295 | –7443.296 |