
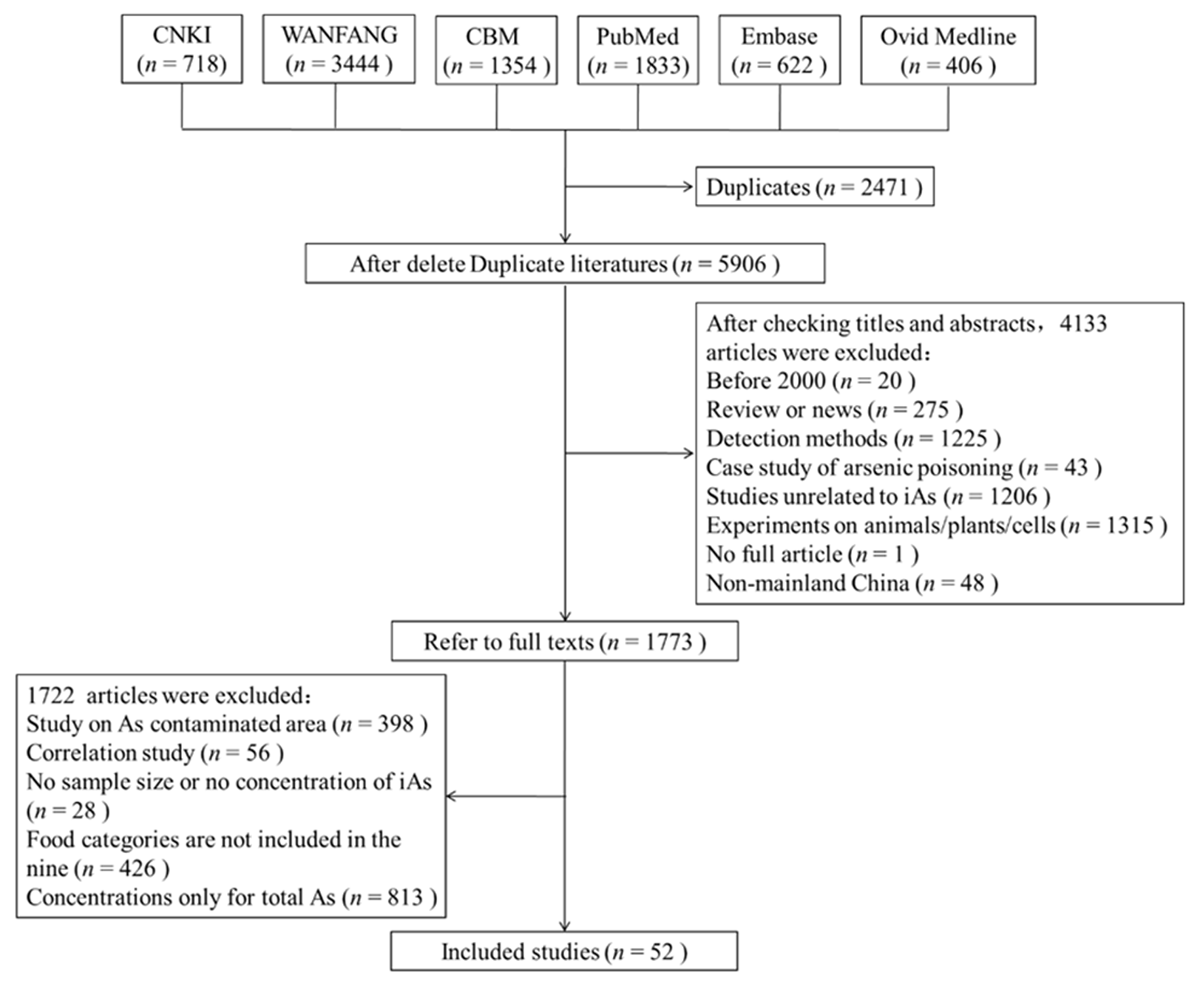
Figure 1
Flow chart of dietary inorganic arsenic (iAs) data retrieved from six databases in Chinese and English.
Table 1
Estimators of food type-specific inorganic arsenic concentrations in China.a
| FOOD TYPES | NO. OF SAMPLES | MEAN (mg/kg) | |||
|---|---|---|---|---|---|
| NORTH | SOUTH | NORTH | SOUTH | ||
| Cereals | Rice | 336 | 8501 | 0.094 | 0.085 |
| Other (except rice) | 2041 | 1979 | 0.042 | 0.02 | |
| Legumes/Nuts | 3009 | 3009 | 0.02 | 0.02 | |
| Potatoes | 2880 | 2880 | 0.019 | 0.019 | |
| Meat | 5105 | 5105 | 0.016 | 0.016 | |
| Eggs | 4394 | 4394 | 0.013 | 0.013 | |
| Dairy products | 3547 | 3547 | 0.011 | 0.011 | |
| Aquatic products | 5035 | 5035 | 0.039 | 0.039 | |
| Vegetable | 4533 | 4533 | 0.016 | 0.016 | |
| Fruit | 3893 | 3893 | 0.011 | 0.011 | |
[i] a Sample size-weighted estimators were calculated.
Table 2
Average of estimated daily foodborne inorganic arsenic (iAs) intake in 31 provinces in China.
| PROVINCE/CITY | FOODBORNE iAs INTAKE (μg/day) | FOODBORNE iAs INTAKE (μg/kg bw/day)b | PROVINCE/CITY | FOODBORNE iAs INTAKE (μg/day) | FOODBORNE iAs INTAKE (μg/kg bw/day)b |
|---|---|---|---|---|---|
| China | 34.14 | 0.55 | |||
| North | Hubei | 42.66 | 0.69 | ||
| Beijing | 41.03 | 0.60 | Hunan | 40.52 | 0.69 |
| Hebei | 35.57 | 0.54 | South | ||
| Inner Mongolia | 35.32 | 0.53 | Guangdong | 24.51 | 0.42 |
| Shanxi | 24.71 | 0.38 | Guangxi | 39.53 | 0.70 |
| Tianjin | 30.43 | 0.45 | Hainan | 28.24 | 0.51 |
| Northeast | Southwest | ||||
| Heilongjiang | 37.24 | 0.57 | Chongqing | 34.31 | 0.59 |
| Jilin | 61.17 | 0.94 | Guizhou | 31.40 | 0.55 |
| Liaoning | 51.44 | 0.78 | Sichuan | 38.00 | 0.64 |
| East | Tibet | 28.34 | 0.50 | ||
| Anhui | 28.69 | 0.46 | Yunnan | 31.84 | 0.55 |
| Fujian | 44.48 | 0.75 | Northwest | ||
| Jiangsu | 26.06 | 0.41 | Gansu | 35.13 | 0.56 |
| Jiangxi | 32.85 | 0.57 | Ningxia | 42.92 | 0.67 |
| Shandong | 29.09 | 0.44 | Qinghai | 33.80 | 0.53 |
| Shanghai | 40.25 | 0.63 | Shaanxi | 33.47 | 0.56 |
| Zhejiang | 54.81 | 0.90 | Xinjiang | 40.21 | 0.63 |
| Central | |||||
| Henan | 32.39 | 0.51 |
[i] b The average body weight (bw) of residents in the regions of China was obtained from the China National Nutrition and Health Survey 2010.
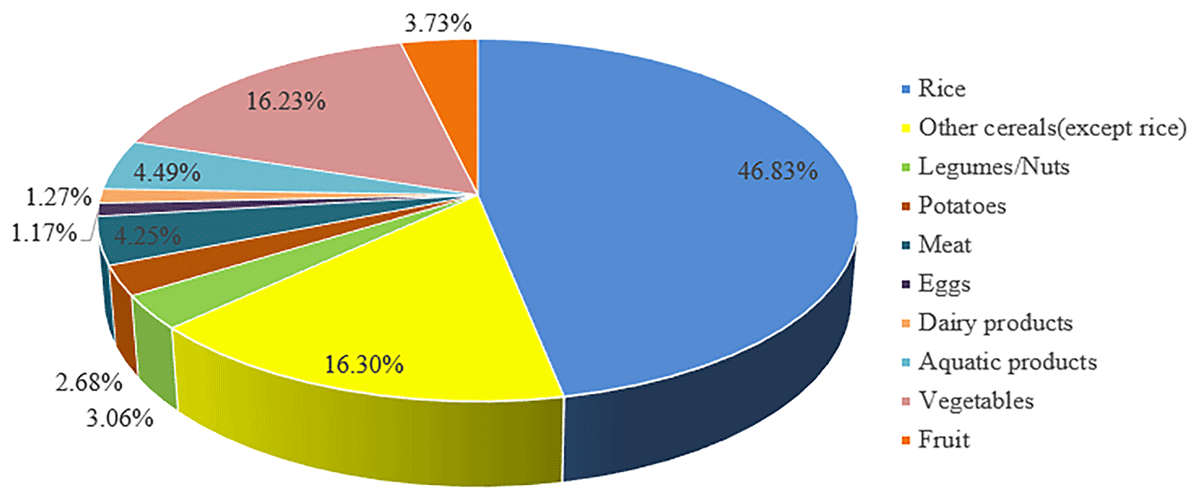
Figure 2
Proportion of inorganic arsenic contribution from different food groups in China.
Table 3
Estimation of the burden of coronary heart disease attributed to foodborne inorganic arsenic (iAs) intake in 31 provinces in China in 2016.
| PROVINCES | INCIDENCE-PAF | MORTALITY-PAF | YLLS (IN THOUSANDS) (95% UI) | AGE-STANDARDIZED YLL RATE (PER 100,000) (95% UI) | YLDS (IN THOUSANDS) (95% UI) | AGE-STANDARDIZED YLD RATE (PER 100,000) (95% UI) | DALY (IN THOUSANDS) (95% UI) | AGE-STANDARDIZED DALY RATE (PER 100,000) (95% UI) | PROPORTION OF DALY RELATED TO FOODBORNE iAs (%) |
|---|---|---|---|---|---|---|---|---|---|
| China | 7.28% | 10.30% | 2931.8(2833.38–3025) | 254.36(245.82–262.44) | 85.72(59.21–117.07) | 7.44(5.14–10.16) | 3017.51(2892.6–3142.07) | 261.8(250.96–272.6) | 10.18% |
| North | |||||||||
| Beijing | 10.08% | 14.52% | 53.7(46.19–61.77) | 277.28(238.53–318.95) | 2.39(1.66–3.28) | 12.32(8.58–16.94) | 56.08(47.86–65.05) | 289.6(247.11–335.89) | 14.25% |
| Hebei | 7.92% | 11.28% | 233.51(204.47–261.51) | 383.37(335.69–429.34) | 5.31(3.64–7.29) | 8.71(5.98–11.97) | 238.82(208.11–268.8) | 392.08(341.66–441.31) | 11.17% |
| Inner Mongolia | 7.81% | 11.11% | 85.62(75.11–97.9) | 389.63(341.81–445.52) | 2.02(1.4–2.77) | 9.21(6.37–12.59) | 87.64(76.51–100.67) | 398.84(348.17–458.11) | 11.00% |
| Shanxi | 1.91% | 1.78% | 15.6(13.66–17.52) | 50.05(43.84–56.23) | 0.61(0.41–0.84) | 1.94(1.32–2.69) | 16.2(14.08–18.36) | 52(45.16–58.92) | 1.78% |
| Tianjin | 5.44% | 7.44% | 26.43(22.74–30.13) | 189.89(163.37–216.47) | 0.86(0.6–1.19) | 6.2(4.33–8.56) | 27.29(23.34–31.32) | 196.09(167.7–225.03) | 7.36% |
| Northeast | |||||||||
| Heilongjiang | 8.63% | 12.35% | 180.4(157.34–203.38) | 527.92(460.46–595.17) | 3.82(2.66–5.18) | 11.17(7.79–15.15) | 184.21(160.01–208.56) | 539.09(468.24–610.32) | 12.24% |
| Jilin | 15.61% | 22.44% | 216.57(193.42–240.89) | 907.2(810.21–1009.05) | 4.18(2.89–5.78) | 17.5(12.12–24.21) | 220.75(196.31–246.67) | 924.7(822.33–1033.26) | 22.26% |
| Liaoning | 13.30% | 19.19% | 261.17(226.98–294.41) | 667.55(580.16–752.51) | 7.81(5.44–10.75) | 19.96(13.91–27.48) | 268.98(232.42–305.16) | 687.52(594.07–779.99) | 18.95% |
| East | |||||||||
| Anhui | 4.47% | 5.91% | 68.12(61.39–75.2) | 133.31(120.14–147.18) | 2.28(1.57–3.11) | 4.46(3.07–6.08) | 70.39(62.95–78.31) | 137.77(123.21–153.26) | 5.85% |
| Fujian | 11.26% | 16.25% | 63.06(55.58–71.09) | 199.22(175.6–224.59) | 3.04(2.07–4.18) | 9.6(6.53–13.21) | 66.1(57.65–75.27) | 208.81(182.12–237.8) | 15.93% |
| Jiangsu | 2.84% | 3.29% | 28.82(25.5–32.4) | 41.77(36.96–46.96) | 2.06(1.42–2.81) | 2.99(2.06–4.08) | 30.88(26.92–35.22) | 44.75(39.02–51.04) | 3.26% |
| Jiangxi | 6.67% | 9.36% | 66.14(58.99–74.02) | 182.82(163.08–204.63) | 2(1.37–2.77) | 5.54(3.8–7.65) | 68.14(60.37–76.79) | 188.37(166.88–212.27) | 9.25% |
| Shandong | 4.70% | 6.27% | 151.86(135.28–167.85) | 183.81(163.73–203.16) | 4.44(3.1–6.08) | 5.37(3.75–7.36) | 156.3(138.37–173.93) | 189.18(167.48–210.52) | 6.22% |
| Shanghai | 9.80% | 14.10% | 29.91(25.92–34.04) | 136.81(118.59–155.73) | 2.42(1.67–3.33) | 11.06(7.64–15.22) | 32.32(27.59–37.37) | 147.87(126.24–170.95) | 13.65% |
| Zhejiang | 14.16% | 20.41% | 96.81(84.84–110.56) | 198.93(174.34–227.21) | 6.17(4.21–8.49) | 12.68(8.64–17.45) | 102.98(89.05–119.06) | 211.62(182.99–244.66) | 19.89% |
| Central | |||||||||
| Henan | 6.45% | 9.02% | 219.37(198.12–241.8) | 290.54(262.4–320.24) | 5.19(3.62–7.14) | 6.87(4.79–9.46) | 224.55(201.74–248.94) | 297.41(267.19–329.7) | 8.93% |
| Hubei | 10.65% | 15.36% | 164.48(148.16–182.09) | 330.68(297.86–366.09) | 4.98(3.42–6.87) | 10.01(6.89–13.81) | 169.46(151.58–188.96) | 340.69(304.74–379.9) | 15.16% |
| Hunan | 9.89% | 14.24% | 241.62(216.75–275.06) | 432.98(388.42–492.91) | 5.76(3.96–7.86) | 10.32(7.09–14.09) | 247.38(220.71–282.92) | 443.3(395.51–506.99) | 14.10% |
| South | |||||||||
| Guangdong | 1.77% | 1.54% | 23.72(21.06–26.41) | 25.9(23–28.84) | 1.43(0.98–1.97) | 1.56(1.07–2.15) | 25.15(22.05–28.38) | 27.47(24.08–30.99) | 1.55% |
| Guangxi | 9.53% | 13.70% | 139.3(123.66–156.35) | 366.1(325.01–410.91) | 3.4(2.32–4.69) | 8.93(6.1–12.34) | 142.7(125.99–161.04) | 375.03(331.12–423.24) | 13.56% |
| Hainan | 4.21% | 5.49% | 9.12(8.02–10.37) | 123.95(109.02–140.98) | 0.28(0.19–0.38) | 3.8(2.62–5.17) | 9.4(8.22–10.76) | 127.74(111.64–146.15) | 5.44% |
| Southwest | |||||||||
| Chongqing | 7.36% | 10.42% | 48.04(42.31–54.43) | 186.42(164.19–211.2) | 1.84(1.25–2.53) | 7.12(4.86–9.81) | 49.88(43.57–56.96) | 193.54(169.05–221.01) | 10.26% |
| Guizhou | 5.95% | 8.24% | 56.18(48.42–64.77) | 203.3(175.23–234.42) | 1.49(1.02–2.05) | 5.4(3.68–7.4) | 57.67(49.44–66.82) | 208.7(178.91–241.82) | 8.16% |
| Sichuan | 8.93% | 12.81% | 175.95(154.04–200.29) | 253.41(221.86–288.47) | 6.13(4.18–8.37) | 8.83(6.02–12.05) | 182.08(158.22–208.66) | 262.24(227.88–300.52) | 12.62% |
| Tibet | 4.27% | 5.59% | 3.46(2.98–4.09) | 137.61(118.64–162.63) | 0.06(0.04–0.09) | 2.48(1.66–3.43) | 3.52(3.02–4.18) | 140.09(120.3–166.06) | 5.56% |
| Yunnan | 6.17% | 8.59% | 76.04(67.54–86.02) | 198.05(175.93–224.05) | 1.76(1.19–2.46) | 4.58(3.11–6.4) | 77.79(68.74–88.47) | 202.63(179.05–230.45) | 8.51% |
| Northwest | |||||||||
| Gansu | 7.73% | 10.99% | 59.37(52.88–66.74) | 273.94(243.99–307.96) | 1.49(1.02–2.04) | 6.88(4.73–9.41) | 60.86(53.9–68.78) | 280.83(248.71–317.37) | 10.88% |
| Ningxia | 10.74% | 15.49% | 24.35(21.21–27.66) | 446.23(388.67–506.74) | 0.56(0.39–0.78) | 10.27(7.06–14.27) | 24.91(21.6–28.43) | 456.5(395.73–521.01) | 15.34% |
| Qinghai | 7.12% | 10.06% | 13.19(11.49–14.95) | 277.07(241.42–314.14) | 0.27(0.18–0.37) | 5.66(3.88–7.81) | 13.46(11.68–15.33) | 282.73(245.29–321.95) | 9.98% |
| Shaanxi | 6.97% | 9.82% | 94.42(83.02–107.41) | 290.76(255.66–330.76) | 2.02(1.39–2.77) | 6.21(4.29–8.53) | 96.44(84.42–110.18) | 296.96(259.95–339.29) | 9.74% |
| Xinjiang | 9.78% | 14.07% | 102.54(90.72–115.56) | 551.91(488.29–621.98) | 1.52(1.05–2.09) | 8.18(5.63–11.25) | 104.06(91.77–117.65) | 560.09(493.92–633.23) | 13.98% |
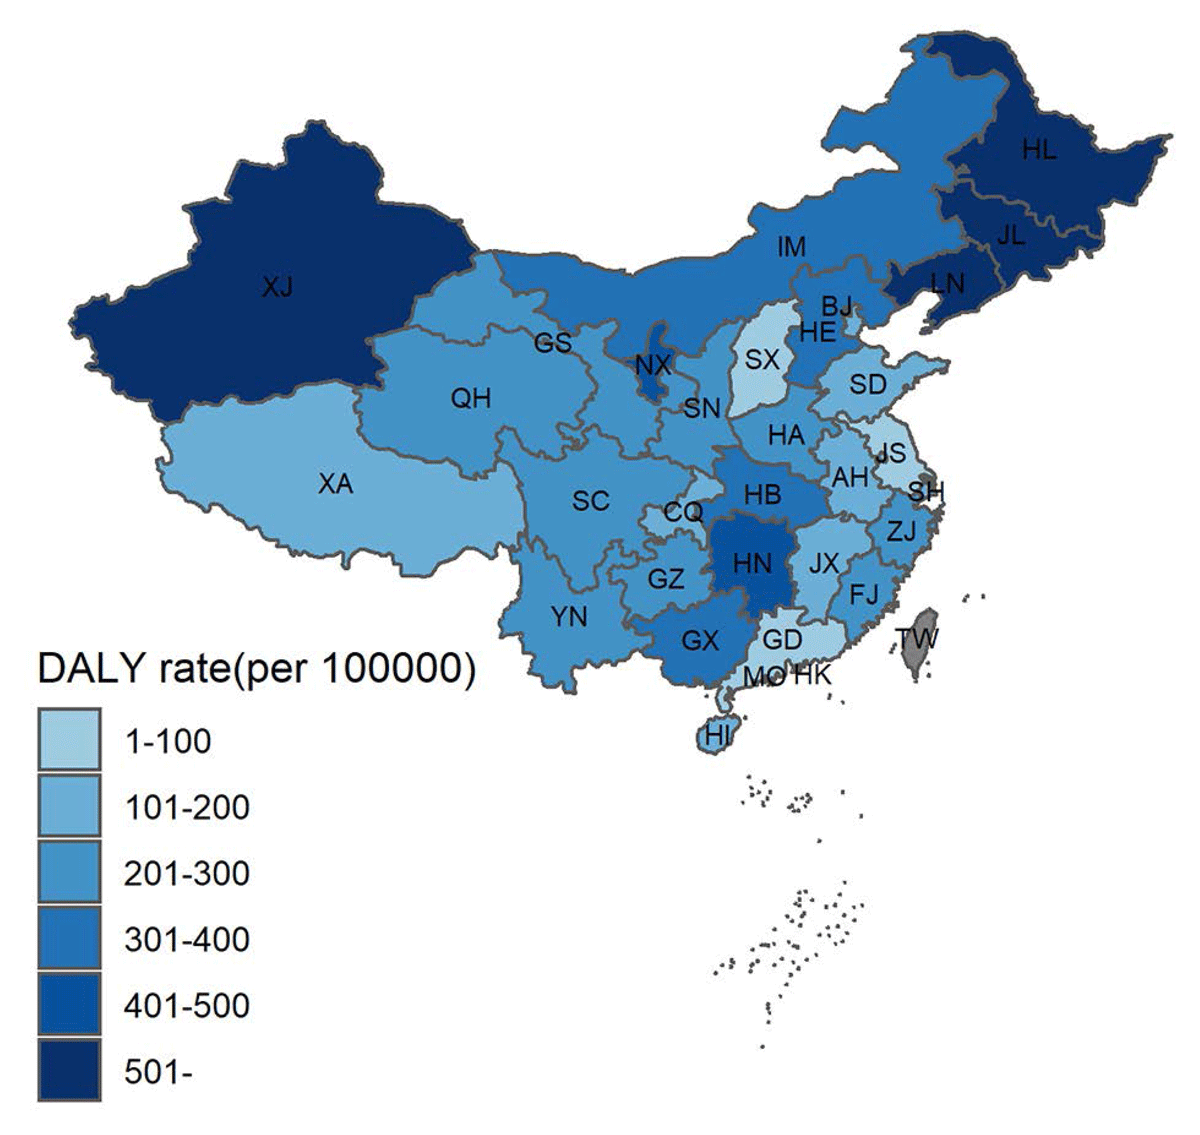
Figure 3
Map of age-standardized CHD DALY rate (per 100 000) induced by foodborne inorganic arsenic (iAs) intake in China.
Table 4
DALY of lung, bladder and skin cancer attributed to foodborne inorganic arsenic (iAs) intake in 31 provinces in China in 2016.
| PROVINCES | LUNG CANCER (IN THOUSANDS) | BLADDER CANCER (IN THOUSANDS) | SKIN CANCER (IN THOUSANDS) | TOTAL(IN THOUSANDS) | TOTAL PER 100,000 | PROPORTION OF DALY RELATED TO FOODBORNE iAs (%) |
|---|---|---|---|---|---|---|
| China | 314.24(297.81–326.57) | 9.89(9.32–11.42) | 167.32(143.13–180.11) | 491.46(450.26–518.1) | 35.54(32.56–37.47) | 3.01% |
| North | ||||||
| Beijing | 3.09(2.53–3.66) | 0.08(0.06–0.1) | 0.81(0.53–1.18) | 3.99(3.12–4.94) | 18.37(14.37–22.71) | 2.18% |
| Hebei | 18.9(15.67–22.37) | 0.69(0.53–0.93) | 27.38(19.13–35.17) | 46.97(35.33–58.47) | 62.88(47.29–78.27) | 5.72% |
| Inner Mongolia | 5.62(4.73–6.64) | 0.2(0.16–0.24) | 7.11(5.31–8.72) | 12.92(10.21–15.6) | 51.29(40.5–61.89) | 4.80% |
| Shanxi | 6.21(4.94–7.56) | 0.17(0.13–0.22) | 5.99(4.53–7.45) | 12.37(9.61–15.23) | 33.58(26.09–41.37) | 3.62% |
| Tianjin | 2.31(1.95–3.86) | 0.07(0.05–0.08) | 0.62(0.48–0.88) | 2.99(2.48–4.82) | 19.16(15.86–30.84) | 1.47% |
| Northeast | ||||||
| Heilongjiang | 14.36(11.94–17.03) | 0.32(0.26–0.39) | 5.15(4.15–6.78) | 19.83(16.35–24.19) | 52.21(43.03–63.68) | 2.53% |
| Jilin | 10.83(8.77–12.79) | 0.35(0.27–0.42) | 25.8(17.15–33.37) | 36.98(26.2–46.58) | 135.32(95.86–170.43) | 9.99% |
| Liaoning | 15.44(12.84–18.37) | 0.44(0.33–0.53) | 7.33(5.41–8.93) | 23.21(18.58–27.83) | 53.02(42.43–63.58) | 2.74% |
| East | ||||||
| Anhui | 13.4(11.27–16) | 0.49(0.41–0.6) | 5.66(4.47–6.71) | 19.55(16.14–23.31) | 31.55(26.06–37.62) | 2.68% |
| Fujian | 13.07(10.78–15.8) | 0.39(0.31–0.52) | 5.03(3.97–6.54) | 18.49(15.06–22.86) | 47.73(38.87–59.01) | 4.65% |
| Jiangsu | 14.75(12.28–17.52) | 0.47(0.38–0.57) | 4.5(3.39–5.55) | 19.72(16.06–23.64) | 24.65(20.07–29.56) | 1.84% |
| Jiangxi | 12.58(10.71–14.81) | 0.45(0.37–0.57) | 7.8(6.33–9.3) | 20.83(17.42–24.68) | 45.37(37.93–53.75) | 4.66% |
| Shandong | 20.02(16.73–23.73) | 0.61(0.51–0.75) | 11.02(8.85–13.63) | 31.66(26.1–38.11) | 31.83(26.23–38.31) | 2.06% |
| Shanghai | 2.82(2.31–3.42) | 0.09(0.06–0.11) | 0.82(0.52–1.06) | 3.73(2.9–4.59) | 15.41(11.97–18.99) | 1.67% |
| Zhejiang | 15.81(12.99–18.97) | 0.54(0.43–0.65) | 4.13(3.04–5.39) | 20.48(16.47–25.01) | 36.63(29.46–44.75) | 3.00% |
| Central | ||||||
| Henan | 21.89(18.3–25.83) | 0.87(0.69–1.32) | 17.17(13.99–20.78) | 39.93(32.98–47.93) | 41.89(34.6–50.28) | 4.12% |
| Hubei | 20.08(16.79–23.82) | 0.61(0.5–0.73) | 7.99(6.53–10.05) | 28.67(23.81–34.61) | 48.72(40.47–58.81) | 3.59% |
| Hunan | 24.85(20.83–30.04) | 1(0.79–1.4) | 24.45(18.5–29.98) | 50.31(40.13–61.42) | 73.74(58.82–90.03) | 5.27% |
| South | ||||||
| Guangdong | 17.53(14.64–20.85) | 0.49(0.41–0.62) | 4.35(3.28–5.61) | 22.37(18.33–27.09) | 20.34(16.66–24.63) | 2.36% |
| Guangxi | 14.79(12.43–17.76) | 0.51(0.4–0.82) | 6.99(5.73–8.66) | 22.3(18.56–27.24) | 46.09(38.37–56.3) | 5.03% |
| Hainan | 1.65(1.32–2.06) | 0.06(0.04–0.08) | 0.7(0.52–1.03) | 2.41(1.89–3.17) | 26.26(20.63–34.6) | 3.77% |
| Southwest | ||||||
| Chongqing | 7.14(5.71–8.9) | 0.23(0.18–0.3) | 2.85(2.23–3.83) | 10.22(8.13–13.03) | 33.52(26.66–42.75) | 2.46% |
| Guizhou | 6.3(5.18–7.53) | 0.31(0.25–0.38) | 9.54(7.09–12.03) | 16.15(12.52–19.94) | 45.42(35.23–56.1) | 5.34% |
| Sichuan | 31.13(25.2–36.57) | 1.15(0.91–1.4) | 21.68(17.49–25.99) | 53.96(43.59–63.96) | 65.31(52.77–77.41) | 4.04% |
| Tibet | 0.54(0.44–0.65) | 0.04(0.03–0.07) | 0.85(0.66–1.08) | 1.43(1.14–1.79) | 43.13(34.3–54.19) | 26.75% |
| Yunnan | 10.05(8.47–12.02) | 0.38(0.32–0.48) | 7.46(5.74–9.12) | 17.89(14.52–21.62) | 37.5(30.44–45.31) | 4.75% |
| Northwest | ||||||
| Gansu | 5.03(4.19–6.01) | 0.16(0.13–0.2) | 2.27(1.88–2.66) | 7.46(6.2–8.86) | 28.58(23.77–33.96) | 4.65% |
| Ningxia | 1.69(1.37–2.06) | 0.04(0.03–0.05) | 0.34(0.28–0.41) | 2.08(1.68–2.52) | 30.76(24.92–37.37) | 4.89% |
| Qinghai | 1.24(1.01–1.48) | 0.05(0.04–0.07) | 0.72(0.59–0.86) | 2.01(1.64–2.41) | 33.9(27.58–40.63) | 5.82% |
| Shaanxi | 7.72(6.17–9.6) | 0.29(0.23–0.4) | 6.74(5.5–8.14) | 14.75(11.9–18.14) | 38.69(31.21–47.58) | 4.77% |
| Xinjiang | 3.86(3.19–4.57) | 0.12(0.09–0.19) | 1.3(1.04–1.56) | 5.29(4.32–6.32) | 22.05(18.02–26.34) | 4.05% |
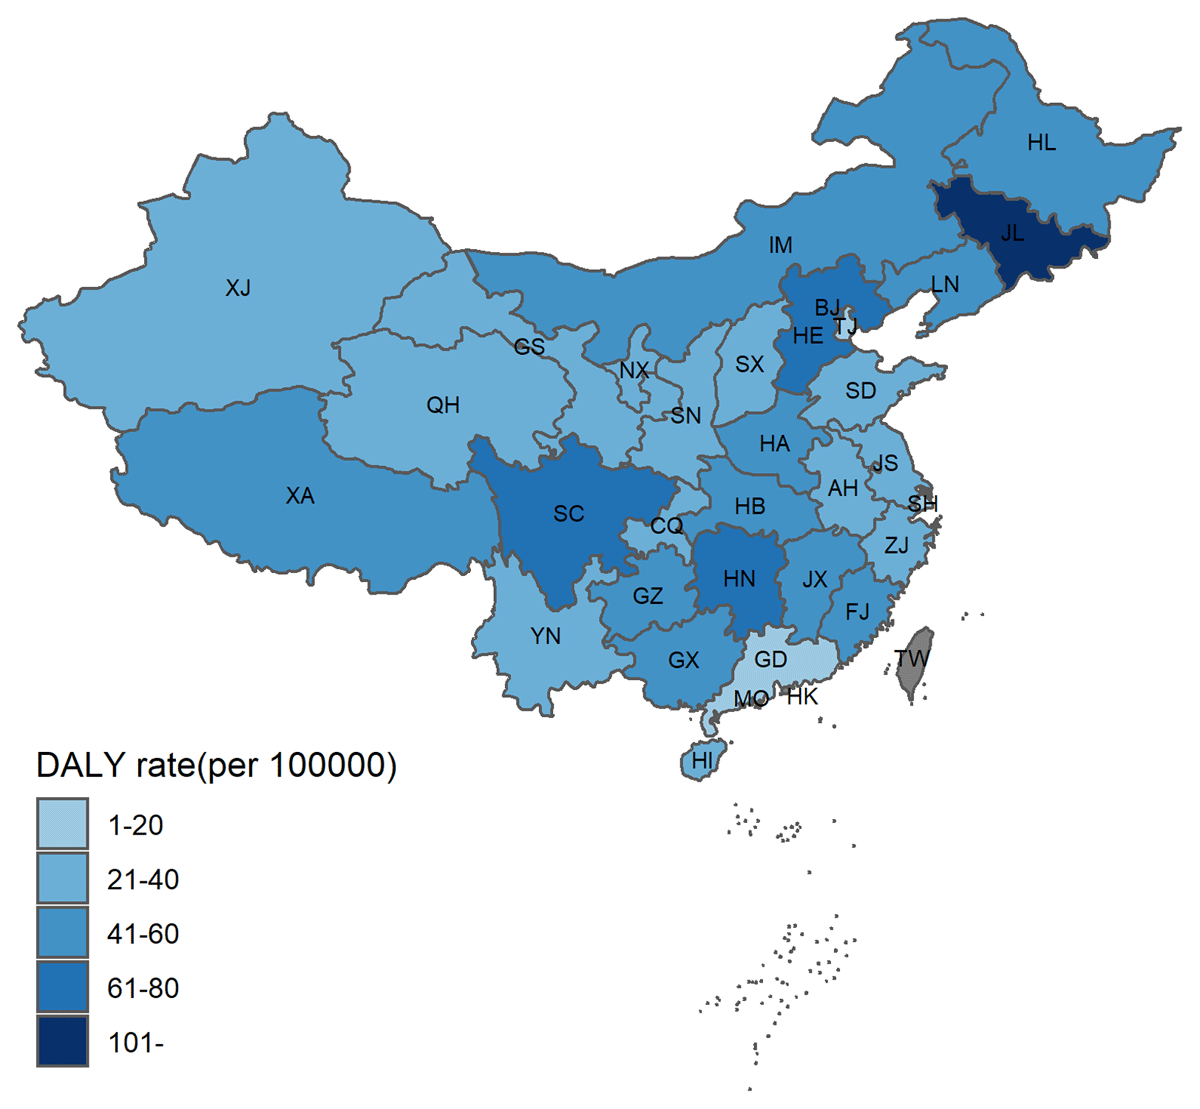
Figure 4
Map of age-standardized cancer DALY rate (per 100 000) induced by foodborne inorganic arsenic (iAs) intake in China.