
Table 1
Demographic Characteristics and Sexual Health Knowledge of Schools 1 and 2.
| Total | School 1 | School 2 | |
|---|---|---|---|
| Number of participants; n (%) | 204 | 174 (85.3%) | 30 (14.7%) |
| Age; years (SD) | 14.8 (±1.8) | 14.7 (±2.0) | 15.8 (±1.2) |
| Gender; n (%)** | |||
| Female | 94 (46.1%) | 92 (52.9%) | 2 (6.7%) |
| Male | 107 (52.5%) | 79 (45.4%) | 28 (93.3%) |
| Race; n (%) | |||
| Mestizo | 192 (94.1%) | 166 (95.4%) | 26 (86.7%) |
| Indigenous | 4 (2.0%) | 4 (2.3%) | 0 (0.0%) |
| White | 1 (0.5%) | 1 (0.6%) | 0 (0.0%) |
| Afroecuadorian | 1 (0.5%) | 1 (0.6%) | 0 (0.0%) |
| Other | 2 (1.0%) | 0 (0.0%) | 2 (6.6%) |
| Phone access; n (%) | |||
| Has personal phone | 134 (65.7%) | 63 (67.0%) | 71 (66.4%) |
| Has smartphone | 80 (39.2%) | 33 (35.1%) | 47 (43.9%) |
| Can receive text messages | 139 (68.1%) | 116 (66.7%) | 23 (76.7%) |
| Sexual Activity/Knowledge; n (%) | |||
| Is sexually active | 54 (26.5%) | 35 (20.1%) | 19 (63.3%)* |
| Is sexually active, >15 years old | 2 (1.0%) | 2 (1.1%) | 0 (0.0%) |
| Is sexually active, <15 years old | 52 (44.4%) | 33 (19.0%) | 19 (65.5%)* |
| Access to contraceptives | 77 (37.7%) | 57 (32.8%) | 20 (66.6%)** |
| Always uses protection during sex | 35 (39.8%) | 25 (39.1%) | 10 (41.7%) |
| Sometimes uses protection | 27 (30.7%) | 17 (26.6%) | 10 (41.7%) |
| Never uses protection | 26 (29.5%) | 22 (34.4%) | 4 (16.7%) |
| Knows it is possible to prevent pregnancy | 172 (84.3%) | 144 (82.8%) | 28 (93.3%) |
| Knows how to prevent pregnancy | 154 (75.5%) | 134 (77.0%) | 20 (66.6%) |
| Could list at least one way to prevent pregnancy | 170 (83.3%) | 147 (84.5%) | 23 (79.3%) |
| Could list multiple ways to prevent pregnancy | 95 (46.6%) | 84 (48.2%) | 11 (37.9%) |
| Access to STD information (HIV, Zika, etc.) | 131 (64.2%) | 111 (63.8%) | 20 (66.6%) |
| Correctly identified how STDs are transmitted | 73 (35.8%) | 66 (37.9%) | 7 (23.3%) |
[i] n = number, % = percent, SD = standard deviation, STDs = sexually transmitted diseases. * p < .05. ** p < .01. Cumbayá and Lumbisí, Ecuador, November 2016.
Table 2
Desired Information and Sexual Health Access, male/female.
| Total | Male | Female | |
|---|---|---|---|
| Received sexual health education; n (%) | 173 (84.8%) | 84 (78.5%) | 89 (94.7%)** |
| Want more sexual health information n (%) | 178 (87.3%) | 82 (78.1%) | 91 (96.8%)** |
| Persons consulted regarding sexual health questions; n (%) | |||
| Parents | 128 (62.7%) | 59 (55.1%) | 67 (71.3%)* |
| Friends | 38 (18.6%) | 22 (20.6%) | 16 (17.0%) |
| Brother/sister | 25 (12.3%) | 16 (15.0%) | 8 (8.0%) |
| Doctor | 17 (8.3%) | 9 (8.4%) | 8 (8.5%) |
| Teacher | 7 (3.4%) | 4 (3.7%) | 3 (3.2%) |
| Other (Family members, internet, no one) | 21 (10.3%) | 10 (9.3%) | 11 (11.7%) |
| Who did you consult the last time you had a question about sexual health? n (%) | |||
| Parents | 119 (58.3%) | 59 (55.1%) | 60 (63.8%) |
| Friend | 16 (7.8%) | 11 (10.3%) | 5 (5.3%) |
| Sibling | 15 (7.4%) | 10 (9.3%) | 5 (5.3%) |
| No one | 10 (4.9%) | 8 (7.5%) | 2 (2.1%) |
| Personal investigation (literature, internet, health talk) | 10 (4.9%) | 4 (3.7%) | 6 (6.4%) |
| Doctor | 8 (3.9%) | 1 (0.9%) | 7 (7.4%) |
| Teacher | 5 (2.5%) | 2 (1.9%) | 3 (3.2%) |
| Aunt/Uncle | 5 (2.5%) | 4 (3.7%) | 1 (1.1%) |
| Other (Family members) | 16 (7.8%) | 12 (11.2%) | 4 (4.3%) |
| Comfortable asking parents a sexual health question n (%) | |||
| Always | 33 (16.2%) | 14 (13.1%) | 18 (19.1%) |
| Sometimes | 104 (51.0%) | 71 (66.4%) | 62 (66.0%) |
| Never | 37 (18.1%) | 37 (18.1%) | 14 (14.9%) |
| Easy access to physician for sexual health question n (%) | |||
| Always | 28 (13.7%) | 13 (12.1%) | 15 (16.0%) |
| Sometimes | 106 (52.0%) | 52 (48.6%) | 52 (55.3%) |
| Never | 69 (33.8%) | 42 (39.3%) | 26 (27.7%) |
| Can speak to a physician outside of an appointment n (%) | |||
| Always | 8 (3.9%) | 4 (3.7%) | 4 (4.3%) |
| Sometimes | 63 (30.9%) | 31 (29.0%) | 32 (34.0%) |
| Never | 126 (61.8%) | 68 (63.6%) | 58 (61.7%) |
| Would you participate in a sexual health education program through technology, which connects you with a doctor to answer your questions and provide information? n (%) | |||
| Yes | 130 (63.7%) | 62 (58.5%) | 65 (70.7%) |
| Occasionally | 32 (15.7%) | 22 (20.8%) | 10 (14.1%) |
| Maybe | 32 (15.7%) | 19 (17.9%) | 13 (14.1%) |
| Never | 7 (3.4%) | 3 (2.8%) | 4 (4.3%) |
[i] n = number, % = percent. * p < .05. ** p < .01. Cumbayá and Lumbisi, Ecuador, November 2016.
Table 3
Focus group topics, Responses and Relevance to Quantitative Data and Program Design.
| Topic | Researcher Observations and Participant Responses (“”) | Relevance |
|---|---|---|
| Sexual health knowledge |
|
|
| Information sources |
|
|
| Information desires |
|
|
| Technology preference |
|
|
| Other gender’s interest |
|
|
| After school activities |
|
|
| Fear to speak |
|
|
[i] Cumbayá, Ecuador, November 2016.
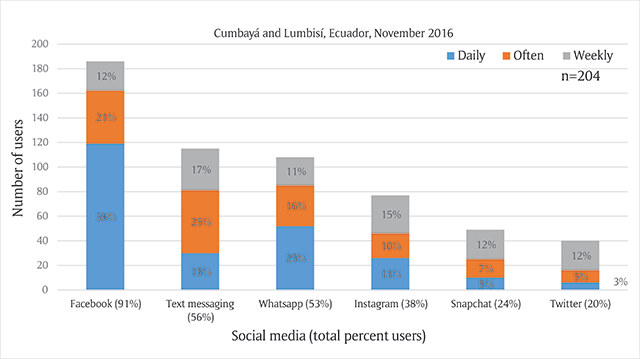
Figure 1
Total Participants and Frequency of Social Media Use.